- +1-315-215-1633
- sales@thebrainyinsights.com

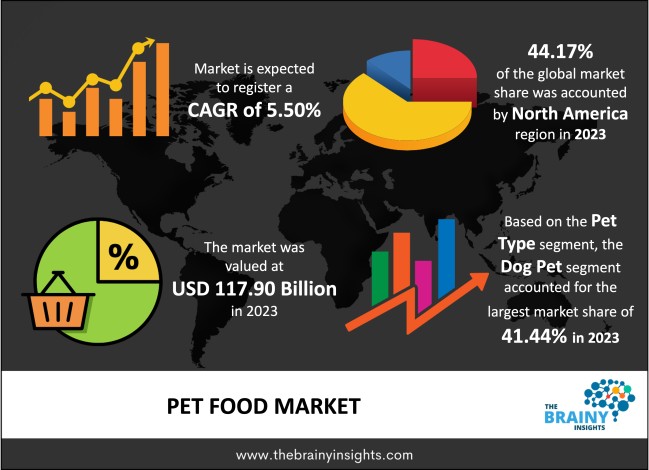
The global pet food market was valued at USD 117.90 billion in 2023 and grew at a CAGR of 5.50% from 2024 to 2033. The market is expected to reach USD 201.39 billion by 2033. It is expected that increased consumer interest in adopting pets and increasing concerns about their health would fuel demand for the product. Additionally, the consumption of nutrient-rich food by pets is anticipated to improve their general digestion and function throughout the course of the forecast period. Rarely do the pet food items that are sold on the international market vary. In order to combat this similarity bias, producers have been compelled to integrate multi-functional and creative components in their goods. Given the rising popularity of prepared pet food, convenience is anticipated to be a key factor in the growth of this market. Also, the introduction of many new products, such as toothpaste, wipes, smart toys, and automatic feeders, has gone well with the consumers. This shows a shift of the consumer towards more sophisticated and functional care products.
A lot of people took advantage of the lockdown's opportunity to get a family pet because they were working from home at that time. According to several studies, having a pet makes people less likely to experience issues like loneliness and depression because pets provide companionship. Breeders and rescue organizations reported a surge in requests from persons searching for dogs in the first few months of 2020. In the 12 weeks between February and May 2020, the total sales of cat and dog treats increased by 6.5%, according to research released by Mars Petcare, a top maker of pet foods. This represents the expansion of the pet food business, which is anticipated to continue after the pandemic.
Get an overview of this study by requesting a free sample
The pet food business is significantly being driven by the increasing number of pet owners throughout the world. The fact that people view their pets as family members and companions increases the demand for pet food items. Additionally, owners of pets are becoming more conscious of the need for good nutrition for their animals' general health and well-being. Pet food items that cater to certain dietary requirements, encourage weight control or address health issues like allergies or joint health are in greater demand.
The price of the basic ingredients required to make pet food, such as grains, meat, and vegetables, can vary greatly. Environment-related factors, interruptions in supply chains, and worldwide market dynamics are just a few examples of the variables that might increase costs and affect pet food makers' profitability. There are many companies competing for market share in the fiercely competitive pet food industry. Price conflicts narrowed profit margins, and a need for ongoing innovation to stay ahead are all potential outcomes of this rivalry. Small businesses and newcomers find it difficult to build their brands and stand out from the competition.
Pet ownership is significantly rising in emerging countries, notably in areas like Asia-Pacific and South America. More individuals are adopting pets as disposable incomes rise and urbanization keeps going, which is fueling an increase in the demand for pet food items in these markets. The emphasis on pet wellness and health gives an opportunity for businesses to create and market pet food items that meet certain dietary requirements, improve joint health, encourage weight control, or accommodate animals with allergies or sensitivities. Among health-conscious pet owners, formulations that combine functional substances and organic, high-quality ingredients are becoming more and more popular.
North America led the market in 2023 with the largest market share of 44.17%. This is linked to the growing customer knowledge of the product's positive health effects as well as the expanding trend of relating to pets. Due to the large number of pet owners and the existence of a thriving pet food sector, the North American market-led in 2023, and is expected to grow significantly in the forecast period.
North America Region Pet Food Market Share in 2023 - 44.17%
www.thebrainyinsights.com
Check the geographical analysis of this market by requesting a free sample
The dog pet segment dominated the global market in 2023 with a market share of 41.44%. Due to a rise in dog owners' worries about their dogs' health, more people are choosing to keep dogs as pets at home, which has resulted in higher household spending on nutritious dog food. Dogs are carnivorous animals, hence the majority of their diet consists of meat. Dogs have relatively low carbohydrate requirements, which has increased demand for foods with greater amounts of meat and reduced starch contents.
The dry segment held a significant market share of 57.21% in 2023. The owners' favorite pet food option is in the form of dry food. This is explained by the simple fact that dry-form items are more convenient and have a longer shelf life than wet food. The most popular choice for dogs is dry food since it is inexpensive and accessible to many dog owners. Additionally, due to their solid form, dry food for pets helps to maintain oral cleanliness in addition to their dental health.
The supermarkets/hypermarkets segment dominated the global market in 2023 with a market share of 61.22%. Major retail distribution channels for pet food items include supermarkets and hypermarkets. Due to the huge selection of pet food brands, tastes, and types available at these businesses, it is simple for pet owners to buy food for their animals while doing their usual grocery shopping. Customers can readily reach supermarkets and hypermarkets since they are frequently put in handy spots inside residential neighborhoods. They have longer hours, which allows pet owners to buy pet food whenever it suits them without having to go to a store for pets.
| Attribute | Description |
|---|---|
| Market Size | Revenue (USD Billion) |
| Market size value in 2023 | USD 117.90 Billion |
| Market size value in 2033 | USD 201.39 Billion |
| CAGR (2024 to 2033) | 5.50% |
| Historical data | 2020-2022 |
| Base Year | 2023 |
| Forecast | 2024-2033 |
| Region | The regions analyzed for the market are Asia Pacific, Europe, South America, North America, and Middle East & Africa. Furthermore, the regions are further analyzed at the country level. |
| Segments | Pet Type, Form, Distribution Channel |
As per The Brainy Insights, the size of the pet food market was valued at USD 117.90 billion in 2023 to USD 201.39 billion by 2033.
The global Pet Food market is growing at a CAGR of 5.50% during the forecast period 2024-2033.
The North America region emerged as the largest market for the pet food.
The increasing number of pet owners will influence the market's growth.
1. Introduction
1.1. Objectives of the Study
1.2. Market Definition
1.3. Research Scope
1.4. Currency
1.5. Key Target Audience
2. Research Methodology and Assumptions
3. Executive Summary
4. Premium Insights
4.1. Porter’s Five Forces Analysis
4.2. Value Chain Analysis
4.3. Top Investment Pockets
4.3.1. Market Attractiveness Analysis by Pet Type
4.3.2. Market Attractiveness Analysis by Form
4.3.3. Market Attractiveness Analysis by Distribution Channel
4.3.4. Market Attractiveness Analysis by Region
4.4. Industry Trends
5. Market Dynamics
5.1. Market Evaluation
5.2. Drivers
5.2.1. Increasing number of pet owners
5.3. Restraints
5.3.1. Fluctuating raw material prices
5.4. Opportunities
5.4.1. Pet ownership is significantly rising in emerging countries
6. Global Pet Food Market Analysis and Forecast, By Pet Type
6.1. Segment Overview
6.2. Cat
6.3. Dog
6.4. Others
7. Global Pet Food Market Analysis and Forecast, By Form
7.1. Segment Overview
7.2. Wet
7.3. Dry
7.4. Snacks & Treats
8. Global Pet Food Market Analysis and Forecast, By Distribution Channel
8.1. Segment Overview
8.2. Supermarkets/Hypermarkets
8.3. Specialty Pet Food Stores
8.4. Online
8.5. Others
9. Global Pet Food Market Analysis and Forecast, By Regional Analysis
9.1. Segment Overview
9.2. North America
9.2.1. U.S.
9.2.2. Canada
9.2.3. Mexico
9.3. Europe
9.3.1. Germany
9.3.2. France
9.3.3. U.K.
9.3.4. Italy
9.3.5. Spain
9.4. Asia-Pacific
9.4.1. Japan
9.4.2. China
9.4.3. India
9.5. South America
9.5.1. Brazil
9.6. Middle East and Africa
9.6.1. UAE
9.6.2. South Africa
10. Global Pet Food Market-Competitive Landscape
10.1. Overview
10.2. Market Share of Key Players in the Pet Food Market
10.2.1. Global Company Market Share
10.2.2. North America Company Market Share
10.2.3. Europe Company Market Share
10.2.4. APAC Company Market Share
10.3. Competitive Situations and Trends
10.3.1. Product Launches and Developments
10.3.2. Partnerships, Collaborations, and Agreements
10.3.3. Mergers & Acquisitions
10.3.4. Expansions
11. Company Profiles
11.1. Hill’s Pet Nutrition, Inc.
11.1.1. Business Overview
11.1.2. Company Snapshot
11.1.3. Company Market Share Analysis
11.1.4. Company Product Portfolio
11.1.5. Recent Developments
11.1.6. SWOT Analysis
11.2. General Mills Inc.
11.2.1. Business Overview
11.2.2. Company Snapshot
11.2.3. Company Market Share Analysis
11.2.4. Company Product Portfolio
11.2.5. Recent Developments
11.2.6. SWOT Analysis
11.3. WellPet LLC
11.3.1. Business Overview
11.3.2. Company Snapshot
11.3.3. Company Market Share Analysis
11.3.4. Company Product Portfolio
11.3.5. Recent Developments
11.3.6. SWOT Analysis
11.4. The Hartz Mountain Corporation
11.4.1. Business Overview
11.4.2. Company Snapshot
11.4.3. Company Market Share Analysis
11.4.4. Company Product Portfolio
11.4.5. Recent Developments
11.4.6. SWOT Analysis
11.5. The J.M. Smucker Company
11.5.1. Business Overview
11.5.2. Company Snapshot
11.5.3. Company Market Share Analysis
11.5.4. Company Product Portfolio
11.5.5. Recent Developments
11.5.6. SWOT Analysis
11.6. Nestle Purina
11.6.1. Business Overview
11.6.2. Company Snapshot
11.6.3. Company Market Share Analysis
11.6.4. Company Product Portfolio
11.6.5. Recent Developments
11.6.6. SWOT Analysis
11.7. Mars, Incorporated
11.7.1. Business Overview
11.7.2. Company Snapshot
11.7.3. Company Market Share Analysis
11.7.4. Company Product Portfolio
11.7.5. Recent Developments
11.7.6. SWOT Analysis
11.8. LUPUS Alimentos
11.8.1. Business Overview
11.8.2. Company Snapshot
11.8.3. Company Market Share Analysis
11.8.4. Company Product Portfolio
11.8.5. Recent Developments
11.8.6. SWOT Analysis
11.9. LUPUS Alimentos
11.9.1. Business Overview
11.9.2. Company Snapshot
11.9.3. Company Market Share Analysis
11.9.4. Company Product Portfolio
11.9.5. Recent Developments
11.9.6. SWOT Analysis
List of Table
1. Global Pet Food Market, By Pet Type, 2020 - 2033 (USD Billion)
2. Global Cat, Pet Food Market, By Region, 2020 - 2033 (USD Billion)
3. Global Dog, Pet Food Market, By Region, 2020 - 2033 (USD Billion)
4. Global Others, Pet Food Market, By Region, 2020 - 2033 (USD Billion)
5. Global Pet Food Market, By Form, 2020 - 2033 (USD Billion)
6. Global Wet, Pet Food Market, By Region, 2020 - 2033 (USD Billion)
7. Global Dry, Pet Food Market, By Region, 2020 - 2033 (USD Billion)
8. Global Snacks & Treats, Pet Food Market, By Region, 2020 - 2033 (USD Billion)
9. Global Pet Food Market, By Distribution Channel, 2020 - 2033 (USD Billion)
10. Global Supermarkets/Hypermarkets, Pet Food Market, By Region, 2020 - 2033 (USD Billion)
11. Global Specialty Pet Food Stores, Pet Food Market, By Region, 2020 - 2033 (USD Billion)
12. Global Online, Pet Food Market, By Region, 2020 - 2033 (USD Billion)
13. Global Others, Pet Food Market, By Region, 2020 - 2033 (USD Billion)
14. Global Pet Food Market, By Region, 2020 - 2033 (USD Billion)
15. North America Pet Food Market, By Pet Type, 2020 - 2033 (USD Billion)
16. North America Pet Food Market, By Form, 2020 - 2033 (USD Billion)
17. North America Pet Food Market, By Distribution Channel, 2020 - 2033 (USD Billion)
18. U.S. Pet Food Market, By Pet Type, 2020 - 2033 (USD Billion)
19. U.S. Pet Food Market, By Form, 2020 - 2033 (USD Billion)
20. U.S. Pet Food Market, By Distribution Channel, 2020 - 2033 (USD Billion)
21. Canada Pet Food Market, By Pet Type, 2020 - 2033 (USD Billion)
22. Canada Pet Food Market, By Form, 2020 - 2033 (USD Billion)
23. Canada Pet Food Market, By Distribution Channel, 2020 - 2033 (USD Billion)
24. Mexico Pet Food Market, By Pet Type, 2020 - 2033 (USD Billion)
25. Mexico Pet Food Market, By Form, 2020 - 2033 (USD Billion)
26. Mexico Pet Food Market, By Distribution Channel, 2020 - 2033 (USD Billion)
27. Europe Pet Food Market, By Pet Type, 2020 - 2033 (USD Billion)
28. Europe Pet Food Market, By Form, 2020 - 2033 (USD Billion)
29. Europe Pet Food Market, By Distribution Channel, 2020 - 2033 (USD Billion)
30. Germany Pet Food Market, By Pet Type, 2020 - 2033 (USD Billion)
31. Germany Pet Food Market, By Form, 2020 - 2033 (USD Billion)
32. Germany Pet Food Market, By Distribution Channel, 2020 - 2033 (USD Billion)
33. France Pet Food Market, By Pet Type, 2020 - 2033 (USD Billion)
34. France Pet Food Market, By Form, 2020 - 2033 (USD Billion)
35. France Pet Food Market, By Distribution Channel, 2020 - 2033 (USD Billion)
36. U.K. Pet Food Market, By Pet Type, 2020 - 2033 (USD Billion)
37. U.K. Pet Food Market, By Form, 2020 - 2033 (USD Billion)
38. U.K. Pet Food Market, By Distribution Channel, 2020 - 2033 (USD Billion)
39. Italy Pet Food Market, By Pet Type, 2020 - 2033 (USD Billion)
40. Italy Pet Food Market, By Form, 2020 - 2033 (USD Billion)
41. Italy Pet Food Market, By Distribution Channel, 2020 - 2033 (USD Billion)
42. Spain Pet Food Market, By Pet Type, 2020 - 2033 (USD Billion)
43. Spain Pet Food Market, By Form, 2020 - 2033 (USD Billion)
44. Spain Pet Food Market, By Distribution Channel, 2020 - 2033 (USD Billion)
45. Asia Pacific Pet Food Market, By Pet Type, 2020 - 2033 (USD Billion)
46. Asia Pacific Pet Food Market, By Form, 2020 - 2033 (USD Billion)
47. Asia Pacific Pet Food Market, By Distribution Channel, 2020 - 2033 (USD Billion)
48. Japan Pet Food Market, By Pet Type, 2020 - 2033 (USD Billion)
49. Japan Pet Food Market, By Form, 2020 - 2033 (USD Billion)
50. Japan Pet Food Market, By Distribution Channel, 2020 - 2033 (USD Billion)
51. China Pet Food Market, By Pet Type, 2020 - 2033 (USD Billion)
52. China Pet Food Market, By Form, 2020 - 2033 (USD Billion)
53. China Pet Food Market, By Distribution Channel, 2020 - 2033 (USD Billion)
54. India Pet Food Market, By Pet Type, 2020 - 2033 (USD Billion)
55. India Pet Food Market, By Form, 2020 - 2033 (USD Billion)
56. India Pet Food Market, By Distribution Channel, 2020 - 2033 (USD Billion)
57. South America Pet Food Market, By Pet Type, 2020 - 2033 (USD Billion)
58. South America Pet Food Market, By Form, 2020 - 2033 (USD Billion)
59. South America Pet Food Market, By Distribution Channel, 2020 - 2033 (USD Billion)
60. Brazil Pet Food Market, By Pet Type, 2020 - 2033 (USD Billion)
61. Brazil Pet Food Market, By Form, 2020 - 2033 (USD Billion)
62. Brazil Pet Food Market, By Distribution Channel, 2020 - 2033 (USD Billion)
63. Middle East and Africa Pet Food Market, By Pet Type, 2020 - 2033 (USD Billion)
64. Middle East and Africa Pet Food Market, By Form, 2020 - 2033 (USD Billion)
65. Middle East and Africa Pet Food Market, By Distribution Channel, 2020 - 2033 (USD Billion)
66. UAE Pet Food Market, By Pet Type, 2020 - 2033 (USD Billion)
67. UAE Pet Food Market, By Form, 2020 - 2033 (USD Billion)
68. UAE Pet Food Market, By Distribution Channel, 2020 - 2033 (USD Billion)
69. South Africa Pet Food Market, By Pet Type, 2020 - 2033 (USD Billion)
70. South Africa Pet Food Market, By Form, 2020 - 2033 (USD Billion)
71. South Africa Pet Food Market, By Distribution Channel, 2020 - 2033 (USD Billion)
List of Figures
1. Global Pet Food Market Segmentation
2. Pet Food Market: Research Methodology
3. Market Size Estimation Methodology: Bottom-Up Approach
4. Market Size Estimation Methodology: Top-Down Approach
5. Data Triangulation
6. Porter’s Five Forces Analysis
7. Value Chain Analysis
8. Global Pet Food Market Attractiveness Analysis by Pet Type
9. Global Pet Food Market Attractiveness Analysis by Form
10. Global Pet Food Market Attractiveness Analysis by Distribution Channel
11. Global Pet Food Market Attractiveness Analysis by Region
12. Global Pet Food Market: Dynamics
13. Global Pet Food Market Share by Pet Type (2023 & 2033)
14. Global Pet Food Market Share by Form (2023 & 2033)
15. Global Pet Food Market Share by Distribution Channel (2023 & 2033)
16. Global Pet Food Market Share by Regions (2023 & 2033)
17. Global Pet Food Market Share by Company (2023)
This study forecasts revenue at global, regional, and country levels from 2020 to 2033. The Brainy Insights has segmented the global pet food market based on below-mentioned segments:
Global Pet Food Market by Pet Type:
Global Pet Food Market by Form:
Global Pet Food Market by Distribution Channel:
Global Pet Food Market by Region:
Research has its special purpose to undertake marketing efficiently. In this competitive scenario, businesses need information across all industry verticals; the information about customer wants, market demand, competition, industry trends, distribution channels etc. This information needs to be updated regularly because businesses operate in a dynamic environment. Our organization, The Brainy Insights incorporates scientific and systematic research procedures in order to get proper market insights and industry analysis for overall business success. The analysis consists of studying the market from a miniscule level wherein we implement statistical tools which helps us in examining the data with accuracy and precision.
Our research reports feature both; quantitative and qualitative aspects for any market. Qualitative information for any market research process are fundamental because they reveal the customer needs and wants, usage and consumption for any product/service related to a specific industry. This in turn aids the marketers/investors in knowing certain perceptions of the customers. Qualitative research can enlighten about the different product concepts and designs along with unique service offering that in turn, helps define marketing problems and generate opportunities. On the other hand, quantitative research engages with the data collection process through interviews, e-mail interactions, surveys and pilot studies. Quantitative aspects for the market research are useful to validate the hypotheses generated during qualitative research method, explore empirical patterns in the data with the help of statistical tools, and finally make the market estimations.
The Brainy Insights offers comprehensive research and analysis, based on a wide assortment of factual insights gained through interviews with CXOs and global experts and secondary data from reliable sources. Our analysts and industry specialist assume vital roles in building up statistical tools and analysis models, which are used to analyse the data and arrive at accurate insights with exceedingly informative research discoveries. The data provided by our organization have proven precious to a diverse range of companies, facilitating them to address issues such as determining which products/services are the most appealing, whether or not customers use the product in the manner anticipated, the purchasing intentions of the market and many others.
Our research methodology encompasses an idyllic combination of primary and secondary initiatives. Key phases involved in this process are listed below:

The phase involves the gathering and collecting of market data and its related information with the help of different sources & research procedures.

The data procurement stage involves in data gathering and collecting through various data sources.
This stage involves in extensive research. These data sources includes:
Purchased Database: Purchased databases play a crucial role in estimating the market sizes irrespective of the domain. Our purchased database includes:
Primary Research: The Brainy Insights interacts with leading companies and experts of the concerned domain to develop the analyst team’s market understanding and expertise. It improves and substantiates every single data presented in the market reports. Primary research mainly involves in telephonic interviews, E-mail interactions and face-to-face interviews with the raw material providers, manufacturers/producers, distributors, & independent consultants. The interviews that we conduct provides valuable data on market size and industry growth trends prevailing in the market. Our organization also conducts surveys with the various industry experts in order to gain overall insights of the industry/market. For instance, in healthcare industry we conduct surveys with the pharmacists, doctors, surgeons and nurses in order to gain insights and key information of a medical product/device/equipment which the customers are going to usage. Surveys are conducted in the form of questionnaire designed by our own analyst team. Surveys plays an important role in primary research because surveys helps us to identify the key target audiences of the market. Additionally, surveys helps to identify the key target audience engaged with the market. Our survey team conducts the survey by targeting the key audience, thus gaining insights from them. Based on the perspectives of the customers, this information is utilized to formulate market strategies. Moreover, market surveys helps us to understand the current competitive situation of the industry. To be precise, our survey process typically involve with the 360 analysis of the market. This analytical process begins by identifying the prospective customers for a product or service related to the market/industry to obtain data on how a product/service could fit into customers’ lives.

Secondary Research: The secondary data sources includes information published by the on-profit organizations such as World bank, WHO, company fillings, investor presentations, annual reports, national government documents, statistical databases, blogs, articles, white papers and others. From the annual report, we analyse a company’s revenue to understand the key segment and market share of that organization in a particular region. We analyse the company websites and adopt the product mapping technique which is important for deriving the segment revenue. In the product mapping method, we select and categorize the products offered by the companies catering to domain specific market, deduce the product revenue for each of the companies so as to get overall estimation of the market size. We also source data and analyses trends based on information received from supply side and demand side intermediaries in the value chain. The supply side denotes the data gathered from supplier, distributor, wholesaler and the demand side illustrates the data gathered from the end customers for respective market domain.

The supply side for a domain specific market is analysed by:
The demand side for the market is estimated through:
In-house Library: Apart from these third-party sources, we have our in-house library of qualitative and quantitative information. Our in-house database includes market data for various industry and domains. These data are updated on regular basis as per the changing market scenario. Our library includes, historic databases, internal audit reports and archives.
Sometimes there are instances where there is no metadata or raw data available for any domain specific market. For those cases, we use our expertise to forecast and estimate the market size in order to generate comprehensive data sets. Our analyst team adopt a robust research technique in order to produce the estimates:
Data Synthesis: This stage involves the analysis & mapping of all the information obtained from the previous step. It also involves in scrutinizing the data for any discrepancy observed while data gathering related to the market. The data is collected with consideration to the heterogeneity of sources. Robust scientific techniques are in place for synthesizing disparate data sets and provide the essential contextual information that can orient market strategies. The Brainy Insights has extensive experience in data synthesis where the data passes through various stages:


Market Deduction & Formulation: The final stage comprises of assigning data points at appropriate market spaces so as to deduce feasible conclusions. Analyst perspective & subject matter expert based holistic form of market sizing coupled with industry analysis also plays a crucial role in this stage.
This stage involves in finalization of the market size and numbers that we have collected from data integration step. With data interpolation, it is made sure that there is no gap in the market data. Successful trend analysis is done by our analysts using extrapolation techniques, which provide the best possible forecasts for the market.
Data Validation & Market Feedback: Validation is the most important step in the process. Validation & re-validation via an intricately designed process helps us finalize data-points to be used for final calculations.

The Brainy Insights interacts with leading companies and experts of the concerned domain to develop the analyst team’s market understanding and expertise. It improves and substantiates every single data presented in the market reports. The data validation interview and discussion panels are typically composed of the most experienced industry members. The participants include, however, are not limited to:
Moreover, we always validate our data and findings through primary respondents from all the major regions we are working on.


Free Customization
Fortune 500 Clients
Free Yearly Update On Purchase Of Multi/Corporate License
Companies Served Till Date