- +1-315-215-1633
- sales@thebrainyinsights.com

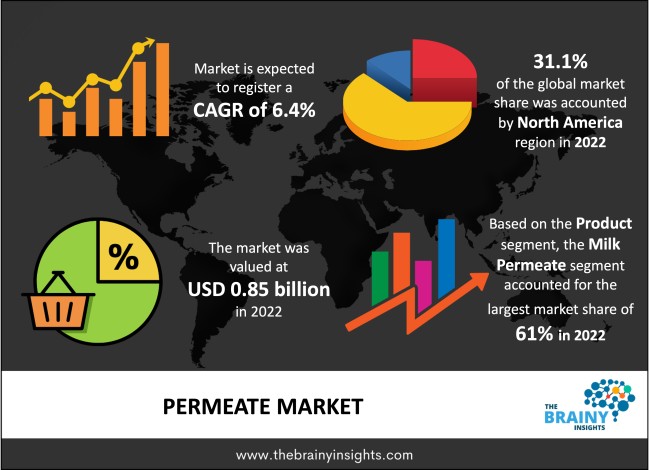
The global permeate market was valued at USD 0.85 billion in 2022 and growing at a CAGR of 6.4% from 2023 to 2032. The market is expected to reach USD 1.5 billion by 2032. Due to its high lactose and mineral content, permeate, a byproduct of the dairy industry, is often used as an inexpensive sweetener in food and beverages. There is a rising trend toward natural sweeteners with fewer calories as people become more health conscious. As permeate satisfies this requirement and is cost-effective for producers. Additionally, the high nutritional content of permeate makes it ideal for use in animal feed, opening up a new market in areas with large livestock industries.
The process of removing protein and other components from milk or whey is recognized to be the main way to produce permeate. They cause the food items to become salty and are frequently high in lactose. They are widely used in a variety of applications, such as the production of animal feed and food. In place of milk powder and skim milk, milk permeates are used. Most of them are made by separating the protein and other components from milk or whey.
Get an overview of this study by requesting a free sample
Permeate is well-known for its nutritional value and health advantages. It is a complete protein that is high in essential amino acids and easy to digest. The market penetration of permeate has been driven by the need for protein-rich and healthy food and drinks, particularly in areas such as sports nutrition, nutritional supplements, and dietary supplements.
Consumers' misconceptions about the flavor or texture of permeate goods may have an effect on whether or not they are accepted and used. Individuals might have different tastes, and for some consumers, the perceived flavor or aftertaste of permeate goods may be a restraint.
Opportunities for market expansion are also anticipated to arise from the increasing need for nutritional products and functional foods. Whey permeates and milk permeate are being added by manufacturers to food goods. such as energy drinks, morning cereal, protein bars, and other supplements. Over the projected period, it is anticipated that this tendency will continue to boost market growth.
The North America region dominated the market in 2022 with a market share of 31.3%. Increased consumer knowledge of the need for a well-balanced diet and the importance of protein requirements can be credited with the growth in the USA. Due to this, the demand for nutritional supplements along with other nutrient-rich products is rising. Additionally, the country's flourishing food and beverage industry offers opportunities for market players. With the rise of low-lactose permeate, an emerging trend in the beverage sector has emerged that allows for its usage as an antioxidant in drinks.
North America Region Permeate Market Share in 2022 - 31.3%
www.thebrainyinsights.com
Check the geographical analysis of this market by requesting a free sample
Milk permeate segment is likely to dominate the global market with the highest CAGR of 7.2% over the forecast period. In the dairy business, the method of milk permeate getting accepted and used is referred to as the milk permeate segment. Lactose, minerals, and certain proteins are all included in the byproduct of milk processing known as milk permeate. When compared to other dairy components, milk permeate is sometimes thought of as a more affordable ingredient. Its usage enables dairy producers to increase milk use and minimize wastage. The milk permeate market may be driven by this cost advantage.
Throughout the projected period, the animal feed industry segment is expected to grow at a CAGR of 8.4% over the forecast period. Permeate usage in animal feed compositions is referred to as the animal feed industry's permeate section. The byproduct permeate, which is produced by a number of food processing businesses, can be used as an element in animal feed. Permeate includes a range of nutrients, including minerals, amino acids, and vitamins. These elements can add to the nutritional composition of animal feed, giving animals a source of energy and vital nutrients. Permeate is a good element in animal feed compositions due to its nutritional value.
| Attribute | Description |
|---|---|
| Market Size | Revenue (USD Billion) |
| Market size value in 2022 | USD 0.85 Billion |
| Market size value in 2032 | USD 1.5 Billion |
| CAGR (2023 to 2032) | 6.4% |
| Historical data | 2019-2021 |
| Base Year | 2022 |
| Forecast | 2023-2032 |
| Regional Segments | The regions analyzed for the market are Asia Pacific, Europe, South America, North America, and Middle East & Africa. Furthermore, the regions are further analyzed at the country level. |
| Segments | Product, Application, Region |
As per The Brainy Insights, the size of the permeate market was valued at USD 0.85 billion in 2022 to USD 1.5 billion by 2032.
The global permeate market is growing at a CAGR of 6.4% during the forecast period 2023-2032.
The North American region emerged as the largest market for the permeate.
Permeate is well-known for its nutritional value and health advantages will influence the market's growth.
1. Introduction
1.1. Objectives of the Study
1.2. Market Definition
1.3. Research Scope
1.4. Currency
1.5. Key Target Audience
2. Research Methodology and Assumptions
3. Executive Summary
4. Premium Insights
4.1. Porter’s Five Forces Analysis
4.2. Value Chain Analysis
4.3. Top Investment Pockets
4.3.1. Market Attractiveness Analysis by Product
4.3.2. Market Attractiveness Analysis by Application
4.3.3. Market Attractiveness Analysis by Region
4.4. Industry Trends
5. Market Dynamics
5.1. Market Evaluation
5.2. Drivers
5.2.1. Permeate is well-known for its nutritional value and health advantages
5.3. Restraints
5.3.1. Consumers' misconceptions about the flavor or texture of permeate goods
5.4. Opportunities
5.4.1. Increasing need for nutritional products and functional foods
6. Global Permeate Market Analysis and Forecast, By Product
6.1. Segment Overview
6.2. Whey Permeate
6.3. Milk Permeate
7. Global Permeate Market Analysis and Forecast, By Application
7.1. Segment Overview
7.2. Animal Feed Industry
7.3. Food & Beverages Industry
8. Global Permeate Market Analysis and Forecast, By Regional Analysis
8.1. Segment Overview
8.2. North America
8.2.1. U.S.
8.2.2. Canada
8.2.3. Mexico
8.3. Europe
8.3.1. Germany
8.3.2. France
8.3.3. U.K.
8.3.4. Italy
8.3.5. Spain
8.4. Asia-Pacific
8.4.1. Japan
8.4.2. China
8.4.3. India
8.5. South America
8.5.1. Brazil
8.6. Middle East and Africa
8.6.1. UAE
8.6.2. South Africa
9. Global Permeate Market-Competitive Landscape
9.1. Overview
9.2. Market Share of Key Players in the Permeate Market
9.2.1. Global Company Market Share
9.2.2. North America Company Market Share
9.2.3. Europe Company Market Share
9.2.4. APAC Company Market Share
9.3. Competitive Situations and Trends
9.3.1. Product Launches and Developments
9.3.2. Partnerships, Collaborations, and Agreements
9.3.3. Mergers & Acquisitions
9.3.4. Expansions
10. Company Profiles
10.1. Glanbia plc
10.1.1. Business Overview
10.1.2. Company Snapshot
10.1.3. Company Market Share Analysis
10.1.4. Company Product Portfolio
10.1.5. Recent Developments
10.1.6. SWOT Analysis
10.2. Hoogwegt Group
10.2.1. Business Overview
10.2.2. Company Snapshot
10.2.3. Company Market Share Analysis
10.2.4. Company Product Portfolio
10.2.5. Recent Developments
10.2.6. SWOT Analysis
10.3. Idaho Milk Products
10.3.1. Business Overview
10.3.2. Company Snapshot
10.3.3. Company Market Share Analysis
10.3.4. Company Product Portfolio
10.3.5. Recent Developments
10.3.6. SWOT Analysis
10.4. Lactalis Ingredients
10.4.1. Business Overview
10.4.2. Company Snapshot
10.4.3. Company Market Share Analysis
10.4.4. Company Product Portfolio
10.4.5. Recent Developments
10.4.6. SWOT Analysis
10.5. Proliant Dairy Ingredients
10.5.1. Business Overview
10.5.2. Company Snapshot
10.5.3. Company Market Share Analysis
10.5.4. Company Product Portfolio
10.5.5. Recent Developments
10.5.6. SWOT Analysis
10.6. RAWA pharm
10.6.1. Business Overview
10.6.2. Company Snapshot
10.6.3. Company Market Share Analysis
10.6.4. Company Product Portfolio
10.6.5. Recent Developments
10.6.6. SWOT Analysis
10.7. Volac International Limited
10.7.1. Business Overview
10.7.2. Company Snapshot
10.7.3. Company Market Share Analysis
10.7.4. Company Product Portfolio
10.7.5. Recent Developments
10.7.6. SWOT Analysis
10.8. Agropur Ingredients
10.8.1. Business Overview
10.8.2. Company Snapshot
10.8.3. Company Market Share Analysis
10.8.4. Company Product Portfolio
10.8.5. Recent Developments
10.8.6. SWOT Analysis
10.9. Arion Dairy Products B.V.
10.9.1. Business Overview
10.9.2. Company Snapshot
10.9.3. Company Market Share Analysis
10.9.4. Company Product Portfolio
10.9.5. Recent Developments
10.9.6. SWOT Analysis
10.10. Armor Proteines
10.10.1. Business Overview
10.10.2. Company Snapshot
10.10.3. Company Market Share Analysis
10.10.4. Company Product Portfolio
10.10.5. Recent Developments
10.10.6. SWOT Analysis
List of Table
1. Global Permeate Market, By Product, 2019-2032 (USD Billion)
2. Global Whey Permeate, Permeate Market, By Region, 2019-2032 (USD Billion)
3. Global Milk Permeate, Permeate Market, By Region, 2019-2032 (USD Billion)
4. Global Permeate Market, By Application, 2019-2032 (USD Billion)
5. Global Animal Feed Industry, Permeate Market, By Region, 2019-2032 (USD Billion)
6. Global Food & Beverages Industry, Permeate Market, By Region, 2019-2032 (USD Billion)
7. Global Permeate Market, By Region, 2019-2032 (USD Billion)
8. North America Permeate Market, By Product, 2019-2032 (USD Billion)
9. North America Permeate Market, By Application, 2019-2032 (USD Billion)
10. U.S. Permeate Market, By Product, 2019-2032 (USD Billion)
11. U.S. Permeate Market, By Application, 2019-2032 (USD Billion)
12. Canada Permeate Market, By Product, 2019-2032 (USD Billion)
13. Canada Permeate Market, By Application, 2019-2032 (USD Billion)
14. Mexico Permeate Market, By Product, 2019-2032 (USD Billion)
15. Mexico Permeate Market, By Application, 2019-2032 (USD Billion)
16. Europe Permeate Market, By Product, 2019-2032 (USD Billion)
17. Europe Permeate Market, By Application, 2019-2032 (USD Billion)
18. Germany Permeate Market, By Product, 2019-2032 (USD Billion)
19. Germany Permeate Market, By Application, 2019-2032 (USD Billion)
20. France Permeate Market, By Product, 2019-2032 (USD Billion)
21. France Permeate Market, By Application, 2019-2032 (USD Billion)
22. U.K. Permeate Market, By Product, 2019-2032 (USD Billion)
23. U.K. Permeate Market, By Application, 2019-2032 (USD Billion)
24. Italy Permeate Market, By Product, 2019-2032 (USD Billion)
25. Italy Permeate Market, By Application, 2019-2032 (USD Billion)
26. Spain Permeate Market, By Product, 2019-2032 (USD Billion)
27. Spain Permeate Market, By Application, 2019-2032 (USD Billion)
28. Asia Pacific Permeate Market, By Product, 2019-2032 (USD Billion)
29. Asia Pacific Permeate Market, By Application, 2019-2032 (USD Billion)
30. Japan Permeate Market, By Product, 2019-2032 (USD Billion)
31. Japan Permeate Market, By Application, 2019-2032 (USD Billion)
32. China Permeate Market, By Product, 2019-2032 (USD Billion)
33. China Permeate Market, By Application, 2019-2032 (USD Billion)
34. India Permeate Market, By Product, 2019-2032 (USD Billion)
35. India Permeate Market, By Application, 2019-2032 (USD Billion)
36. South America Permeate Market, By Product, 2019-2032 (USD Billion)
37. South America Permeate Market, By Application, 2019-2032 (USD Billion)
38. Brazil Permeate Market, By Product, 2019-2032 (USD Billion)
39. Brazil Permeate Market, By Application, 2019-2032 (USD Billion)
40. Middle East and Africa Permeate Market, By Product, 2019-2032 (USD Billion)
41. Middle East and Africa Permeate Market, By Application, 2019-2032 (USD Billion)
42. UAE Permeate Market, By Product, 2019-2032 (USD Billion)
43. UAE Permeate Market, By Application, 2019-2032 (USD Billion)
44. South Africa Permeate Market, By Product, 2019-2032 (USD Billion)
45. South Africa Permeate Market, By Application, 2019-2032 (USD Billion)
List of Figures
1. Global Permeate Market Segmentation
2. Permeate Market: Research Methodology
3. Market Size Estimation Methodology: Bottom-Up Approach
4. Market Size Estimation Methodology: Top-Down Approach
5. Data Triangulation
6. Porter’s Five Forces Analysis
7. Value Chain Analysis
8. Global Permeate Market Attractiveness Analysis by Product
9. Global Permeate Market Attractiveness Analysis by Application
10. Global Permeate Market Attractiveness Analysis by Region
11. Global Permeate Market: Dynamics
12. Global Permeate Market Share by Product (2022 & 2032)
13. Global Permeate Market Share by Application (2022 & 2032)
14. Global Permeate Market Share by Regions (2022 & 2032)
15. Global Permeate Market Share by Company (2022)
This study forecasts revenue at global, regional, and country levels from 2019 to 2032. The Brainy Insights has segmented the global permeate market based on below-mentioned segments:
Global Permeate Market by Product:
Global Permeate Market by Application:
Global Permeate Market by Region:
Research has its special purpose to undertake marketing efficiently. In this competitive scenario, businesses need information across all industry verticals; the information about customer wants, market demand, competition, industry trends, distribution channels etc. This information needs to be updated regularly because businesses operate in a dynamic environment. Our organization, The Brainy Insights incorporates scientific and systematic research procedures in order to get proper market insights and industry analysis for overall business success. The analysis consists of studying the market from a miniscule level wherein we implement statistical tools which helps us in examining the data with accuracy and precision.
Our research reports feature both; quantitative and qualitative aspects for any market. Qualitative information for any market research process are fundamental because they reveal the customer needs and wants, usage and consumption for any product/service related to a specific industry. This in turn aids the marketers/investors in knowing certain perceptions of the customers. Qualitative research can enlighten about the different product concepts and designs along with unique service offering that in turn, helps define marketing problems and generate opportunities. On the other hand, quantitative research engages with the data collection process through interviews, e-mail interactions, surveys and pilot studies. Quantitative aspects for the market research are useful to validate the hypotheses generated during qualitative research method, explore empirical patterns in the data with the help of statistical tools, and finally make the market estimations.
The Brainy Insights offers comprehensive research and analysis, based on a wide assortment of factual insights gained through interviews with CXOs and global experts and secondary data from reliable sources. Our analysts and industry specialist assume vital roles in building up statistical tools and analysis models, which are used to analyse the data and arrive at accurate insights with exceedingly informative research discoveries. The data provided by our organization have proven precious to a diverse range of companies, facilitating them to address issues such as determining which products/services are the most appealing, whether or not customers use the product in the manner anticipated, the purchasing intentions of the market and many others.
Our research methodology encompasses an idyllic combination of primary and secondary initiatives. Key phases involved in this process are listed below:

The phase involves the gathering and collecting of market data and its related information with the help of different sources & research procedures.

The data procurement stage involves in data gathering and collecting through various data sources.
This stage involves in extensive research. These data sources includes:
Purchased Database: Purchased databases play a crucial role in estimating the market sizes irrespective of the domain. Our purchased database includes:
Primary Research: The Brainy Insights interacts with leading companies and experts of the concerned domain to develop the analyst team’s market understanding and expertise. It improves and substantiates every single data presented in the market reports. Primary research mainly involves in telephonic interviews, E-mail interactions and face-to-face interviews with the raw material providers, manufacturers/producers, distributors, & independent consultants. The interviews that we conduct provides valuable data on market size and industry growth trends prevailing in the market. Our organization also conducts surveys with the various industry experts in order to gain overall insights of the industry/market. For instance, in healthcare industry we conduct surveys with the pharmacists, doctors, surgeons and nurses in order to gain insights and key information of a medical product/device/equipment which the customers are going to usage. Surveys are conducted in the form of questionnaire designed by our own analyst team. Surveys plays an important role in primary research because surveys helps us to identify the key target audiences of the market. Additionally, surveys helps to identify the key target audience engaged with the market. Our survey team conducts the survey by targeting the key audience, thus gaining insights from them. Based on the perspectives of the customers, this information is utilized to formulate market strategies. Moreover, market surveys helps us to understand the current competitive situation of the industry. To be precise, our survey process typically involve with the 360 analysis of the market. This analytical process begins by identifying the prospective customers for a product or service related to the market/industry to obtain data on how a product/service could fit into customers’ lives.

Secondary Research: The secondary data sources includes information published by the on-profit organizations such as World bank, WHO, company fillings, investor presentations, annual reports, national government documents, statistical databases, blogs, articles, white papers and others. From the annual report, we analyse a company’s revenue to understand the key segment and market share of that organization in a particular region. We analyse the company websites and adopt the product mapping technique which is important for deriving the segment revenue. In the product mapping method, we select and categorize the products offered by the companies catering to domain specific market, deduce the product revenue for each of the companies so as to get overall estimation of the market size. We also source data and analyses trends based on information received from supply side and demand side intermediaries in the value chain. The supply side denotes the data gathered from supplier, distributor, wholesaler and the demand side illustrates the data gathered from the end customers for respective market domain.

The supply side for a domain specific market is analysed by:
The demand side for the market is estimated through:
In-house Library: Apart from these third-party sources, we have our in-house library of qualitative and quantitative information. Our in-house database includes market data for various industry and domains. These data are updated on regular basis as per the changing market scenario. Our library includes, historic databases, internal audit reports and archives.
Sometimes there are instances where there is no metadata or raw data available for any domain specific market. For those cases, we use our expertise to forecast and estimate the market size in order to generate comprehensive data sets. Our analyst team adopt a robust research technique in order to produce the estimates:
Data Synthesis: This stage involves the analysis & mapping of all the information obtained from the previous step. It also involves in scrutinizing the data for any discrepancy observed while data gathering related to the market. The data is collected with consideration to the heterogeneity of sources. Robust scientific techniques are in place for synthesizing disparate data sets and provide the essential contextual information that can orient market strategies. The Brainy Insights has extensive experience in data synthesis where the data passes through various stages:


Market Deduction & Formulation: The final stage comprises of assigning data points at appropriate market spaces so as to deduce feasible conclusions. Analyst perspective & subject matter expert based holistic form of market sizing coupled with industry analysis also plays a crucial role in this stage.
This stage involves in finalization of the market size and numbers that we have collected from data integration step. With data interpolation, it is made sure that there is no gap in the market data. Successful trend analysis is done by our analysts using extrapolation techniques, which provide the best possible forecasts for the market.
Data Validation & Market Feedback: Validation is the most important step in the process. Validation & re-validation via an intricately designed process helps us finalize data-points to be used for final calculations.

The Brainy Insights interacts with leading companies and experts of the concerned domain to develop the analyst team’s market understanding and expertise. It improves and substantiates every single data presented in the market reports. The data validation interview and discussion panels are typically composed of the most experienced industry members. The participants include, however, are not limited to:
Moreover, we always validate our data and findings through primary respondents from all the major regions we are working on.


Free Customization
Fortune 500 Clients
Free Yearly Update On Purchase Of Multi/Corporate License
Companies Served Till Date