- +1-315-215-1633
- sales@thebrainyinsights.com

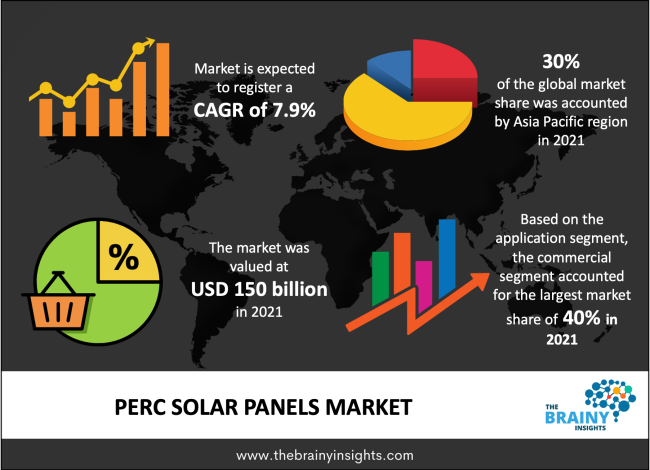
The PERC Solar Panels market was estimated at around 150 billion in 2021, growing at a CAGR of nearly 7.9% during 2022-2030. The market is projected to reach approximately USD 290 billion by 2030.
Globally, there has been an increase in demand for renewable energy sources since they minimize carbon emissions. Solar panel prices have gradually decreased because of consistent research into photovoltaic (PV) cells. Additionally, it has increased efficiency. This has increased solar energy installation and investment. Mono PERC solar panels have been created because of an increase in photovoltaic cell-related research and development. Combining monocrystalline cells with a passivated emitter and rear cell creates a mono PERC. Mono PERC solar panels are more adaptable because they offer end users a variety of positioning and tilt options without sacrificing efficiency. Solar panels made with mono PERC have an energy efficiency that is up to 22% higher than conventional solar cells. They also offer exceptional low light performance. To prevent the COVID-19 epidemic from spreading, the governments of some nations have enacted statewide lockdowns. Plans for renewable energy projects all over the world have been hampered by this. Project delays have been caused by the pandemic's disruption of the market's availability of trained workers, necessary equipment, and raw supplies. Therefore, the COVID-19 epidemic has had a negative impact on the market for mono PERC solar panels.
Get an overview of this study by requesting a free sample
Following the COVID-19 virus outbreak in December 2019, the World Health Organization (WHO) declared the coronavirus illness 2019 to be a pandemic. Since then, the epidemic has expanded to almost every country in the world. Every industry has been impacted by the COVID-19 pandemic, including those in the following sectors: aerospace & defence, banking, financial services & insurance, ICT, agriculture, food & beverage, automotive & transportation, chemical & material, consumer goods, retail & eCommerce, energy & power, pharmaceutical & healthcare, packaging.
The population has become progressively confined to their houses and has cut back on their travel, which has a negative or good effect on the market. It also evaluates the implications of the COVID-19 pandemic on the global market considering the current market condition, providing more accurate and dependable estimates. The entire world is suffering due to the coronavirus outbreak. Almost all nations have implemented strong social segregation policies, including lockdowns. Supply chains have been disrupted as a result. The epidemic has altered global social structures.
Increasing environmental awareness
The environmental consciousness linked to the depletion of non-renewable resources and the production of pollutants from such sources is what is fueling the expansion of the solar PV business. The reasons driving the growth of the solar PV panel market around the world are the rapid generation of energy from renewable sources and the move from conventional to renewable, connected with environmental friendliness. The government's supporting policies and a number of ongoing projects are anticipated to fuel market expansion during the projected period. By 2030, it is anticipated that solar PV panels, which have already been installed, would dominate the electrical grid.
The industry transition to solar PV panels is the result of the government introducing numerous preventive measures against the lowered GHG emission and non-renewable resource depletion. The worldwide solar PV industry may benefit financially from the growing investments in the production of renewable energy sources.
The market is divided into Monocrystalline and Polycrystalline segments based on Type. A growth in R&D projects is fueling the market for mono PERC solar panels. A back cell plus a single-crystal cell with a passivated emitter make up a mono PERC. Mono PERC solar panels offer greater flexibility since they permit end users to select from a variety of position and tilt options without compromising efficiency. Efficiency-wise, mono PERC solar panels can outperform conventional solar cells. Additionally, they perform well in dimly lit environments. During the forecast period, the residential category is anticipated to increase at the fastest rate. Commercial solar panels can power industrial facilities in off-grid or remote regions, pre-heat ventilation air, and heat water in offices, enterprises, and other structures. They have a lifespan of 14 to 20 years. Along with an increase in power demand in communication base stations and data centres, the quick adoption of PV modules in corporate offices, hotels, and hospitals is anticipated to stimulate product demand throughout the commercial sector.
North America is currently the most significant market. It has tremendous dominance over the PERC solar panel market globally. The region has made investments in numerous renewable energy sources and is well-developed. Due to large investments in the region's renewable energy sector, Europe also contributed significantly to the global market for mono PERC solar panels. Solar energy is being used to generate electricity in countries in the region to satisfy the European Union's renewable energy goal. The plant wants to become carbon neutral by 2030 by reducing its use of fossil fuels and switching to green energy. The Asia-Pacific area will hold a significant share of the global market for PERC solar panels because of regional globalization and urbanization. Prior to China, India, and Japan's brisk economic growth, investments in the renewable energy sector soared.
The global PERC Solar Panels market is segmented as follows:
By Type
By Application
By Region/Geography
| Attribute | Description |
|---|---|
| Base Year | 2021 |
| Forecast period | 2022-2030 |
| Report Coverage | Revenue estimation and forecast, company profile, competitive landscape, growth factors, and recent trends |
| Regional scope | North America, Europe, Asia Pacific, Middle East & Africa, and Latin America |
| Market Size(unit) | USD Billion |
| CAGR (2022 to 2030) | 7.9% |
| Segments Covered |
By Type |
1. Introduction
1.1. Objectives of the Study
1.2. Market Definition
1.3. Research Scope
2. Research Methodology and Assumptions
3. Executive Summary
4. Premium Insights
4.1. Porter’s Five Forces Analysis
4.2. Value Chain Analysis
4.3. Top Investment Pockets
4.3.1. Market Attractiveness Analysis By Type
4.3.2. Market Attractiveness Analysis By Application
4.4. Industry Trends
5. Market Dynamics
5.1. Market Evaluation
5.2. Drivers
5.2.1. Increasing share of solar energy sources in the global energy mix
5.2.2. Rising environmental awareness
5.3. Restraints
5.3.1. High initial investments would hamper the market
5.4. Opportunities
5.4.1. Small and medium enterprises (SMEs) switching to solar energy
6. Global PERC Solar Panels Market Analysis and Forecast, By Type
6.1. Segment Overview
6.2. Monocrystalline
6.3. Polycrystalline
7. Global PERC Solar Panels Market Analysis and Forecast, By Application
7.1. Segment Overview
7.2. Residential
7.3. Commercial
7.4. Industrial
8. Global PERC Solar Panels Market Analysis and Forecast, By Regional Analysis
8.1. Segment Overview
8.2. North America
8.2.1. U.S.
8.2.2. Canada
8.2.3. Mexico
8.3. Europe
8.3.1. Germany
8.3.2. France
8.3.3. U.K.
8.3.4. Italy
8.3.5. Spain
8.3.6. Rest of Europe
8.4. Asia-Pacific
8.4.1. Japan
8.4.2. China
8.4.3. India
8.4.4. Australia
8.4.5. South Korea
8.4.6. Rest of Asia-Pacific
8.5. South America
8.5.1. Brazil
8.5.2. Argentina
8.5.3. Rest of South America
8.6. Middle East and Africa
8.6.1. UAE
8.6.2. South Africa
8.6.3. Egypt
8.6.4. Kuwait
8.6.5. Saudi Arabia
8.6.6. Rest of Middle East & Africa
9. Global PERC Solar Panels Market-Competitive Landscape
9.1. Overview
9.2. Market Share of Key Players in the PERC Solar Panels market
9.2.1. Global Company Market Share
9.2.2. North America Company Market Share
9.2.3. Europe Company Market Share
9.2.4. APAC Company Market Share
9.3. Competitive Situations and Trends
9.3.1. Type Launches and Developments
9.3.2. Partnerships, Collaborations, and Agreements
9.3.3. Mergers & Acquisitions
9.3.4. Expansions
10. Company Profiles
10.1. Adani Group
10.1.1. Business Overview
10.1.2. Company Snapshot
10.1.3. Company Market Share Analysis
10.1.4. Company Application Portfolio
10.1.5. Recent Developments
10.1.6. SWOT Analysis
10.2. Solar Solutions Gmbh
10.2.1. Business Overview
10.2.2. Company Snapshot
10.2.3. Company Market Share Analysis
10.2.4. Company Application Portfolio
10.2.5. Recent Developments
10.2.6. SWOT Analysis
10.3. ALPHA SOLAR PLANET GMBH
10.3.1. Business Overview
10.3.2. Company Snapshot
10.3.3. Company Market Share Analysis
10.3.4. Company Application Portfolio
10.3.5. Recent Developments
10.3.6. SWOT Analysis
10.4. Shenzhen Ahony Power Co.,Ltd.
10.4.1. Business Overview
10.4.2. Company Snapshot
10.4.3. Company Market Share Analysis
10.4.4. Company Application Portfolio
10.4.5. Recent Developments
10.4.6. SWOT Analysis
10.5. Alfa
10.5.1. Business Overview
10.5.2. Company Snapshot
10.5.3. Company Market Share Analysis
10.5.4. Company Application Portfolio
10.5.5. Recent Developments
10.5.6. SWOT Analysis
10.6. Beyond Solar
10.6.1. Business Overview
10.6.2. Company Snapshot
10.6.3. Company Market Share Analysis
10.6.4. Company Application Portfolio
10.6.5. Recent Developments
10.6.6. SWOT Analysis
10.7. Evolve Energy Group
10.7.1. Business Overview
10.7.2. Company Snapshot
10.7.3. Company Market Share Analysis
10.7.4. Company Application Portfolio
10.7.5. Recent Developments
10.7.6. SWOT Analysis
10.8. Trina Solar
10.8.1. Business Overview
10.8.2. Company Snapshot
10.8.3. Company Market Share Analysis
10.8.4. Company Application Portfolio
10.8.5. Recent Developments
10.8.6. SWOT Analysis
10.9. Amerisolar
10.9.1. Business Overview
10.9.2. Company Snapshot
10.9.3. Company Market Share Analysis
10.9.4. Company Application Portfolio
10.9.5. Recent Developments
10.9.6. SWOT Analysis
10.10. BAUER Energiekonzepte GmbH
10.10.1. Business Overview
10.10.2. Company Snapshot
10.10.3. Company Market Share Analysis
10.10.4. Company Application Portfolio
10.10.5. Recent Developments
10.10.6. SWOT Analysis
List of Table
1. Global PERC Solar Panels Market, By Type, 2022-2030(USD Billion)
2. Global Monocrystalline PERC Solar Panels Market, By Region, 2022-2030(USD Billion)
3. Global Polycrystalline PERC Solar Panels Market, By Region, 2022-2030(USD Billion)
4. Global PERC Solar Panels Market, By Application, 2022-2030(USD Billion)
5. Global Commercial PERC Solar Panels Market, By Region, 2022-2030(USD Billion)
6. Global Residential PERC Solar Panels Market, By Region, 2022-2030(USD Billion)
7. Global Industrial PERC Solar Panels Market, By Region, 2022-2030(USD Billion)
8. Global PERC Solar Panels Market, By Region, 2022-2030(USD Billion)
9. Global PERC Solar Panels Market, By North America, 2022-2030(USD Billion)
10. North America PERC Solar Panels Market, By Type, 2022-2030(USD Billion)
11. North America PERC Solar Panels Market, By Application, 2022-2030(USD Billion)
12. U.S. PERC Solar Panels Market, By Type, 2022-2030(USD Billion)
13. U.S. PERC Solar Panels Market, By Application, 2022-2030(USD Billion)
14. Canada PERC Solar Panels Market, By Type, 2022-2030(USD Billion)
15. Canada PERC Solar Panels Market, By Application, 2022-2030(USD Billion)
16. Mexico PERC Solar Panels Market, By Type, 2022-2030(USD Billion)
17. Mexico PERC Solar Panels Market, By Application, 2022-2030(USD Billion)
18. Europe PERC Solar Panels Market, By Type, 2022-2030(USD Billion)
19. Europe PERC Solar Panels Market, By Application, 2022-2030(USD Billion)
20. Germany PERC Solar Panels Market, By Type, 2022-2030(USD Billion)
21. Germany PERC Solar Panels Market, By Application, 2022-2030(USD Billion)
22. France PERC Solar Panels Market, By Type, 2022-2030(USD Billion)
23. France PERC Solar Panels Market, By Application, 2022-2030(USD Billion)
24. U.K. PERC Solar Panels Market, By Type, 2022-2030(USD Billion)
25. U.K. PERC Solar Panels Market, By Application, 2022-2030(USD Billion)
26. Italy PERC Solar Panels Market, By Type, 2022-2030(USD Billion)
27. Italy PERC Solar Panels Market, By Application, 2022-2030(USD Billion)
28. Spain PERC Solar Panels Market, By Type, 2022-2030(USD Billion)
29. Spain PERC Solar Panels Market, By Application, 2022-2030(USD Billion)
30. Rest of Europe PERC Solar Panels Market, By Type, 2022-2030(USD Billion)
31. Rest of Europe PERC Solar Panels Market, By Application, 2022-2030(USD Billion)
32. Asia Pacific PERC Solar Panels Market, By Type, 2022-2030(USD Billion)
33. Asia Pacific PERC Solar Panels Market, By Application, 2022-2030(USD Billion)
34. Japan PERC Solar Panels Market, By Type, 2022-2030(USD Billion)
35. Japan PERC Solar Panels Market, By Application, 2022-2030(USD Billion)
36. China PERC Solar Panels Market, By Type, 2022-2030(USD Billion)
37. China PERC Solar Panels Market, By Application, 2022-2030(USD Billion)
38. India PERC Solar Panels Market, By Type, 2022-2030(USD Billion)
39. India PERC Solar Panels Market, By Application, 2022-2030(USD Billion)
40. Australia PERC Solar Panels Market, By Type, 2022-2030(USD Billion)
41. Australia PERC Solar Panels Market, By Application, 2022-2030(USD Billion)
42. South Korea PERC Solar Panels Market, By Type, 2022-2030(USD Billion)
43. South Korea PERC Solar Panels Market, By Application, 2022-2030(USD Billion)
44. Rest of Asia-Pacific PERC Solar Panels Market, By Type, 2022-2030(USD Billion)
45. Rest of Asia-Pacific PERC Solar Panels Market, By Application, 2022-2030(USD Billion)
46. South America PERC Solar Panels Market, By Type, 2022-2030(USD Billion)
47. South America PERC Solar Panels Market, By Application, 2022-2030(USD Billion)
48. Brazil PERC Solar Panels Market, By Type, 2022-2030(USD Billion)
49. Brazil PERC Solar Panels Market, By Application, 2022-2030(USD Billion)
50. Argentina PERC Solar Panels Market, By Type, 2022-2030(USD Billion)
51. Argentina PERC Solar Panels Market, By Application, 2022-2030(USD Billion)
52. Rest of Latin America PERC Solar Panels Market, By Type, 2022-2030(USD Billion)
53. Rest of Latin America PERC Solar Panels Market, By Application, 2022-2030(USD Billion)
54. Middle East and Africa PERC Solar Panels Market, By Type, 2022-2030(USD Billion)
55. Middle East and Africa PERC Solar Panels Market, By Application, 2022-2030(USD Billion)
56. UAE PERC Solar Panels Market, By Type, 2022-2030(USD Billion)
57. UAE PERC Solar Panels Market, By Application, 2022-2030(USD Billion)
58. South Africa PERC Solar Panels Market, By Type, 2022-2030(USD Billion)
59. South Africa PERC Solar Panels Market, By Application, 2022-2030(USD Billion)
60. Egypt PERC Solar Panels Market, By Type, 2022-2030(USD Billion)
61. Egypt PERC Solar Panels Market, By Application, 2022-2030(USD Billion)
62. Kuwait PERC Solar Panels Market, By Type, 2022-2030(USD Billion)
63. Kuwait PERC Solar Panels Market, By Application, 2022-2030(USD Billion)
64. Saudi Arabia PERC Solar Panels Market, By Type, 2022-2030(USD Billion)
65. Saudi Arabia PERC Solar Panels Market, By Application, 2022-2030(USD Billion)
66. Rest of Middle East PERC Solar Panels Market, By Type, 2022-2030(USD Billion)
67. Rest of Middle East PERC Solar Panels Market, By Application, 2022-2030(USD Billion)
List of Figures
1. Global PERC Solar Panels Market Segmentation
2. PERC Solar Panels Market: Research Methodology
3. Market Size Estimation Methodology: Bottom-Up Approach
4. Market Size Estimation Methodology: Top-Down Approach
5. Data Triangulation
6. Porter’s Five Forces Analysis
7. Value Chain Analysis
8. Global PERC Solar Panels Market Attractiveness Analysis By Type
9. Global PERC Solar Panels Market Attractiveness Analysis By Application
10. Global PERC Solar Panels Market Attractiveness Analysis By Region
11. Global PERC Solar Panels Market: Dynamics
12. Global PERC Solar Panels Market Share By Type(2022 & 2030)
13. Global PERC Solar Panels Market Share By Application(2022 & 2030)
14. Global PERC Solar Panels Market Share by Regions (2022 & 2030)
15. Global PERC Solar Panels Market Share by Company (2021)
By Type
By Application
By Region/Geography
Research has its special purpose to undertake marketing efficiently. In this competitive scenario, businesses need information across all industry verticals; the information about customer wants, market demand, competition, industry trends, distribution channels etc. This information needs to be updated regularly because businesses operate in a dynamic environment. Our organization, The Brainy Insights incorporates scientific and systematic research procedures in order to get proper market insights and industry analysis for overall business success. The analysis consists of studying the market from a miniscule level wherein we implement statistical tools which helps us in examining the data with accuracy and precision.
Our research reports feature both; quantitative and qualitative aspects for any market. Qualitative information for any market research process are fundamental because they reveal the customer needs and wants, usage and consumption for any product/service related to a specific industry. This in turn aids the marketers/investors in knowing certain perceptions of the customers. Qualitative research can enlighten about the different product concepts and designs along with unique service offering that in turn, helps define marketing problems and generate opportunities. On the other hand, quantitative research engages with the data collection process through interviews, e-mail interactions, surveys and pilot studies. Quantitative aspects for the market research are useful to validate the hypotheses generated during qualitative research method, explore empirical patterns in the data with the help of statistical tools, and finally make the market estimations.
The Brainy Insights offers comprehensive research and analysis, based on a wide assortment of factual insights gained through interviews with CXOs and global experts and secondary data from reliable sources. Our analysts and industry specialist assume vital roles in building up statistical tools and analysis models, which are used to analyse the data and arrive at accurate insights with exceedingly informative research discoveries. The data provided by our organization have proven precious to a diverse range of companies, facilitating them to address issues such as determining which products/services are the most appealing, whether or not customers use the product in the manner anticipated, the purchasing intentions of the market and many others.
Our research methodology encompasses an idyllic combination of primary and secondary initiatives. Key phases involved in this process are listed below:

The phase involves the gathering and collecting of market data and its related information with the help of different sources & research procedures.

The data procurement stage involves in data gathering and collecting through various data sources.
This stage involves in extensive research. These data sources includes:
Purchased Database: Purchased databases play a crucial role in estimating the market sizes irrespective of the domain. Our purchased database includes:
Primary Research: The Brainy Insights interacts with leading companies and experts of the concerned domain to develop the analyst team’s market understanding and expertise. It improves and substantiates every single data presented in the market reports. Primary research mainly involves in telephonic interviews, E-mail interactions and face-to-face interviews with the raw material providers, manufacturers/producers, distributors, & independent consultants. The interviews that we conduct provides valuable data on market size and industry growth trends prevailing in the market. Our organization also conducts surveys with the various industry experts in order to gain overall insights of the industry/market. For instance, in healthcare industry we conduct surveys with the pharmacists, doctors, surgeons and nurses in order to gain insights and key information of a medical product/device/equipment which the customers are going to usage. Surveys are conducted in the form of questionnaire designed by our own analyst team. Surveys plays an important role in primary research because surveys helps us to identify the key target audiences of the market. Additionally, surveys helps to identify the key target audience engaged with the market. Our survey team conducts the survey by targeting the key audience, thus gaining insights from them. Based on the perspectives of the customers, this information is utilized to formulate market strategies. Moreover, market surveys helps us to understand the current competitive situation of the industry. To be precise, our survey process typically involve with the 360 analysis of the market. This analytical process begins by identifying the prospective customers for a product or service related to the market/industry to obtain data on how a product/service could fit into customers’ lives.

Secondary Research: The secondary data sources includes information published by the on-profit organizations such as World bank, WHO, company fillings, investor presentations, annual reports, national government documents, statistical databases, blogs, articles, white papers and others. From the annual report, we analyse a company’s revenue to understand the key segment and market share of that organization in a particular region. We analyse the company websites and adopt the product mapping technique which is important for deriving the segment revenue. In the product mapping method, we select and categorize the products offered by the companies catering to domain specific market, deduce the product revenue for each of the companies so as to get overall estimation of the market size. We also source data and analyses trends based on information received from supply side and demand side intermediaries in the value chain. The supply side denotes the data gathered from supplier, distributor, wholesaler and the demand side illustrates the data gathered from the end customers for respective market domain.

The supply side for a domain specific market is analysed by:
The demand side for the market is estimated through:
In-house Library: Apart from these third-party sources, we have our in-house library of qualitative and quantitative information. Our in-house database includes market data for various industry and domains. These data are updated on regular basis as per the changing market scenario. Our library includes, historic databases, internal audit reports and archives.
Sometimes there are instances where there is no metadata or raw data available for any domain specific market. For those cases, we use our expertise to forecast and estimate the market size in order to generate comprehensive data sets. Our analyst team adopt a robust research technique in order to produce the estimates:
Data Synthesis: This stage involves the analysis & mapping of all the information obtained from the previous step. It also involves in scrutinizing the data for any discrepancy observed while data gathering related to the market. The data is collected with consideration to the heterogeneity of sources. Robust scientific techniques are in place for synthesizing disparate data sets and provide the essential contextual information that can orient market strategies. The Brainy Insights has extensive experience in data synthesis where the data passes through various stages:


Market Deduction & Formulation: The final stage comprises of assigning data points at appropriate market spaces so as to deduce feasible conclusions. Analyst perspective & subject matter expert based holistic form of market sizing coupled with industry analysis also plays a crucial role in this stage.
This stage involves in finalization of the market size and numbers that we have collected from data integration step. With data interpolation, it is made sure that there is no gap in the market data. Successful trend analysis is done by our analysts using extrapolation techniques, which provide the best possible forecasts for the market.
Data Validation & Market Feedback: Validation is the most important step in the process. Validation & re-validation via an intricately designed process helps us finalize data-points to be used for final calculations.

The Brainy Insights interacts with leading companies and experts of the concerned domain to develop the analyst team’s market understanding and expertise. It improves and substantiates every single data presented in the market reports. The data validation interview and discussion panels are typically composed of the most experienced industry members. The participants include, however, are not limited to:
Moreover, we always validate our data and findings through primary respondents from all the major regions we are working on.


Free Customization
Fortune 500 Clients
Free Yearly Update On Purchase Of Multi/Corporate License
Companies Served Till Date