- +1-315-215-1633
- sales@thebrainyinsights.com

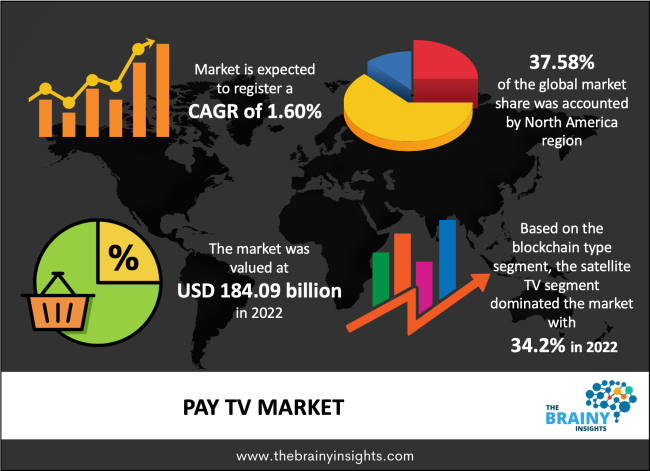
The global pay tv market was valued at USD 184.09 billion in 2022 and growing at a CAGR of 1.60% from 2022 to 2030. The market is expected to reach USD 209.01 billion by 2030. The rising demand among customers to provide premium quality content and HD picture resolution present favorable growth prospects to the pay tv market. The immediate growth factor of the market is the capability to access premium quality content from other service providers on a single platform at reasonable prices. Additionally, pay TV service providers to give different value-added services like lower subscription rates, personalized channel subscriptions, which include packages according to the customer's choice, and fast internet connectivity, which offers profit generation opportunities to service providers. Service providers have begun adopting integrated broadband broadcasting systems (IBB) to divide their service offerings and promote better market penetration.
Pay television (TV) is a customer subscription-based TV broadcasting service. It is a subscription or premium television service mainly operated via cable satellite or internet protocol (IP) TV. Pay TV is a television broadcasting system in which individuals pay to watch specific programs or channels and the user subscribes to a bunch of content provided by the services providers of Pay Tv. Pay TV technology has grown extensively in the past few years, connected with the transforming customer behaviors and the presence of digital alternatives that have appeared to meet customer requirements. For example, along with the television channels, Pay TV now gives other interactive benefits, like video-on-demand, TV shopping, multi-room charging, and gaming. Pay TV and Over-the-top (OTT) are the business models that permit customers to subscribe to television content. Pay TV, which is usually more costly, generally has a bunch of content and needs the user to have a satellite dish network set-top box or rent a proprietary coaxial cable. In disparity, Over-the-top content is delivered via a proprietary content delivery network (CDN) over the public internet. Unlike over-the-air (OTA) TV signals, it can be used freely by an antenna; Pay TV signals are encoded to control the theft of services. Individually proprietary set-top box given by a cable or satellite company includes a tuner that can accept the provider’s encrypted digital television (DTV) signals and decode them into a form the television comprehends. Firmware in the set-top box defines what signals the client can translate by validating which entitlements have been given through the consumer’s subscription.
Get an overview of this study by requesting a free sample
December 2021: In a bid to promote its broadband and pay-tv services, Italy's biggest telecoms group earlier this year sealed a partnership with DAZN, which holds the rights to screen Serie A soccer matches over the three seasons to 2024.
Advancement in 4K and Ultra HD (UHD) picture quality- The rising need among customers to support enhanced quality content with high picture resolution mainly pushes the growth of the pay TV market. There is an increase in demand among the customers to undergo high-quality viewing experiences like Ultra HD (UHD) and 4K picture quality. For example, the market players have realized the significance of Ultra High Definition (UHD) TV benefits, allowing them to present improved picture quality.
OTT Is Getting More Popularity Over PayTV- The constant video streaming trend due to advancements in internet speeds worldwide has driven the growth of the over-the-top or OTT industry. For example, in November 2019, Netflix had 141 million subscribers, which is rising by around 7.8 million a quarter. This negatively affects the pay TV market; for example, Nagra's PayTV Innovation Forum study in 2019 says that over 25% of supervisors in the industry surveyed now acknowledge that the growth of over-the-top services will break the payTV industry over the coming years.
Technological Advancement- With the rise of Internet technology, the television industry has been researching new ways to make television viewing more satisfying and thrilling. Firms that provide television services have recognized that today’s consumers want the liberty to choose when and where to watch their favorite shows or movies without paying any extra cost. The opportunity to get affordable entry to high-quality content from various service providers on a single platform. Integrating Integrated Broadband Broadcasting (IBB) and the increasing need for pay-TV services are acquiring popularity among service providers. Broadband and broadcast technology has made personalized service and mass content more accessible. Similarly, the rising popularity of smart TVs has raised industry development.
The lack of new content- The lack of new content is expected to challenge the development of the global pay TV market in the future. Customers actively look for new content and wish to watch TV on a laptop. Additionally, they want various experiences on each platform, such as laptops, smartphones, TV, and different kinds of content on their timetables. The factor challenges the market growth as the viewers' need increases, and they are unhappy with traditional broadcasting.
The regions analyzed for the market include North America, Europe, South America, Asia Pacific, the Middle East, and Africa. North America emerged as the largest market for the global Pay Tv market, with a 37.58% share of the market revenue in 2022.
North America dominated with a revenue share in 2022. Despite higher revenue share, the regional market is noticing a drop due to the fast penetration of internet-enabled mediums and the beginning of (Over-the-top platforms) OTT. The substantial growth in stopping a cable or satellite television service is insisting service providers shift their service offerings to online content delivery to grab a more increased market number of subscribers. Similarly, the usage of advanced technologies like Machine Learning (ML)and Artificial Intelligence (AI) in the region to assess users’ watching trends and make personalized offers facilitates more people to shift to OTT platforms.
North America Region Pay TV Market Share in 2022 - 37.58%
www.thebrainyinsights.com
Check the geographical analysis of this market by requesting a free sample
The blockchain type segment is divided into Satellite TV, Cable TV, and IPTV. The satellite TV segment dominated the market, with a market share of around 34.2% in 2022. The growing passion for more networks, additional features, and innovative channels encourage service providers to extend their service offerings. The recent trend of watching live programming broadcasts, like news and sporting events, resumes pushing satellite TV usage. Satellite TV service providers can offer these services without bandwidth limitations and increasing consumer need for high-quality watching experiences is driving the segment’s growth.
The application segment is divided into commercial and residential. The residential segment dominated the market, with a market share of around 55.2% in 2022. The residential segment accounted for the largest market share of the international Pay TV market. The main element for the substantial growth rate is the execution of partial or total lockdown in numerous countries worldwide.
| Attribute | Description |
|---|---|
| Market Size | Revenue (USD Billion) |
| Market size value in 2030 | USD 209.01 Billion |
| CAGR (2022 to 2030) | 1.60% |
| Historical data | 2019-2020 |
| Base Year | 2021 |
| Forecast | 2022-2030 |
| Segments | Blockchain Type, Application |
| Regional Segments | The regions analyzed for the market are South America, Middle East & Africa Asia Pacific, Europe, and North America. Furthermore, the regions are further analyzed at the country level. |
North America region emerged as the largest market for the Pay TV market.
Advancement in 4K and Ultra HD (UHD) picture quality to propel market growth.
OTT Is Getting More Popularity Over Pay TV which can hinder market growth.
Technological advancement will provide huge opportunities to the market.
1. Introduction
1.1. Objectives of the Study
1.2. Market Definition
1.3. Research Scope
1.4. Currency
1.5. Key Target Audience
2. Research Methodology and Assumptions
3. Executive Summary
4. Premium Insights
4.1. Porter’s Five Forces Analysis
4.2. Value Chain Analysis
4.3. Top Investment Pockets
4.3.1. Market Attractiveness Analysis by Blockchain Type
4.3.2. Market Attractiveness Analysis by Application
4.3.3. Market Attractiveness Analysis by Region
4.4. Industry Trends
5. Market Dynamics
5.1. Market Evaluation
5.2. Drivers
5.2.1. Advancement in 4K and Ultra HD (UHD) picture quality
5.3. Restraints
5.3.1. OTT is getting more popularity over PayTV
5.4. Opportunities
5.4.1. Technological Advancement
5.5. Challenges
5.5.1. The lack of new content-
6. Global PayTV Market Analysis and Forecast, By Blockchain Type:
6.1. Segment Overview
6.2. Satellite TV
6.3. Cable TV
6.4. IPTV
7. Global PayTV Market Analysis and Forecast, By Application
7.1. Segment Overview
7.2. Commercial
7.3. Residential
8. Global PayTV Market Analysis and Forecast, By Regional Analysis
8.1. Segment Overview
8.2. North America
8.2.1. U.S.
8.2.2. Canada
8.2.3. Mexico
8.3. Europe
8.3.1. Germany
8.3.2. France
8.3.3. U.K.
8.3.4. Italy
8.3.5. Spain
8.4. Asia-Pacific
8.4.1. Japan
8.4.2. China
8.4.3. India
8.5. South America
8.5.1. Brazil
8.6. Middle East and Africa
8.6.1. UAE
8.6.2. South Africa
9. Global PayTV Market-Competitive Landscape
9.1. Overview
9.2. Market Share of Key Players in the PayTV Market
9.2.1. Global Company Market Share
9.2.2. North America Company Market Share
9.2.3. Europe Company Market Share
9.2.4. APAC Company Market Share
9.3. Competitive Situations and Trends
9.3.1. Product Launches and Developments
9.3.2. Partnerships, Collaborations, and Agreements
9.3.3. Mergers & Acquisitions
9.3.4. Expansions
10. Company Profiles
10.1. Airtel Digital TV.
10.1.1. Business Overview
10.1.2. Company Snapshot
10.1.3. Company Market Share Analysis
10.1.4. Company Product Portfolio
10.1.5. Recent Developments
10.1.6. SWOT Analysis
10.2. Comcast corporation
10.2.1. Business Overview
10.2.2. Company Snapshot
10.2.3. Company Market Share Analysis
10.2.4. Company Product Portfolio
10.2.5. Recent Developments
10.2.6. SWOT Analysis
10.3. DirecTV
10.3.1. Business Overview
10.3.2. Company Snapshot
10.3.3. Company Market Share Analysis
10.3.4. Company Product Portfolio
10.3.5. Recent Developments
10.3.6. SWOT Analysis
10.4. DISH Network Corporation
10.4.1. Business Overview
10.4.2. Company Snapshot
10.4.3. Company Market Share Analysis
10.4.4. Company Product Portfolio
10.4.5. Recent Developments
10.4.6. SWOT Analysis
10.5. Dish TV India Limited.
10.5.1. Business Overview
10.5.2. Company Snapshot
10.5.3. Company Market Share Analysis
10.5.4. Company Product Portfolio
10.5.5. Recent Developments
10.5.6. SWOT Analysis
10.6. Foxtel
10.6.1. Business Overview
10.6.2. Company Snapshot
10.6.3. Company Market Share Analysis
10.6.4. Company Product Portfolio
10.6.5. Recent Developments
10.6.6. SWOT Analysis
10.7. Rostelecom
10.7.1. Business Overview
10.7.2. Company Snapshot
10.7.3. Company Market Share Analysis
10.7.4. Company Product Portfolio
10.7.5. Recent Developments
10.7.6. SWOT Analysis
10.8. Charter Communications (Spectrum)
10.8.1. Business Overview
10.8.2. Company Snapshot
10.8.3. Company Market Share Analysis
10.8.4. Company Product Portfolio
10.8.5. Recent Developments
10.8.6. SWOT Analysis
10.9. Tata Sky
10.9.1. Business Overview
10.9.2. Company Snapshot
10.9.3. Company Market Share Analysis
10.9.4. Company Product Portfolio
10.9.5. Recent Developments
10.9.6. SWOT Analysis
10.10. Xfinity (Comcast Corporation)
10.10.1. Business Overview
10.10.2. Company Snapshot
10.10.3. Company Market Share Analysis
10.10.4. Company Product Portfolio
10.10.5. Recent Developments
10.10.6. SWOT Analysis
List of Table
1. Global PayTV Market, By Blockchain Type, 2019-2030 (USD Billion)
2. Global Satellite TV PayTV Market, By Region, 2019-2030 (USD Billion)
3. Global Cable TV PayTV Market, By Region, 2019-2030 (USD Billion)
4. Global IPTV PayTV Market, By Region, 2019-2030 (USD Billion)
5. Global PayTV Market, By Application, 2019-2030 (USD Billion)
6. Global Commercial PayTV Market, By Region, 2019-2030 (USD Billion)
7. Global Residential PayTV Market, By Region, 2019-2030 (USD Billion)
8. North America PayTV Market, By Blockchain Type, 2019-2030 (USD Billion)
9. North America PayTV Market, By Application, 2019-2030 (USD Billion)
10. U.S. PayTV Market, By Blockchain Type, 2019-2030 (USD Billion)
11. U.S. PayTV Market, By Application, 2019-2030 (USD Billion)
12. Canada PayTV Market, By Blockchain Type, 2019-2030 (USD Billion)
13. Canada PayTV Market, By Application, 2019-2030 (USD Billion)
14. Mexico PayTV Market, By Blockchain Type, 2019-2030 (USD Billion)
15. Mexico PayTV Market, By Application, 2019-2030 (USD Billion)
16. Europe PayTV Market, By Blockchain Type, 2019-2030 (USD Billion)
17. Europe PayTV Market, By Application, 2019-2030 (USD Billion)
18. Germany PayTV Market, By Blockchain Type, 2019-2030 (USD Billion)
19. Germany PayTV Market, By Application, 2019-2030 (USD Billion)
20. France PayTV Market, By Blockchain Type 2019-2030 (USD Billion)
21. France PayTV Market, By Application, 2019-2030 (USD Billion)
22. U.K. PayTV Market, By Blockchain Type, 2019-2030 (USD Billion)
23. U.K. PayTV Market, By Application, 2019-2030 (USD Billion)
24. Italy PayTV Market, By Blockchain Type, 2019-2030 (USD Billion)
25. Italy PayTV Market, By Application, 2019-2030 (USD Billion)
26. Spain PayTV Market, By Blockchain Type, 2019-2030 (USD Billion)
27. Spain PayTV Market, By Application, 2019-2030 (USD Billion)
28. Asia Pacific PayTV Market, By Blockchain Type, 2019-2030 (USD Billion)
29. Asia Pacific PayTV Market, By Application, 2019-2030 (USD Billion)
30. Japan PayTV Market, By Blockchain Type, 2019-2030 (USD Billion)
31. Japan PayTV Market, By Application, 2019-2030 (USD Billion)
32. China PayTV Market, By Blockchain Type 2019-2030 (USD Billion)
33. China PayTV Market, By Application, 2019-2030 (USD Billion)
34. India PayTV Market, By Blockchain Type 2019-2030 (USD Billion)
35. India PayTV Market, By Application, 2019-2030 (USD Billion)
36. South America PayTV Market, By Blockchain Type, 2019-2030 (USD Billion)
37. South America PayTV Market, By Application, 2019-2030 (USD Billion)
38. Brazil PayTV Market, By Blockchain Type 2019-2030 (USD Billion)
39. Brazil PayTV Market, By Application, 2019-2030 (USD Billion)
40. Middle East and Africa PayTV Market, By Blockchain Type, 2019-2030 (USD Billion)
41. Middle East and Africa PayTV Market, By Application, 2019-2030 (USD Billion)
42. UAE PayTV Market, By Blockchain Type, 2019-2030 (USD Billion)
43. UAE PayTV Market, By Application, 2019-2030 (USD Billion)
44. South Africa PayTV Market, By Blockchain Type 2019-2030 (USD Billion)
45. South Africa PayTV Market, By Application, 2019-2030 (USD Billion)
List of Figures
1. Global PayTV Market Segmentation
2. PayTV Market: Research Methodology
3. Market Size Estimation Methodology: Bottom-Up Approach
4. Market Size Estimation Methodology: Top-Down Approach
5. Data Triangulation
6. Porter’s Five Forces Analysis
7. Value Chain Analysis
8. Global PayTV Market Attractiveness Analysis by Blockchain Type
9. Global PayTV Market Attractiveness Analysis by Application
10. Global PayTV Market Attractiveness Analysis by Region
11. Global PayTV Market: Dynamics
12. Global PayTV Market Share by Blockchain Type (2022 & 2030)
13. Global PayTV Market Share by Application (2022 & 2030)
14. Global PayTV Market Share by Regions (2022 & 2030)
15. Global PayTV Market Share by Company (2021)
This study forecasts revenue at global, regional, and country levels from 2019 to 2030. The Brainy Insights has segmented the global pay tv market based on below mentioned segments:
Global Pay Tv Market by Blockchain Type:
Global Pay Tv Market by Application:
Global Pay Tv Market by Region:
Research has its special purpose to undertake marketing efficiently. In this competitive scenario, businesses need information across all industry verticals; the information about customer wants, market demand, competition, industry trends, distribution channels etc. This information needs to be updated regularly because businesses operate in a dynamic environment. Our organization, The Brainy Insights incorporates scientific and systematic research procedures in order to get proper market insights and industry analysis for overall business success. The analysis consists of studying the market from a miniscule level wherein we implement statistical tools which helps us in examining the data with accuracy and precision.
Our research reports feature both; quantitative and qualitative aspects for any market. Qualitative information for any market research process are fundamental because they reveal the customer needs and wants, usage and consumption for any product/service related to a specific industry. This in turn aids the marketers/investors in knowing certain perceptions of the customers. Qualitative research can enlighten about the different product concepts and designs along with unique service offering that in turn, helps define marketing problems and generate opportunities. On the other hand, quantitative research engages with the data collection process through interviews, e-mail interactions, surveys and pilot studies. Quantitative aspects for the market research are useful to validate the hypotheses generated during qualitative research method, explore empirical patterns in the data with the help of statistical tools, and finally make the market estimations.
The Brainy Insights offers comprehensive research and analysis, based on a wide assortment of factual insights gained through interviews with CXOs and global experts and secondary data from reliable sources. Our analysts and industry specialist assume vital roles in building up statistical tools and analysis models, which are used to analyse the data and arrive at accurate insights with exceedingly informative research discoveries. The data provided by our organization have proven precious to a diverse range of companies, facilitating them to address issues such as determining which products/services are the most appealing, whether or not customers use the product in the manner anticipated, the purchasing intentions of the market and many others.
Our research methodology encompasses an idyllic combination of primary and secondary initiatives. Key phases involved in this process are listed below:

The phase involves the gathering and collecting of market data and its related information with the help of different sources & research procedures.

The data procurement stage involves in data gathering and collecting through various data sources.
This stage involves in extensive research. These data sources includes:
Purchased Database: Purchased databases play a crucial role in estimating the market sizes irrespective of the domain. Our purchased database includes:
Primary Research: The Brainy Insights interacts with leading companies and experts of the concerned domain to develop the analyst team’s market understanding and expertise. It improves and substantiates every single data presented in the market reports. Primary research mainly involves in telephonic interviews, E-mail interactions and face-to-face interviews with the raw material providers, manufacturers/producers, distributors, & independent consultants. The interviews that we conduct provides valuable data on market size and industry growth trends prevailing in the market. Our organization also conducts surveys with the various industry experts in order to gain overall insights of the industry/market. For instance, in healthcare industry we conduct surveys with the pharmacists, doctors, surgeons and nurses in order to gain insights and key information of a medical product/device/equipment which the customers are going to usage. Surveys are conducted in the form of questionnaire designed by our own analyst team. Surveys plays an important role in primary research because surveys helps us to identify the key target audiences of the market. Additionally, surveys helps to identify the key target audience engaged with the market. Our survey team conducts the survey by targeting the key audience, thus gaining insights from them. Based on the perspectives of the customers, this information is utilized to formulate market strategies. Moreover, market surveys helps us to understand the current competitive situation of the industry. To be precise, our survey process typically involve with the 360 analysis of the market. This analytical process begins by identifying the prospective customers for a product or service related to the market/industry to obtain data on how a product/service could fit into customers’ lives.

Secondary Research: The secondary data sources includes information published by the on-profit organizations such as World bank, WHO, company fillings, investor presentations, annual reports, national government documents, statistical databases, blogs, articles, white papers and others. From the annual report, we analyse a company’s revenue to understand the key segment and market share of that organization in a particular region. We analyse the company websites and adopt the product mapping technique which is important for deriving the segment revenue. In the product mapping method, we select and categorize the products offered by the companies catering to domain specific market, deduce the product revenue for each of the companies so as to get overall estimation of the market size. We also source data and analyses trends based on information received from supply side and demand side intermediaries in the value chain. The supply side denotes the data gathered from supplier, distributor, wholesaler and the demand side illustrates the data gathered from the end customers for respective market domain.

The supply side for a domain specific market is analysed by:
The demand side for the market is estimated through:
In-house Library: Apart from these third-party sources, we have our in-house library of qualitative and quantitative information. Our in-house database includes market data for various industry and domains. These data are updated on regular basis as per the changing market scenario. Our library includes, historic databases, internal audit reports and archives.
Sometimes there are instances where there is no metadata or raw data available for any domain specific market. For those cases, we use our expertise to forecast and estimate the market size in order to generate comprehensive data sets. Our analyst team adopt a robust research technique in order to produce the estimates:
Data Synthesis: This stage involves the analysis & mapping of all the information obtained from the previous step. It also involves in scrutinizing the data for any discrepancy observed while data gathering related to the market. The data is collected with consideration to the heterogeneity of sources. Robust scientific techniques are in place for synthesizing disparate data sets and provide the essential contextual information that can orient market strategies. The Brainy Insights has extensive experience in data synthesis where the data passes through various stages:


Market Deduction & Formulation: The final stage comprises of assigning data points at appropriate market spaces so as to deduce feasible conclusions. Analyst perspective & subject matter expert based holistic form of market sizing coupled with industry analysis also plays a crucial role in this stage.
This stage involves in finalization of the market size and numbers that we have collected from data integration step. With data interpolation, it is made sure that there is no gap in the market data. Successful trend analysis is done by our analysts using extrapolation techniques, which provide the best possible forecasts for the market.
Data Validation & Market Feedback: Validation is the most important step in the process. Validation & re-validation via an intricately designed process helps us finalize data-points to be used for final calculations.

The Brainy Insights interacts with leading companies and experts of the concerned domain to develop the analyst team’s market understanding and expertise. It improves and substantiates every single data presented in the market reports. The data validation interview and discussion panels are typically composed of the most experienced industry members. The participants include, however, are not limited to:
Moreover, we always validate our data and findings through primary respondents from all the major regions we are working on.


Free Customization
Fortune 500 Clients
Free Yearly Update On Purchase Of Multi/Corporate License
Companies Served Till Date