- +1-315-215-1633
- sales@thebrainyinsights.com

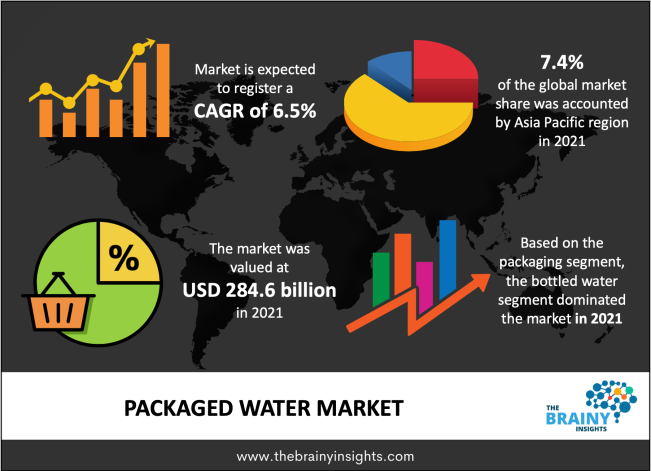
The packaged water market size was valued at USD 284.6 billion in 2021 and is anticipated to grow at a CAGR of 6.5% from 2022 to 2030. The rising demand for clean and safe drinking water among consumer is driving the market. In countries such as Ethiopia, Uganda, and Somalia clean & safe drinking water is not available readily, hence consumers are dependent on packaged water. However, in developed countries like the US, the UK, Germany, and France, consumers are seeking packaged water with added benefits, which has been driving the growth in developed nations.
Increasing health concerns among consumers have forced them to adopt purified & natural spring water. While traveling, consumers prefer to purchase a pack of 12-24 small bottles and while going to work, the consumer usually purchases a single bottle of 1 liter. For at-home consumption, people usually buy big bottles or subscribe to home delivery of water. The degrading quality of tap water due to increasing pollution levels across the globe has been a major factor leading consumers to switch to packaged water even when eating out of home in restaurants & cafes.
Nutrient-rich water, either flavored or unflavored has been gaining consumer interest. The consumption has been growing among working professionals, travelers, and kids. Most parent wants their kids to eat & drink healthy food & beverages that augment their growth, thus, millennial parents have switched to fortified packaged water, which is rich in vitamins & minerals and healthier than fruit juices and sodas.
Get an overview of this study by requesting a free sample
The trend of health & wellness has propelled the market for packaged water labeled as alkaline, pH balanced, electrolytes rich, fiber-infused, probiotic-rich, and antioxidant-infused. Product innovation in this industry has provided many options to consumers. For instance, Keurig Dr. Pepper through its brand Bai offers antioxidant water targeted at health-conscious consumers. It also offers ultra-purified water through its subsidiary CORE Nutrition LLC, which is available in 5 different sizes.
The spread of covid-19 impacted the packaged water industry owing to lockdown restrictions imposed by several governments. Further, the temporary closure of food service distribution channels such as café, restaurants, clubs, and bars negatively impacted the sale of packaged water through this channel. According to International Bottled Water Association (IWBA), bottlers, distributors, and suppliers worked tirelessly to ensure that bottled water is available to the consumers
Sparkling water is anticipated to register the fastest growth with a CAGR of 7.5% from 2022-2030. The increasing consumer demand for this water as an alternative to carbonated soda is driving the segment’s growth. Consumers are switching to flavored sparkling water as these are healthy drinks with no added sugar or sweeteners but with a taste of the fruit that enhances its profile. Furthermore, increasing production innovation in this category is expected to fuel the segment’s growth. For instance, in May 2022, Dash Water introduced a new mango-flavored sparkling water in the UK and is available at Wholefoods, Waitrose, Sainsbury’s, and WH Smith.
Purified water accounted for the largest market share of 40% in 2021. The diseases caused by drinking contaminated water such as diarrhea and dysentery is propelling the demand for this water. It is the most common form of bottled water that is available across countries at a reasonable price. Some of the popular brands of purified water include Dasani, Aquafina, Nestlé Pure Life, Sam’s Choice, and Kirkland Signature.
Bottled water accounted for the largest market share in 2021. Bottled packaging is the most common packaging for packaged water across the geographies. Most manufacturers offer packaged water in plastic recyclable bottles The growing consumer concern for the environment and sustainability has encouraged manufacturers to innovate packaging. For instance, in June 2021 Nestlé developed two new packaging for its Vittel natural mineral water bottles. The new bottles function like conventional bottles but generate less plastic.
The canned packaged water is anticipated to register the fastest CAGR during the forecast period. The rising demand for flavored sparkling water has led to the growth of this packaging. Moreover, product launches are also catering to the growth of this market. For instance, in May 2021 PepsiCo launched a canned sparkling water “soulboost” It is made of functional ingredients like ginseng, L-theanine, and real fruit juice.
The on-trade distribution channel is anticipated to witness a faster CAGR of 7.8% during the forecast period. The growing demand for packaged water at restaurants, cafes, and bars is propelling market growth. Due to increasing safety concerns among consumers, the demand for packaged water has surged through an on-trade channel. Further, the increasing spending capacity of consumers and rising awareness about various types of packaged water has coerced on-trade channels to offer various varieties of packaged water for the customer to choose from.
The off-trade distribution channel was a larger distribution channel accounting for a market share of more than 85% in 2021. The consumer usually purchases packaged water from supermarkets, hypermarkets, convenience stores, and traditional grocery stores owing to the wide availability of brands and package sizes. Travelers also purchase packaged water from a pharmacy in the countries like the US, the UK, and Germany as they also stock a variety of packaged water.
The Asia Pacific region is anticipated to witness the fastest CAGR of 7.4% during the forecast period. The increasing demand for safe and purified packaged water in countries like China, India, the Philippines, and Indonesia is expected to propel market growth. Furthermore, increasing tourism in this region has also increased the consumption of packaged water. Additionally, awareness about different product variants is also likely to fuel the demand in the coming years.
North America accounted for the second largest market with a share of 23.6% in 2021. The market in this region is driven by adoption of healthly lifestyle. As consumers are seeking products with health benefits, the demand for functional packaged water such as enhanced water and probiotic water is increasing in the region. Moreover, increasing demand for premium products and eco-friendly packaging is also expected to boost the market growth.
The packaged water market consists of a large number of companies ranging from multinational companies to small & mid-size companies. The majority of the market share has been captured by large companies as they have a wide distribution networks and bottling plants across various countries.
Segments Covered in the Report
1. Introduction
1.1. Objectives of the Study
1.2. Market Definition
1.3. Research Scope
1.4. Currency
1.5. Key Target Audience
2. Research Methodology and Assumptions
3. Executive Summary
4. Premium Insights
4.1. Porter’s Five Forces Analysis
4.2. Value Chain Analysis
4.3. Top Investment Pockets
4.3.1. Market Attractiveness Analysis by Product
4.3.2. Market Attractiveness Analysis by Packaging
4.3.3. Market Attractiveness Analysis by Distribution Channel
4.3.4. Market Attractiveness Analysis by Region
4.4. Industry Trends
5. Market Dynamics
5.1. Market Evaluation
5.2. Drivers
5.2.1. Increasing health concerns among consumers
5.3. Restraints
5.3.1. Stringent rules and regulations
5.4. Opportunities
5.4.1. Increasing demand at the On-trade restaurants
5.4.2. Growing trend of health & wellness
5.5. Challenges
5.5.1. Economic slowdown
6. Global Packaged Water Market Analysis and Forecast, By Product
6.1. Segment Overview
6.2. Spring Water
6.3. Purified water
6.4. Mineral water
6.5. Sparkling water
6.6. Others
7. Global Packaged Water Market Analysis and Forecast, By Packaging
7.1. Segment Overview
7.2. Bottled
7.3. Canned
7.4. Others
8. Global Packaged water Market Analysis and Forecast, By Distribution Channel
8.1. Segment Overview
8.2. Off-trade
8.3. On-trade
9. Global Packaged water Market Analysis and Forecast, By Regional Analysis
9.1. Segment Overview
9.2. North America
9.2.1. U.S.
9.2.2. Canada
9.2.3. Mexico
9.3. Europe
9.3.1. Germany
9.3.2. France
9.3.3. U.K.
9.3.4. Italy
9.3.5. Spain
9.4. Asia-Pacific
9.4.1. Japan
9.4.2. China
9.4.3. India
9.4.4. South Korea
9.4.5. Australia
9.5. South America
9.5.1. Brazil
9.5.2. Argentina
9.6. Middle East and Africa
9.6.1. UAE
9.6.2. South Africa
9.6.3. Saudi Arabia
10. Global Packaged water Market-Competitive Landscape
10.1. Overview
10.2. Market Share of Key Players in the Packaged water Market
10.2.1. Global Company Market Share
10.2.2. North America Company Market Share
10.2.3. Europe Company Market Share
10.2.4. APAC Company Market Share
10.3. Competitive Situations and Trends
10.3.1. Product Launches and Developments
10.3.2. Partnerships, Collaborations, and Agreements
10.3.3. Mergers & Acquisitions
10.3.4. Expansions
11. Company Profiles
11.1. The Coca Cola Company
11.1.1. Business Overview
11.1.2. Company Snapshot
11.1.3. Company Market Share Analysis
11.1.4. Company Product Portfolio
11.1.5. Recent Developments
11.1.6. SWOT Analysis
11.2. Nestlé
11.2.1. Business Overview
11.2.2. Company Snapshot
11.2.3. Company Market Share Analysis
11.2.4. Company Product Portfolio
11.2.5. Recent Developments
11.2.6. SWOT Analysis
11.3. National Beverage Corp.
11.3.1. Business Overview
11.3.2. Company Snapshot
11.3.3. Company Market Share Analysis
11.3.4. Company Product Portfolio
11.3.5. Recent Developments
11.3.6. SWOT Analysis
11.4. PepsiCo
11.4.1. Business Overview
11.4.2. Company Snapshot
11.4.3. Company Market Share Analysis
11.4.4. Company Product Portfolio
11.4.5. Recent Developments
11.4.6. SWOT Analysis
11.5. Tata Consumer Products
11.5.1. Business Overview
11.5.2. Company Snapshot
11.5.3. Company Market Share Analysis
11.5.4. Company Product Portfolio
11.5.5. Recent Developments
11.5.6. SWOT Analysis
11.6. Primo Water Corporation
11.6.1. Business Overview
11.6.2. Company Snapshot
11.6.3. Company Market Share Analysis
11.6.4. Company Product Portfolio
11.6.5. Recent Developments
11.6.6. SWOT Analysis
11.7. Keurig Dr Pepper Inc.
11.7.1. Business Overview
11.7.2. Company Snapshot
11.7.3. Company Market Share Analysis
11.7.4. Company Product Portfolio
11.7.5. Recent Developments
11.7.6. SWOT Analysis
11.8. Saratoga Spring Water Co.
11.8.1. Business Overview
11.8.2. Company Snapshot
11.8.3. Company Market Share Analysis
11.8.4. Company Product Portfolio
11.8.5. Recent Developments
11.8.6. SWOT Analysis
11.9. FIJI Water Company LLC
11.9.1. Business Overview
11.9.2. Company Snapshot
11.9.3. Company Market Share Analysis
11.9.4. Company Product Portfolio
11.9.5. Recent Developments
11.9.6. SWOT Analysis
11.10. Danone
11.10.1. Business Overview
11.10.2. Company Snapshot
11.10.3. Company Market Share Analysis
11.10.4. Company Product Portfolio
11.10.5. Recent Developments
11.10.6. SWOT Analysis
11.11. Hint Inc.
11.11.1. Business Overview
11.11.2. Company Snapshot
11.11.3. Company Market Share Analysis
11.11.4. Company Product Portfolio
11.11.5. Recent Developments
11.11.6. SWOT Analysis
11.12. VOSS WATER
11.12.1. Business Overview
11.12.2. Company Snapshot
11.12.3. Company Market Share Analysis
11.12.4. Company Product Portfolio
11.12.5. Recent Developments
11.12.6. SWOT Analysis
11.13. Gerolsteiner Brunnen GmbH & Co. KG
11.13.1. Business Overview
11.13.2. Company Snapshot
11.13.3. Company Market Share Analysis
11.13.4. Company Product Portfolio
11.13.5. Recent Developments
11.13.6. SWOT Analysis
11.14. Nongfu Spring
11.14.1. Business Overview
11.14.2. Company Snapshot
11.14.3. Company Market Share Analysis
11.14.4. Company Product Portfolio
11.14.5. Recent Developments
11.14.6. SWOT Analysis
List of Table
1. Global Packaged water Market, By Product Type, 2019-2030 (USD Billion) (Tons)
2. Global Spring water Packaged water Market, By Region, 2019-2030 (USD Billion) (Tons)
3. Global Purified water Packaged water Market, By Region, 2019-2030 (USD Billion) (Tons)
4. Global Mineral water Packaged water Market, By Region, 2019-2030 (USD Billion) (Tons)
5. Global Sparkling water Packaged water Market, By Region, 2019-2030 (USD Billion) (Tons)
6. Global Others Packaged water Market, By Region, 2019-2030 (USD Billion) (Tons)
7. Global Packaged water Market, By Packaging, 2019-2030 (USD Billion) (Tons)
8. Global Bottled Packaged water Market, By Region, 2019-2030 (USD Billion) (Tons)
9. Global Canned Packaged water Market, By Region, 2019-2030 (USD Billion) (Tons)
10. Global Others Packaged water Market, By Region, 2019-2030 (USD Billion) (Tons)
11. Global Packaged water Market, By Distribution Channel, 2019-2030 (USD Billion) (Tons)
12. Global Off-trade Packaged water Market, By Region, 2019-2030 (USD Billion) (Tons)
13. Global On-trade Packaged water Market, By Region, 2019-2030 (USD Billion) (Tons)
14. Global Packaged water Market, By Region, 2019-2030 (USD Billion) (Tons)
15. North America Packaged water Market, By Product Type, 2019-2030 (USD Billion) (Tons)
16. North America Packaged water Market, By Packaging, 2019-2030 (USD Billion) (Tons)
17. North America Packaged water Market, By Distribution Channel, 2019-2030 (USD Billion) (Tons)
18. U.S. Packaged water Market, By Product Type, 2019-2030 (USD Billion) (Tons)
19. U.S. Packaged water Market, By Packaging, 2019-2030 (USD Billion) (Tons)
20. U.S. Packaged water Market, By Distribution Channel, 2019-2030 (USD Billion) (Tons)
21. Canada Packaged water Market, By Product Type, 2019-2030 (USD Billion) (Tons)
22. Canada Packaged water Market, By Packaging, 2019-2030 (USD Billion) (Tons)
23. Canada Packaged water Market, By Distribution Channel, 2019-2030 (USD Billion) (Tons)
24. Mexico Packaged water Market, By Product Type, 2019-2030 (USD Billion) (Tons)
25. Mexico Packaged water Market, By Packaging, 2019-2030 (USD Billion) (Tons)
26. Mexico Packaged water Market, By Distribution Channel, 2019-2030 (USD Billion) (Tons)
27. Europe Packaged water Market, By Product Type, 2019-2030 (USD Billion) (Tons)
28. Europe Packaged water Market, By Packaging, 2019-2030 (USD Billion) (Tons)
29. Europe Packaged water Market, By Distribution Channel, 2019-2030 (USD Billion) (Tons)
30. Germany Packaged water Market, By Product Type, 2019-2030 (USD Billion) (Tons)
31. Germany Packaged water Market, By Packaging, 2019-2030 (USD Billion) (Tons)
32. Germany Packaged water Market, By Distribution Channel, 2019-2030 (USD Billion) (Tons)
33. France Packaged water Market, By Product Type, 2019-2030 (USD Billion) (Tons)
34. France Packaged water Market, By Packaging, 2019-2030 (USD Billion) (Tons)
35. France Packaged water Market, By Distribution Channel, 2019-2030 (USD Billion) (Tons)
36. U.K. Packaged water Market, By Product Type, 2019-2030 (USD Billion) (Tons)
37. U.K. Packaged water Market, By Packaging, 2019-2030 (USD Billion) (Tons)
38. U.K. Packaged water Market, By Distribution Channel, 2019-2030 (USD Billion) (Tons)
39. Italy Packaged water Market, By Product Type, 2019-2030 (USD Billion) (Tons)
40. Italy Packaged water Market, By Packaging, 2019-2030 (USD Billion) (Tons)
41. Italy Packaged water Market, By Distribution Channel, 2019-2030 (USD Billion) (Tons)
42. Italy Packaged water Market, By Packaging, 2019-2030 (USD Billion) (Tons)
43. Spain Packaged water Market, By Product Type, 2019-2030 (USD Billion) (Tons)
44. Spain Packaged water Market, By Distribution Channel, 2019-2030 (USD Billion) (Tons)
45. Spain Packaged water Market, By Packaging, 2019-2030 (USD Billion) (Tons)
46. Asia Pacific Packaged water Market, By Product Type, 2019-2030 (USD Billion) (Tons)
47. Asia Pacific Packaged water Market, By Packaging, 2019-2030 (USD Billion) (Tons)
48. Asia Pacific Packaged water Market, By Distribution Channel, 2019-2030 (USD Billion) (Tons)
49. Japan Packaged water Market, By Product Type, 2019-2030 (USD Billion) (Tons)
50. Japan Packaged water Market, By Distribution Channel, 2019-2030 (USD Billion) (Tons)
51. Japan Packaged water Market, By Packaging, 2019-2030 (USD Billion) (Tons)
52. China Packaged water Market, By Product Type, 2019-2030 (USD Billion) (Tons)
53. China Packaged water Market, By Distribution Channel, 2019-2030 (USD Billion) (Tons)
54. China Packaged water Market, By Packaging, 2019-2030 (USD Billion) (Tons)
55. India Packaged water Market, By Product Type, 2019-2030 (USD Billion) (Tons)
56. India Packaged water Market, By Distribution Channel, 2019-2030 (USD Billion) (Tons)
57. India Packaged water Market, By Packaging, 2019-2030 (USD Billion) (Tons)
58. South Korea Packaged water Market, By Product Type, 2019-2030 (USD Billion) (Tons)
59. South Korea Packaged water Market, By Packaging, 2019-2030 (USD Billion) (Tons)
60. South Korea Packaged water Market, By Distribution Channel, 2019-2030 (USD Billion) (Tons)
61. Australia Packaged water Market, By Product Type, 2019-2030 (USD Billion) (Tons)
62. Australia Packaged water Market, By Distribution Channel, 2019-2030 (USD Billion) (Tons)
63. Australia Packaged water Market, By Packaging, 2019-2030 (USD Billion) (Tons)
64. South America Packaged water Market, By Product Type, 2019-2030 (USD Billion) (Tons)
65. South America Packaged water Market, By Packaging, 2019-2030 (USD Billion) (Tons)
66. South America Packaged water Market, By Distribution Channel, 2019-2030 (USD Billion) (Tons)
67. Brazil Packaged water Market, By Product Type, 2019-2030 (USD Billion) (Tons)
68. Brazil Packaged water Market, By Distribution Channel, 2019-2030 (USD Billion) (Tons)
69. Brazil Packaged water Market, By Packaging, 2019-2030 (USD Billion) (Tons)
70. Argentina Packaged water Market, By Product Type, 2019-2030 (USD Billion) (Tons)
71. Argentina Packaged water Market, By Distribution Channel, 2019-2030 (USD Billion) (Tons)
72. Argentina Packaged water Market, By Packaging, 2019-2030 (USD Billion) (Tons)
73. Middle East and Africa Packaged water Market, By Product Type, 2019-2030 (USD Billion) (Tons)
74. Middle East and Africa Packaged water Market, By Distribution Channel, 2019-2030 (USD Billion) (Tons)
75. Middle East and Africa Packaged water Market, By Packaging, 2019-2030 (USD Billion) (Tons)
76. UAE Packaged water Market, By Product Type, 2019-2030 (USD Billion) (Tons)
77. UAE Packaged water Market, By Distribution Channel, 2019-2030 (USD Billion) (Tons)
78. UAE Packaged water Market, By Packaging, 2019-2030 (USD Billion) (Tons)
79. South Africa Packaged water Market, By Product Type, 2019-2030 (USD Billion) (Tons)
80. South Africa Packaged water Market, By Distribution Channel, 2019-2030 (USD Billion) (Tons)
81. South Africa Packaged water Market, By Packaging, 2019-2030 (USD Billion) (Tons)
82. Saudi Arabia Packaged water Market, By Product Type, 2019-2030 (USD Billion) (Tons)
83. Saudi Arabia Packaged water Market, By Distribution Channel, 2019-2030 (USD Billion) (Tons)
84. Saudi Arabia Packaged water Market, By Packaging, 2019-2030 (USD Billion) (Tons)
List of Figures
1. Global Packaged water Market Segmentation
2. Packaged water Market: Research Methodology
3. Market Size Estimation Methodology: Bottom-Up Approach
4. Market Size Estimation Methodology: Top-Down Approach
5. Data Triangulation
6. Porter’s Five Forces Analysis
7. Value Chain Analysis
8. Global Packaged water Market Attractiveness Analysis by Product
9. Global Packaged water Market Attractiveness Analysis by Packaging
10. Global Packaged water Market Attractiveness Analysis by Distribution Channel
11. Global Packaged water Market Attractiveness Analysis by Region
12. Global Packaged water Market: Dynamics
13. Global Packaged water Market Share by Product Type (2022 & 2030)
14. Global Packaged water Market Share by Packaging (2022 & 2030)
15. Global Packaged water Market Share by Distribution Channel (2022 & 2030)
16. Global Packaged water Market Share by Regions (2022 & 2030)
17. Global Packaged water Market Share by Company (2021)
Segments Covered in the Report
Research has its special purpose to undertake marketing efficiently. In this competitive scenario, businesses need information across all industry verticals; the information about customer wants, market demand, competition, industry trends, distribution channels etc. This information needs to be updated regularly because businesses operate in a dynamic environment. Our organization, The Brainy Insights incorporates scientific and systematic research procedures in order to get proper market insights and industry analysis for overall business success. The analysis consists of studying the market from a miniscule level wherein we implement statistical tools which helps us in examining the data with accuracy and precision.
Our research reports feature both; quantitative and qualitative aspects for any market. Qualitative information for any market research process are fundamental because they reveal the customer needs and wants, usage and consumption for any product/service related to a specific industry. This in turn aids the marketers/investors in knowing certain perceptions of the customers. Qualitative research can enlighten about the different product concepts and designs along with unique service offering that in turn, helps define marketing problems and generate opportunities. On the other hand, quantitative research engages with the data collection process through interviews, e-mail interactions, surveys and pilot studies. Quantitative aspects for the market research are useful to validate the hypotheses generated during qualitative research method, explore empirical patterns in the data with the help of statistical tools, and finally make the market estimations.
The Brainy Insights offers comprehensive research and analysis, based on a wide assortment of factual insights gained through interviews with CXOs and global experts and secondary data from reliable sources. Our analysts and industry specialist assume vital roles in building up statistical tools and analysis models, which are used to analyse the data and arrive at accurate insights with exceedingly informative research discoveries. The data provided by our organization have proven precious to a diverse range of companies, facilitating them to address issues such as determining which products/services are the most appealing, whether or not customers use the product in the manner anticipated, the purchasing intentions of the market and many others.
Our research methodology encompasses an idyllic combination of primary and secondary initiatives. Key phases involved in this process are listed below:

The phase involves the gathering and collecting of market data and its related information with the help of different sources & research procedures.

The data procurement stage involves in data gathering and collecting through various data sources.
This stage involves in extensive research. These data sources includes:
Purchased Database: Purchased databases play a crucial role in estimating the market sizes irrespective of the domain. Our purchased database includes:
Primary Research: The Brainy Insights interacts with leading companies and experts of the concerned domain to develop the analyst team’s market understanding and expertise. It improves and substantiates every single data presented in the market reports. Primary research mainly involves in telephonic interviews, E-mail interactions and face-to-face interviews with the raw material providers, manufacturers/producers, distributors, & independent consultants. The interviews that we conduct provides valuable data on market size and industry growth trends prevailing in the market. Our organization also conducts surveys with the various industry experts in order to gain overall insights of the industry/market. For instance, in healthcare industry we conduct surveys with the pharmacists, doctors, surgeons and nurses in order to gain insights and key information of a medical product/device/equipment which the customers are going to usage. Surveys are conducted in the form of questionnaire designed by our own analyst team. Surveys plays an important role in primary research because surveys helps us to identify the key target audiences of the market. Additionally, surveys helps to identify the key target audience engaged with the market. Our survey team conducts the survey by targeting the key audience, thus gaining insights from them. Based on the perspectives of the customers, this information is utilized to formulate market strategies. Moreover, market surveys helps us to understand the current competitive situation of the industry. To be precise, our survey process typically involve with the 360 analysis of the market. This analytical process begins by identifying the prospective customers for a product or service related to the market/industry to obtain data on how a product/service could fit into customers’ lives.

Secondary Research: The secondary data sources includes information published by the on-profit organizations such as World bank, WHO, company fillings, investor presentations, annual reports, national government documents, statistical databases, blogs, articles, white papers and others. From the annual report, we analyse a company’s revenue to understand the key segment and market share of that organization in a particular region. We analyse the company websites and adopt the product mapping technique which is important for deriving the segment revenue. In the product mapping method, we select and categorize the products offered by the companies catering to domain specific market, deduce the product revenue for each of the companies so as to get overall estimation of the market size. We also source data and analyses trends based on information received from supply side and demand side intermediaries in the value chain. The supply side denotes the data gathered from supplier, distributor, wholesaler and the demand side illustrates the data gathered from the end customers for respective market domain.

The supply side for a domain specific market is analysed by:
The demand side for the market is estimated through:
In-house Library: Apart from these third-party sources, we have our in-house library of qualitative and quantitative information. Our in-house database includes market data for various industry and domains. These data are updated on regular basis as per the changing market scenario. Our library includes, historic databases, internal audit reports and archives.
Sometimes there are instances where there is no metadata or raw data available for any domain specific market. For those cases, we use our expertise to forecast and estimate the market size in order to generate comprehensive data sets. Our analyst team adopt a robust research technique in order to produce the estimates:
Data Synthesis: This stage involves the analysis & mapping of all the information obtained from the previous step. It also involves in scrutinizing the data for any discrepancy observed while data gathering related to the market. The data is collected with consideration to the heterogeneity of sources. Robust scientific techniques are in place for synthesizing disparate data sets and provide the essential contextual information that can orient market strategies. The Brainy Insights has extensive experience in data synthesis where the data passes through various stages:


Market Deduction & Formulation: The final stage comprises of assigning data points at appropriate market spaces so as to deduce feasible conclusions. Analyst perspective & subject matter expert based holistic form of market sizing coupled with industry analysis also plays a crucial role in this stage.
This stage involves in finalization of the market size and numbers that we have collected from data integration step. With data interpolation, it is made sure that there is no gap in the market data. Successful trend analysis is done by our analysts using extrapolation techniques, which provide the best possible forecasts for the market.
Data Validation & Market Feedback: Validation is the most important step in the process. Validation & re-validation via an intricately designed process helps us finalize data-points to be used for final calculations.

The Brainy Insights interacts with leading companies and experts of the concerned domain to develop the analyst team’s market understanding and expertise. It improves and substantiates every single data presented in the market reports. The data validation interview and discussion panels are typically composed of the most experienced industry members. The participants include, however, are not limited to:
Moreover, we always validate our data and findings through primary respondents from all the major regions we are working on.


Free Customization
Fortune 500 Clients
Free Yearly Update On Purchase Of Multi/Corporate License
Companies Served Till Date