- +1-315-215-1633
- sales@thebrainyinsights.com

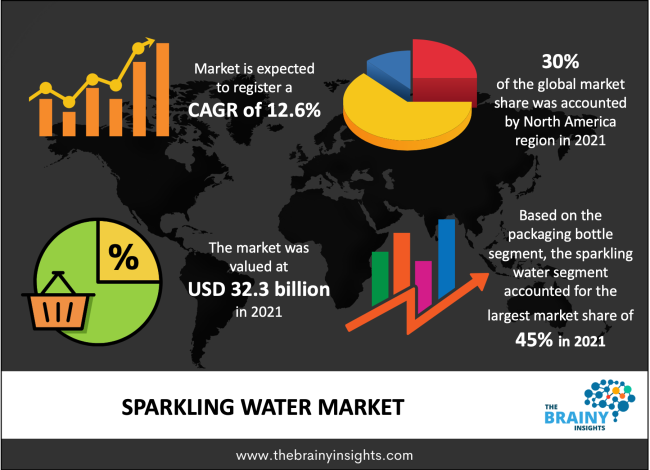
The sparkling water market was valued at USD 32.3 billion in 2021 and is expected to reach USD 93.8 billion by 2030, expanding at a CAGR of 12.6% from 2022 to 2030. The increasing awareness about sparkling water in its role in improving digestion is expected to propel its consumption. According to the American Dental Association, the consumption of sparkling water daily is fine even though it is more acidic than still water. These researches are backing the demand for sparkling water.
The demand for bottled water has significantly grown owing to the rising demand for clean and healthy drinking water. The increasing consumption of sparkling water over carbonated soft drinks and sodas is anticipated to drive market growth. Further, increase in per capita spending and rapid urbanization are also likely to fuel the product demand in countries such as China, India, South Korea, Brazil, and South Africa.
Flavored sparkling water is increasingly preferred owing to its taste, fizziness, and health benefits. Key players are launching new products in the market following the demands of health-conscious consumers. For instance, in May 2021, PepsiCo launched the sparking water “Soulboost” in canned format. The 12oz can have 10-20 calories, which makes it a perfect drink for health-conscious consumers and is available in duo flavors and has added natural ingredients as well.
Get an overview of this study by requesting a free sample
The millennial and Gen Z population makes up the majority of today’s consumers of sparkling water. With their evident dominance in the marketplace, their preferences have largely influenced the broader direction of countless consumer-driven industries, particularly the food service sector. The current generation is increasingly health-conscious and opting for foods & beverages with nutritional benefits and lower sugar content. Thus, they are increasingly opting for natural sparkling water due to its several health benefits.
Unflavored sparkling water held a larger market share of more than 60% in 2021. The wide availability of unflavored sparkling water is the major factor driving the growth of this segment. Unflavored sparkling water is either naturally carbonated or artificial bubbles are added using carbon dioxide. Some of the popular brands of unflavored sparkling water include Gerolsteiner, S. Pellegrino, and Saint-Geron.
Flavored sparkling water is anticipated to register faster growth during the forecast period. The growing demand for flavored sparkling water owing to their taste is driving the segment’s growth. Further, growth launches in this category are expected to propel the growth. For instance, in May 2022, Dash Water, a UK-based company introduced mango-infused sparkling water. Similarly, in September 2022, Waterloo Sparkling Water introduced two new flavors Spiced Apple and Cranberry. Both the drinks are sugar and calorie-free, and made with Non-GMO Project Verified natural flavors and purified carbonated water.
Bottled sparkling water led the market in 2021 with a share of more than 45%. Convenient and easy portability for on-the-go consumption, along with low product price are major factors driving the demand for bottled sparkling water among consumers. Bottled sparkling water has been segmented into PET and glass bottles. PET bottles do not react with food or water, which makes them an appropriate packaging choice in the food & beverage industry. PET bottles consume less power during manufacturing and can easily be recycled after the first use. Additionally, as these are light in weight, thereby, these bottles save transportation costs for the manufacturers
Canned sparkling water is anticipated to register the fastest growth during the forecast period. Cans are lightweight and compact, which makes them a popular packaging choice. Young consumers prefer cans as they look more elegant and complement their style. Furthermore, the rising environmental concerns and easy recyclability of cans are also contributing to the growth of this segment. Innovation and improvisation are further expected to boost the segment’s growth.
The on-trade distribution channel is anticipated to register faster growth during the forecast period. This channel includes outlets such as bars, restaurants, cafes, clubs, and hotels. Most consumers like to drink sparkling water while socializing with friends, family, and colleagues. However, after the outbreak of the covid-19, sales through this channel decreased due to travel restrictions and the closure of bars, nightclubs, movie theaters, and others spaces to control the virus spread.
The off-trade accounted for a larger market share in 2021. The availability of domestic and international brands under one roof and easy comparison of products, is driving the purchase of sparkling water through hypermarkets and supermarkets. Consumers are also looking for immediate consumption of such products, therefore, prefer to buy sparkling water at these stores. Further, the demand through e-commerce platforms is also expected to boost the market owing to growing consumer preference for online shopping.
North America led the market, with a share of more than 30% in 2021. The region held the largest market share owing to the growing consumption of sparkling water as consumers consider it a healthy alternative to other carbonated drinks. Moreover, the presence of a large number of manufacturers in this region such as National Beverage Corp., The Coca-Cola Company, Manhattan Special, and Spindrift, is anticipated to further propel this market’s growth.
Moreover, an increasing number of product launches in the US is expected to propel the demand in North America. For instance, in February 2020, GOJAI launched GOJAI Organic Caffeinated Sparkling Water in three flavors: Orange, Lemon, and Grapefruit. The sparkling water range has zero calories and no sugar and is available online on Amazon.com and GOJAI.com and in selected grocery stores like Bristol Farms, Lunds and Byerlys, and Metropolitan Market.
In Europe, sparkling water sales are strong in several countries, such as Germany, the UK, Italy, Spain, France, and the Netherlands, where sparkling water is often served with meals in restaurants. As carbonated water gained popularity all over Europe, it became the norm for bottled water. Moreover, increasing consumer preference for sparking water while socializing is likely to create a positive outlook for sparking water in the coming years in this region.
Segments Covered in the Report
1. Introduction
1.1. Objectives of the Study
1.2. Market Definition
1.3. Research Scope
1.4. Currency
1.5. Key Target Audience
2. Research Methodology and Assumptions
3. Executive Summary
4. Premium Insights
4.1. Porter’s Five Forces Analysis
4.2. Value Chain Analysis
4.3. Top Investment Pockets
4.3.1. Market Attractiveness Analysis by Type
4.3.2. Market Attractiveness Analysis by Packaging
4.3.3. Market Attractiveness Analysis by Distribution Channel
4.3.4. Market Attractiveness Analysis by Region
4.4. Industry Trends
5. Market Dynamics
5.1. Market Evaluation
5.2. Drivers
5.2.1. The increasing awareness about sparkling water
5.3. Restraints
5.3.1. High cost of the product
5.4. Opportunities
5.4.1. Increase in per capita spending
6. Global Sparkling Water Market Analysis and Forecast, By Type
6.1. Segment Overview
6.2. Flavored
6.3. Unflavored
7. Global Sparkling Water Market Analysis and Forecast, By Packaging
7.1. Segment Overview
7.2. Bottled
7.3. Canned
7.4. Others
8. Global Sparkling Water Market Analysis and Forecast, By Distribution Channel
8.1. Segment Overview
8.2. B2C
8.2.1. Supermarkets & Hypermarkets
8.2.2. Online
8.2.3. Others
8.3. B2B
9. Global Sparkling Water Market Analysis and Forecast, By Regional Analysis
9.1. Segment Overview
9.2. North America
9.2.1. U.S.
9.2.2. Canada
9.2.3. Mexico
9.3. Europe
9.3.1. Germany
9.3.2. France
9.3.3. U.K.
9.3.4. Italy
9.3.5. Spain
9.4. Asia-Pacific
9.4.1. Japan
9.4.2. China
9.4.3. India
9.5. South America
9.5.1. Brazil
9.6. Middle East and Africa
9.6.1. UAE
9.6.2. South Africa
10. Global Sparkling Water Market-Competitive Landscape
10.1. Overview
10.2. Market Share of Key Players in the Sparkling Water Market
10.2.1. Global Company Market Share
10.2.2. North America Company Market Share
10.2.3. Europe Company Market Share
10.2.4. APAC Company Market Share
10.3. Competitive Situations and Trends
10.3.1. Product Launches and Developments
10.3.2. Partnerships, Collaborations, and Agreements
10.3.3. Mergers & Acquisitions
10.3.4. Expansions
11. Company Profiles
11.1. Nestlé
11.1.1. Business Overview
11.1.2. Company Snapshot
11.1.3. Company Market Share Analysis
11.1.4. Company Product Portfolio
11.1.5. Recent Developments
11.1.6. SWOT Analysis
11.2. PepsiCo
11.2.1. Business Overview
11.2.2. Company Snapshot
11.2.3. Company Market Share Analysis
11.2.4. Company Product Portfolio
11.2.5. Recent Developments
11.2.6. SWOT Analysis
11.3. Keurig Dr Pepper Inc.
11.3.1. Business Overview
11.3.2. Company Snapshot
11.3.3. Company Market Share Analysis
11.3.4. Company Product Portfolio
11.3.5. Recent Developments
11.3.6. SWOT Analysis
11.4. The Coca-Cola Company
11.4.1. Business Overview
11.4.2. Company Snapshot
11.4.3. Company Market Share Analysis
11.4.4. Company Product Portfolio
11.4.5. Recent Developments
11.4.6. SWOT Analysis
11.5. Danone
11.5.1. Business Overview
11.5.2. Company Snapshot
11.5.3. Company Market Share Analysis
11.5.4. Company Product Portfolio
11.5.5. Recent Developments
11.5.6. SWOT Analysis
11.6. National Beverage Corp.
11.6.1. Business Overview
11.6.2. Company Snapshot
11.6.3. Company Market Share Analysis
11.6.4. Company Product Portfolio
11.6.5. Recent Developments
11.6.6. SWOT Analysis
11.7. Talking Rain
11.7.1. Business Overview
11.7.2. Company Snapshot
11.7.3. Company Market Share Analysis
11.7.4. Company Product Portfolio
11.7.5. Recent Developments
11.7.6. SWOT Analysis
11.8. Polar Beverages
11.8.1. Business Overview
11.8.2. Company Snapshot
11.8.3. Company Market Share Analysis
11.8.4. Company Product Portfolio
11.8.5. Recent Developments
11.8.6. SWOT Analysis
11.9. GEROLSTEINER BRUNNEN GMBH & CO. KG
11.9.1. Business Overview
11.9.2. Company Snapshot
11.9.3. Company Market Share Analysis
11.9.4. Company Product Portfolio
11.9.5. Recent Developments
11.9.6. SWOT Analysis
11.10. CG Roxane, LLC
11.10.1. Business Overview
11.10.2. Company Snapshot
11.10.3. Company Market Share Analysis
11.10.4. Company Product Portfolio
11.10.5. Recent Developments
11.10.6. SWOT Analysis
11.11. Saratoga Spring Water Co.
11.11.1. Business Overview
11.11.2. Company Snapshot
11.11.3. Company Market Share Analysis
11.11.4. Company Product Portfolio
11.11.5. Recent Developments
11.11.6. SWOT Analysis
11.12. Spindrift Beverage Co.
11.12.1. Business Overview
11.12.2. Company Snapshot
11.12.3. Company Market Share Analysis
11.12.4. Company Product Portfolio
11.12.5. Recent Developments
11.12.6. SWOT Analysis
11.13. Waterloo Sparkling Water Corp.
11.13.1. Business Overview
11.13.2. Company Snapshot
11.13.3. Company Market Share Analysis
11.13.4. Company Product Portfolio
11.13.5. Recent Developments
11.13.6. SWOT Analysis
List of Table
1. Global Sparkling Water Market, By Type, 2019-2030 (USD Billion)
2. Global Flavored Sparkling Water Market, By Region, 2019-2030 (USD Billion)
3. Global Unflavored Sparkling Water Market, By Region, 2019-2030 (USD Billion)
4. Global Sparkling Water Market, By Packaging, 2019-2030 (USD Billion)
5. Global Bottled Sparkling Water Market, By Region, 2019-2030 (USD Billion)
6. Global Canned Sparkling Water Market, By Region, 2019-2030 (USD Billion)
7. Global Others Sparkling Water Market, By Region, 2019-2030 (USD Billion)
8. Global Sparkling Water Market, By Distribution Channel, 2019-2030 (USD Billion)
9. Global B2C Sparkling Water Market, By Region, 2019-2030 (USD Billion)
10. Global B2B Sparkling Water Market, By Region, 2019-2030 (USD Billion)
11. Global Sparkling Water Market, By Region, 2019-2030 (USD Billion)
12. North America Sparkling Water Market, By Type, 2019-2030 (USD Billion)
13. North America Sparkling Water Market, By Packaging, 2019-2030 (USD Billion)
14. North America Sparkling Water Market, By Distribution Channel, 2019-2030 (USD Billion)
15. U.S. Sparkling Water Market, By Type, 2019-2030 (USD Billion)
16. U.S. Sparkling Water Market, By Packaging, 2019-2030 (USD Billion)
17. U.S. Sparkling Water Market, By Distribution Channel, 2019-2030 (USD Billion)
18. Canada Sparkling Water Market, By Type, 2019-2030 (USD Billion)
19. Canada Sparkling Water Market, By Packaging, 2019-2030 (USD Billion)
20. Canada Sparkling Water Market, By Distribution Channel, 2019-2030 (USD Billion)
21. Mexico Sparkling Water Market, By Type, 2019-2030 (USD Billion)
22. Mexico Sparkling Water Market, By Packaging, 2019-2030 (USD Billion)
23. Mexico Sparkling Water Market, By Distribution Channel, 2019-2030 (USD Billion)
24. Europe Sparkling Water Market, By Type, 2019-2030 (USD Billion)
25. Europe Sparkling Water Market, By Packaging, 2019-2030 (USD Billion)
26. Europe Sparkling Water Market, By Distribution Channel, 2019-2030 (USD Billion)
27. Germany Sparkling Water Market, By Type, 2019-2030 (USD Billion)
28. Germany Sparkling Water Market, By Packaging, 2019-2030 (USD Billion)
29. Germany Sparkling Water Market, By Distribution Channel, 2019-2030 (USD Billion)
30. France Sparkling Water Market, By Type, 2019-2030 (USD Billion)
31. France Sparkling Water Market, By Packaging, 2019-2030 (USD Billion)
32. France Sparkling Water Market, By Distribution Channel, 2019-2030 (USD Billion)
33. U.K. Sparkling Water Market, By Type, 2019-2030 (USD Billion)
34. U.K. Sparkling Water Market, By Packaging, 2019-2030 (USD Billion)
35. U.K. Sparkling Water Market, By Distribution Channel, 2019-2030 (USD Billion)
36. Italy Sparkling Water Market, By Type, 2019-2030 (USD Billion)
37. Italy Sparkling Water Market, By Packaging, 2019-2030 (USD Billion)
38. Italy Sparkling Water Market, By Distribution Channel, 2019-2030 (USD Billion)
39. Spain Sparkling Water Market, By Type, 2019-2030 (USD Billion)
40. Spain Sparkling Water Market, By Packaging, 2019-2030 (USD Billion)
41. Spain Sparkling Water Market, By Distribution Channel, 2019-2030 (USD Billion)
42. Asia Pacific Sparkling Water Market, By Type, 2019-2030 (USD Billion)
43. Asia Pacific Sparkling Water Market, By Packaging, 2019-2030 (USD Billion)
44. Asia Pacific Sparkling Water Market, By Distribution Channel, 2019-2030 (USD Billion)
45. Japan Sparkling Water Market, By Type, 2019-2030 (USD Billion)
46. Japan Sparkling Water Market, By Packaging, 2019-2030 (USD Billion)
47. Japan Sparkling Water Market, By Distribution Channel, 2019-2030 (USD Billion)
48. China Sparkling Water Market, By Type, 2019-2030 (USD Billion)
49. China Sparkling Water Market, By Packaging, 2019-2030 (USD Billion)
50. China Sparkling Water Market, By Distribution Channel, 2019-2030 (USD Billion)
51. India Sparkling Water Market, By Type, 2019-2030 (USD Billion)
52. India Sparkling Water Market, By Packaging, 2019-2030 (USD Billion)
53. India Sparkling Water Market, By Distribution Channel, 2019-2030 (USD Billion)
54. South America Sparkling Water Market, By Type, 2019-2030 (USD Billion)
55. South America Sparkling Water Market, By Packaging, 2019-2030 (USD Billion)
56. South America Sparkling Water Market, By Distribution Channel, 2019-2030 (USD Billion)
57. Brazil Sparkling Water Market, By Type, 2019-2030 (USD Billion)
58. Brazil Sparkling Water Market, By Packaging, 2019-2030 (USD Billion)
59. Brazil Sparkling Water Market, By Distribution Channel, 2019-2030 (USD Billion)
60. Middle East and Africa Sparkling Water Market, By Type, 2019-2030 (USD Billion)
61. Middle East and Africa Sparkling Water Market, By Packaging, 2019-2030 (USD Billion)
62. Middle East and Africa Sparkling Water Market, By Distribution Channel, 2019-2030 (USD Billion)
63. UAE Sparkling Water Market, By Type, 2019-2030 (USD Billion)
64. UAE Sparkling Water Market, By Packaging, 2019-2030 (USD Billion)
65. UAE Sparkling Water Market, By Distribution Channel, 2019-2030 (USD Billion)
66. South Africa Sparkling Water Market, By Type, 2019-2030 (USD Billion)
67. South Africa Sparkling Water Market, By Packaging, 2019-2030 (USD Billion)
68. South Africa Sparkling Water Market, By Distribution Channel, 2019-2030 (USD Billion)
List of Figures
1. Global Sparkling Water Market Segmentation
2. Sparkling Water Market: Research Methodology
3. Market Size Estimation Methodology: Bottom-Up Approach
4. Market Size Estimation Methodology: Top-Down Approach
5. Data Triangulation
6. Porter’s Five Forces Analysis
7. Value Chain Analysis
8. Global Sparkling Water Market Attractiveness Analysis by Type
9. Global Sparkling Water Market Attractiveness Analysis by Packaging
10. Global Sparkling Water Market Attractiveness Analysis by Distribution Channel
11. Global Sparkling Water Market Attractiveness Analysis by Region
12. Global Sparkling Water Market: Dynamics
13. Global Sparkling Water Market Share by Type (2022 & 2030)
14. Global Sparkling Water Market Share by Packaging (2022 & 2030)
15. Global Sparkling Water Market Share by Distribution Channel (2022 & 2030)
16. Global Sparkling Water Market Share by Regions (2022 & 2030)
17. Global Sparkling Water Market Share by Company (2021)
Segments Covered in the Report
Research has its special purpose to undertake marketing efficiently. In this competitive scenario, businesses need information across all industry verticals; the information about customer wants, market demand, competition, industry trends, distribution channels etc. This information needs to be updated regularly because businesses operate in a dynamic environment. Our organization, The Brainy Insights incorporates scientific and systematic research procedures in order to get proper market insights and industry analysis for overall business success. The analysis consists of studying the market from a miniscule level wherein we implement statistical tools which helps us in examining the data with accuracy and precision.
Our research reports feature both; quantitative and qualitative aspects for any market. Qualitative information for any market research process are fundamental because they reveal the customer needs and wants, usage and consumption for any product/service related to a specific industry. This in turn aids the marketers/investors in knowing certain perceptions of the customers. Qualitative research can enlighten about the different product concepts and designs along with unique service offering that in turn, helps define marketing problems and generate opportunities. On the other hand, quantitative research engages with the data collection process through interviews, e-mail interactions, surveys and pilot studies. Quantitative aspects for the market research are useful to validate the hypotheses generated during qualitative research method, explore empirical patterns in the data with the help of statistical tools, and finally make the market estimations.
The Brainy Insights offers comprehensive research and analysis, based on a wide assortment of factual insights gained through interviews with CXOs and global experts and secondary data from reliable sources. Our analysts and industry specialist assume vital roles in building up statistical tools and analysis models, which are used to analyse the data and arrive at accurate insights with exceedingly informative research discoveries. The data provided by our organization have proven precious to a diverse range of companies, facilitating them to address issues such as determining which products/services are the most appealing, whether or not customers use the product in the manner anticipated, the purchasing intentions of the market and many others.
Our research methodology encompasses an idyllic combination of primary and secondary initiatives. Key phases involved in this process are listed below:

The phase involves the gathering and collecting of market data and its related information with the help of different sources & research procedures.

The data procurement stage involves in data gathering and collecting through various data sources.
This stage involves in extensive research. These data sources includes:
Purchased Database: Purchased databases play a crucial role in estimating the market sizes irrespective of the domain. Our purchased database includes:
Primary Research: The Brainy Insights interacts with leading companies and experts of the concerned domain to develop the analyst team’s market understanding and expertise. It improves and substantiates every single data presented in the market reports. Primary research mainly involves in telephonic interviews, E-mail interactions and face-to-face interviews with the raw material providers, manufacturers/producers, distributors, & independent consultants. The interviews that we conduct provides valuable data on market size and industry growth trends prevailing in the market. Our organization also conducts surveys with the various industry experts in order to gain overall insights of the industry/market. For instance, in healthcare industry we conduct surveys with the pharmacists, doctors, surgeons and nurses in order to gain insights and key information of a medical product/device/equipment which the customers are going to usage. Surveys are conducted in the form of questionnaire designed by our own analyst team. Surveys plays an important role in primary research because surveys helps us to identify the key target audiences of the market. Additionally, surveys helps to identify the key target audience engaged with the market. Our survey team conducts the survey by targeting the key audience, thus gaining insights from them. Based on the perspectives of the customers, this information is utilized to formulate market strategies. Moreover, market surveys helps us to understand the current competitive situation of the industry. To be precise, our survey process typically involve with the 360 analysis of the market. This analytical process begins by identifying the prospective customers for a product or service related to the market/industry to obtain data on how a product/service could fit into customers’ lives.

Secondary Research: The secondary data sources includes information published by the on-profit organizations such as World bank, WHO, company fillings, investor presentations, annual reports, national government documents, statistical databases, blogs, articles, white papers and others. From the annual report, we analyse a company’s revenue to understand the key segment and market share of that organization in a particular region. We analyse the company websites and adopt the product mapping technique which is important for deriving the segment revenue. In the product mapping method, we select and categorize the products offered by the companies catering to domain specific market, deduce the product revenue for each of the companies so as to get overall estimation of the market size. We also source data and analyses trends based on information received from supply side and demand side intermediaries in the value chain. The supply side denotes the data gathered from supplier, distributor, wholesaler and the demand side illustrates the data gathered from the end customers for respective market domain.

The supply side for a domain specific market is analysed by:
The demand side for the market is estimated through:
In-house Library: Apart from these third-party sources, we have our in-house library of qualitative and quantitative information. Our in-house database includes market data for various industry and domains. These data are updated on regular basis as per the changing market scenario. Our library includes, historic databases, internal audit reports and archives.
Sometimes there are instances where there is no metadata or raw data available for any domain specific market. For those cases, we use our expertise to forecast and estimate the market size in order to generate comprehensive data sets. Our analyst team adopt a robust research technique in order to produce the estimates:
Data Synthesis: This stage involves the analysis & mapping of all the information obtained from the previous step. It also involves in scrutinizing the data for any discrepancy observed while data gathering related to the market. The data is collected with consideration to the heterogeneity of sources. Robust scientific techniques are in place for synthesizing disparate data sets and provide the essential contextual information that can orient market strategies. The Brainy Insights has extensive experience in data synthesis where the data passes through various stages:


Market Deduction & Formulation: The final stage comprises of assigning data points at appropriate market spaces so as to deduce feasible conclusions. Analyst perspective & subject matter expert based holistic form of market sizing coupled with industry analysis also plays a crucial role in this stage.
This stage involves in finalization of the market size and numbers that we have collected from data integration step. With data interpolation, it is made sure that there is no gap in the market data. Successful trend analysis is done by our analysts using extrapolation techniques, which provide the best possible forecasts for the market.
Data Validation & Market Feedback: Validation is the most important step in the process. Validation & re-validation via an intricately designed process helps us finalize data-points to be used for final calculations.

The Brainy Insights interacts with leading companies and experts of the concerned domain to develop the analyst team’s market understanding and expertise. It improves and substantiates every single data presented in the market reports. The data validation interview and discussion panels are typically composed of the most experienced industry members. The participants include, however, are not limited to:
Moreover, we always validate our data and findings through primary respondents from all the major regions we are working on.


Free Customization
Fortune 500 Clients
Free Yearly Update On Purchase Of Multi/Corporate License
Companies Served Till Date