- +1-315-215-1633
- sales@thebrainyinsights.com

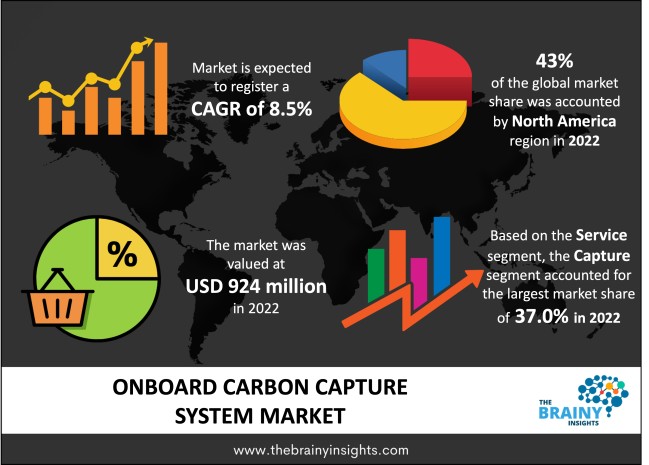
The global onboard carbon capture system market is expected to reach USD 2089.1 million by 2032, at a CAGR of 8.5% during the forecast period 2023 to 2032. Asia Pacific is expected to grow the fastest during the forecast period.
Rapid deployment of onboard carbon capture systems in the maritime sector is a significant factor driving market revenue growth due to the emphasis on reducing Greenhouse Gas (GHG) emissions. The Onboard Carbon Capture (OCC) system is a new device that combines energy efficiency and alternative fuels to provide a circular answer for reducing maritime CO2 emissions. According to the United Nations Conference on Trade and Development (UNCTAD), the global maritime industry relies heavily on fossil fuels. It emits approximately 1.2 gigatonnes of carbon dioxide equivalents (CO2e), accounting for roughly 3% of global GHG emissions. Globally, many maritime businesses are implementing OCC systems to reduce GHG emissions by at least half by 2050. The International Maritime Organization (IMO) has challenged the global shipping sector to cut annual greenhouse gas emissions in half by 2050. Investment and funding for installing onboard carbon capture systems are rapidly increasing market revenue development. OCC system manufacturers are securing investment bank funds to accelerate the development of onboard carbon capture initiatives. For example, Gaztransport & Technigaz SA (GTT), a French naval engineering and LNG containment expert received USD 5.08 million in financing from the French investment bank Bpifrance as part of the MerVent 2025 project.
Get an overview of this study by requesting a free sample
Government Initiatives- Various governments have implemented stringent action plans to stabilize climate change and reduce overall carbon emissions in the short and long run. Stern activities to monitor and reduce greenhouse gas emissions from power generation sites are expected to supplement market size. As a result, the International Energy Agency (IEA) reported in February 2020 that global energy-related CO2 emissions increased to 33.3 gigatonnes (Gt) in 2019 from 32.2 Gt in 2015, representing a 3.4% rise in just five years.
High Cost- The high capital required to set up large-scale carbon capture systems may hinder market development. Furthermore, significant annual operational expenses are required for the projects to operate systems optimally. In addition, the feasibility of high-capacity plants capable of capturing multiple MTPA of CO2 limits technology adoption in different countries.
Rising Usage of Oil- Enhanced oil recovery (EOR) is a tertiary oil recovery technique used to recover more than 65% of the total recoverable oil in place that was not produced during the primary and secondary stages. In June 2020, for example, the Alberta Carbon Trunk Line (ACTL) system CCUS project in Canada went live to capture harmful carbon dioxide from industrial facilities, use the gas for permanent storage, and improve oil recovery.
CO2 Leakage- Manufacturing costs, process management, and the chance of carbon dioxide (CO2) leakage are significant factors limiting market development. Onboard carbon capture systems involve various equipment, technologies, and process management processes. Complicated methodologies and process management require significant investments in process equipment such as combustion turbines, classifiers, air separation, and steam turbines to absorb and store CO2, stifling market development.
The regions analyzed for the market include North America, Europe, South America, Asia Pacific, the Middle East, and Africa. North America emerged as the most significant global onboard carbon capture system market, with a 43% market revenue share in 2022.
North America dominates the onboard carbon capture system market with a 43% market revenue share in 2022. Government interest in reducing carbon emissions and supporting renewable energy production and development is driving the growth of the North American onboard carbon capture system market. The United States and Canada are two significant countries widely implementing carbon management technology. The US government sanctioned USD 369 billion to handle climate change in August 2022 and is providing USD 280 billion in new clean energy tax credits. Furthermore, the US Department of Energy (DOE) invested USD 131 million in 33 research and development projects to increase the general adoption of carbon management technology to reduce CO2 emissions.
Asia Pacific is expected to witness the fastest growth during the forecast period. Technological collaborations in installing carbon capture and storage in onboard maritime vessels assist market development in this region. Major shipbuilding companies in Asia Pacific are collaborating with onboard carbon capture system providers to accelerate installation project development. For example, in September 2022, Samsung Heavy Industries Co., Ltd. collaborated with BASF SE to develop, engineer, and build the onboard carbon capture unit. This cooperation aligns with the International Maritime Organization's (IMO) goal of reducing international shipping's carbon intensity by at least 40% by 2030. Furthermore, ships' rapid installation of onboard carbon capture systems propels market development.
North America Region Onboard Carbon Capture System Market Share in 2022 - 43%
www.thebrainyinsights.com
Check the geographical analysis of this market by requesting a free sample
The service segment is divided into capture, utilization, transportation, and storage. The capture segment dominated the market, with a share of around 37.0% in 2022. Carbon capture is essential for ensuring a safe and stable climate by accelerating the global transition to zero greenhouse gas emissions. Carbon captured from the atmosphere includes that generated by offshore transportation activity. Various governments are widely implementing carbon capture systems to accelerate progress towards the goal of net-zero emissions by 2050. Several maritime businesses are implementing these technologies, fuelling the segment's growth.
The technology segment is divided into oxy-fuel combustion capture, pre-combustion capture, and post-combustion capture. The post-combustion capture segment dominated the market, with a market share of around 35% in 2022. Post-combustion capture is the separation of CO2 from flue gas generated from combusting fossil fuels - coal, natural gas, or oil - in the air. Due to population expansion, industrialization, and urbanization, power consumption has increased significantly in developing economies such as China and India. In China, coal-generated electricity accounted for 4,732 TWh in 2018, up from 4,445 TWh the previous year. Coal electricity generation accounts for 66% of China's total energy mix.
The end-user segment is divided into oil & gas, iron & steel, power generation, chemical & petrochemical, cement, and others. The oil & gas segment dominated the market, with a share of around 34% in 2022. Carbon capture and storage are extensively used in ships and maritime sectors to reduce CO2 emissions. Carbon capture and storage are being used in ships to improve hydrocarbon recovery. Carbon Capture and Storage (CCS) aids in the recovery of oil from oil fields by modifying the initial properties of the oil via capturing techniques such as chemical flooding, carbon dioxide injection, or thermal recovery. Primary shipping and maritime businesses worldwide are focusing on oil recovery from operations, accelerating the growth of this segment.
| Attribute | Description |
|---|---|
| Market Size | Revenue (USD Billion) |
| Market size value in 2022 | USD 924 million |
| Market size value in 2032 | USD 2089.1 million |
| CAGR (2023 to 2032) | 8.5% |
| Historical data | 2019-2021 |
| Base Year | 2022 |
| Forecast | 2023-2032 |
| Regional Segments | North America, Asia Pacific, Europe, Latin America, Middle East and Africa |
| Segments | Service, Technology, End-User |
As per The Brainy Insights, the size of the onboard carbon capture system market was valued at USD 924 million in 2022 to USD 2,089.1 million by 2032.
The global onboard carbon capture system market is growing at a CAGR of 8.5% during the forecast period 2023-2032.
North America emerged as the largest onboard carbon capture system market.
1. Introduction
1.1. Objectives of the Study
1.2. Market Definition
1.3. Research Scope
1.4. Currency
1.5. Key Target Audience
2. Research Methodology and Assumptions
3. Executive Summary
4. Premium Insights
4.1. Porter’s Five Forces Analysis
4.2. Value Chain Analysis
4.3. Top Investment Pockets
4.3.1. Market Attractiveness Analysis by Service
4.3.2. Market Attractiveness Analysis by Technology
4.3.3. Market Attractiveness Analysis by End-User
4.3.4. Market Attractiveness Analysis by Region
4.4. Industry Trends
5. Market Dynamics
5.1. Market Evaluation
5.2. Drivers
5.2.1. Government Initiatives
5.3. Restraints
5.3.1. High Cost
5.4. Opportunities
5.4.1. Rising Usage of Oil
5.5. Challenges
5.5.1. CO2 Leakage
6. Global Onboard Carbon Capture System Market Analysis and Forecast, By Service
6.1. Segment Overview
6.2. Capture
6.3. Utilization
6.4. Transportation
6.5. Storage
7. Global Onboard Carbon Capture System Market Analysis and Forecast, By Technology
7.1. Segment Overview
7.2. Oxy-Fuel Combustion Capture
7.3. Pre-Combustion Capture
7.4. Post-Combustion Capture
8. Global Onboard Carbon Capture System Market Analysis and Forecast, By End-User
8.1. Segment Overview
8.2. Oil & Gas
8.3. Iron & Steel
8.4. Power Generation
8.5. Chemical & Petrochemical
8.6. Cement
8.7. Others
9. Global Onboard Carbon Capture System Market Analysis and Forecast, By Regional Analysis
9.1. Segment Overview
9.2. North America
9.2.1. U.S.
9.2.2. Canada
9.2.3. Mexico
9.3. Europe
9.3.1. Germany
9.3.2. France
9.3.3. U.K.
9.3.4. Italy
9.3.5. Spain
9.4. Asia-Pacific
9.4.1. Japan
9.4.2. China
9.4.3. India
9.5. South America
9.5.1. Brazil
9.6. Middle East and Africa
9.6.1. UAE
9.6.2. South Africa
10. Global Onboard Carbon Capture System Market-Competitive Landscape
10.1. Overview
10.2. Market Share of Key Players in Global Onboard Carbon Capture System Market
10.2.1. Global Company Market Share
10.2.2. North America Company Market Share
10.2.3. Europe Company Market Share
10.2.4. APAC Company Market Share
10.3. Competitive Situations and Trends
10.3.1. Product Launches and Developments
10.3.2. Partnerships, Collaborations, and Agreements
10.3.3. Mergers & Acquisitions
10.3.4. Expansions
11. Company Profiles
11.1. Alfa Laval AB
11.1.1. Business Overview
11.1.2. Company Snapshot
11.1.3. Company Market Share Analysis
11.1.4. Company Product Portfolio
11.1.5. Recent Developments
11.1.6. SWOT Analysis
11.2. MAN Energy Solutions
11.2.1. Business Overview
11.2.2. Company Snapshot
11.2.3. Company Market Share Analysis
11.2.4. Company Product Portfolio
11.2.5. Recent Developments
11.2.6. SWOT Analysis
11.3. Gaztransport & Technigaz SA (GTT)
11.3.1. Business Overview
11.3.2. Company Snapshot
11.3.3. Company Market Share Analysis
11.3.4. Company Product Portfolio
11.3.5. Recent Developments
11.3.6. SWOT Analysis
11.4. Wärtsilä Corporation
11.4.1. Business Overview
11.4.2. Company Snapshot
11.4.3. Company Market Share Analysis
11.4.4. Company Product Portfolio
11.4.5. Recent Developments
11.4.6. SWOT Analysis
11.5. Panasia Co, Ltd.
11.5.1. Business Overview
11.5.2. Company Snapshot
11.5.3. Company Market Share Analysis
11.5.4. Company Product Portfolio
11.5.5. Recent Developments
11.5.6. SWOT Analysis
11.6. Aker Carbon Capture ASA
11.6.1. Business Overview
11.6.2. Company Snapshot
11.6.3. Company Market Share Analysis
11.6.4. Company Product Portfolio
11.6.5. Recent Developments
11.6.6. SWOT Analysis
11.7. BASF SE
11.7.1. Business Overview
11.7.2. Company Snapshot
11.7.3. Company Market Share Analysis
11.7.4. Company Product Portfolio
11.7.5. Recent Developments
11.7.6. SWOT Analysis
11.8. Samsung Heavy Industries (SHI) Co., Ltd.
11.8.1. Business Overview
11.8.2. Company Snapshot
11.8.3. Company Market Share Analysis
11.8.4. Company Product Portfolio
11.8.5. Recent Developments
11.8.6. SWOT Analysis
11.9. Carbon Engineering Ltd.
11.9.1. Business Overview
11.9.2. Company Snapshot
11.9.3. Company Market Share Analysis
11.9.4. Company Product Portfolio
11.9.5. Recent Developments
11.9.6. SWOT Analysis
11.10. Saudi Arabian Oil Co. (Aramco)
11.10.1. Business Overview
11.10.2. Company Snapshot
11.10.3. Company Market Share Analysis
11.10.4. Company Product Portfolio
11.10.5. Recent Developments
11.10.6. SWOT Analysis
11.11. Lanza Tech, Inc.
11.11.1. Business Overview
11.11.2. Company Snapshot
11.11.3. Company Market Share Analysis
11.11.4. Company Product Portfolio
11.11.5. Recent Developments
11.11.6. SWOT Analysis
11.12. VICI International
11.12.1. Business Overview
11.12.2. Company Snapshot
11.12.3. Company Market Share Analysis
11.12.4. Company Product Portfolio
11.12.5. Recent Developments
11.12.6. SWOT Analysis
11.13. CO2 Capsol AS
11.13.1. Business Overview
11.13.2. Company Snapshot
11.13.3. Company Market Share Analysis
11.13.4. Company Product Portfolio
11.13.5. Recent Developments
11.13.6. SWOT Analysis
List of Table
1. Global Onboard Carbon Capture System Market, By Service, 2019-2032 (USD Million)
2. Global Capture, Onboard Carbon Capture System Market, By Region, 2019-2032 (USD Million)
3. Global Utilization, Onboard Carbon Capture System Market, By Region, 2019-2032 (USD Million)
4. Global Transportation, Onboard Carbon Capture System Market, By Region, 2019-2032 (USD Million)
5. Global Storage, Onboard Carbon Capture System Market, By Region, 2019-2032 (USD Million)
6. Global Onboard Carbon Capture System Market, By Technology, 2019-2032 (USD Million)
7. Global Oxy-Fuel Combustion Capture, Onboard Carbon Capture System Market, By Region, 2019-2032 (USD Million)
8. Global Pre-Combustion Capture, Onboard Carbon Capture System Market, By Region, 2019-2032 (USD Million)
9. Global Post-Combustion Capture, Onboard Carbon Capture System Market, By Region, 2019-2032 (USD Million)
10. Global Onboard Carbon Capture System Market, By End-User, 2019-2032 (USD Million)
11. Global Oil & Gas, Onboard Carbon Capture System Market, By Region, 2019-2032 (USD Million)
12. Global Iron & Steel, Onboard Carbon Capture System Market, By Region, 2019-2032 (USD Million)
13. Global Power Generation, Onboard Carbon Capture System Market, By Region, 2019-2032 (USD Million)
14. Global Chemical & Petrochemical, Onboard Carbon Capture System Market, By Region, 2019-2032 (USD Million)
15. Global Cement, Onboard Carbon Capture System Market, By Region, 2019-2032 (USD Million)
16. Global Others, Onboard Carbon Capture System Market, By Region, 2019-2032 (USD Million)
17. North America Onboard Carbon Capture System Market, By Service, 2019-2032 (USD Million)
18. North America Onboard Carbon Capture System Market, By Technology, 2019-2032 (USD Million)
19. North America Onboard Carbon Capture System Market, By End-User, 2019-2032 (USD Million)
20. U.S. Onboard Carbon Capture System Market, By Service, 2019-2032 (USD Million)
21. U.S. Onboard Carbon Capture System Market, By Technology, 2019-2032 (USD Million)
22. U.S. Onboard Carbon Capture System Market, By End-User, 2019-2032 (USD Million)
23. Canada Onboard Carbon Capture System Market, By Service, 2019-2032 (USD Million)
24. Canada Onboard Carbon Capture System Market, By Technology, 2019-2032 (USD Million)
25. Canada Onboard Carbon Capture System Market, By End-User, 2019-2032 (USD Million)
26. Mexico Onboard Carbon Capture System Market, By Service, 2019-2032 (USD Million)
27. Mexico Onboard Carbon Capture System Market, By Technology, 2019-2032 (USD Million)
28. Mexico Onboard Carbon Capture System Market, By End-User, 2019-2032 (USD Million)
29. Europe Onboard Carbon Capture System Market, By Service, 2019-2032 (USD Million)
30. Europe Onboard Carbon Capture System Market, By Technology, 2019-2032 (USD Million)
31. Europe Onboard Carbon Capture System Market, By End-User, 2019-2032 (USD Million)
32. Germany Onboard Carbon Capture System Market, By Service, 2019-2032 (USD Million)
33. Germany Onboard Carbon Capture System Market, By Technology, 2019-2032 (USD Million)
34. Germany Onboard Carbon Capture System Market, By End-User, 2019-2032 (USD Million)
35. France Onboard Carbon Capture System Market, By Service, 2019-2032 (USD Million)
36. France Onboard Carbon Capture System Market, By Technology, 2019-2032 (USD Million)
37. France Onboard Carbon Capture System Market, By End-User, 2019-2032 (USD Million)
38. U.K. Onboard Carbon Capture System Market, By Service, 2019-2032 (USD Million)
39. U.K. Onboard Carbon Capture System Market, By Technology, 2019-2032 (USD Million)
40. U.K. Onboard Carbon Capture System Market, By End-User, 2019-2032 (USD Million)
41. Italy Onboard Carbon Capture System Market, By Service, 2019-2032 (USD Million)
42. Italy Onboard Carbon Capture System Market, By Technology, 2019-2032 (USD Million)
43. Italy Onboard Carbon Capture System Market, By End-User, 2019-2032 (USD Million)
44. Spain Onboard Carbon Capture System Market, By Service, 2019-2032 (USD Million)
45. Spain Onboard Carbon Capture System Market, By Technology, 2019-2032 (USD Million)
46. Spain Onboard Carbon Capture System Market, By End-User, 2019-2032 (USD Million)
47. Asia Pacific Onboard Carbon Capture System Market, By Service, 2019-2032 (USD Million)
48. Asia Pacific Onboard Carbon Capture System Market, By Technology, 2019-2032 (USD Million)
49. Asia Pacific Onboard Carbon Capture System Market, By End-User, 2019-2032 (USD Million)
50. Japan Onboard Carbon Capture System Market, By Service, 2019-2032 (USD Million)
51. Japan Onboard Carbon Capture System Market, By Technology, 2019-2032 (USD Million)
52. Japan Onboard Carbon Capture System Market, By End-User, 2019-2032 (USD Million)
53. China Onboard Carbon Capture System Market, By Service, 2019-2032 (USD Million)
54. China Onboard Carbon Capture System Market, By Technology, 2019-2032 (USD Million)
55. China Onboard Carbon Capture System Market, By End-User, 2019-2032 (USD Million)
56. India Onboard Carbon Capture System Market, By Service, 2019-2032 (USD Million)
57. India Onboard Carbon Capture System Market, By Technology, 2019-2032 (USD Million)
58. India Onboard Carbon Capture System Market, By End-User, 2019-2032 (USD Million)
59. South America Onboard Carbon Capture System Market, By Service, 2019-2032 (USD Million)
60. South America Onboard Carbon Capture System Market, By Technology, 2019-2032 (USD Million)
61. South America Onboard Carbon Capture System Market, By End-User, 2019-2032 (USD Million)
62. Brazil Onboard Carbon Capture System Market, By Service, 2019-2032 (USD Million)
63. Brazil Onboard Carbon Capture System Market, By Technology, 2019-2032 (USD Million)
64. Brazil Onboard Carbon Capture System Market, By End-User, 2019-2032 (USD Million)
65. Middle East and Africa Onboard Carbon Capture System Market, By Service, 2019-2032 (USD Million)
66. Middle East and Africa Onboard Carbon Capture System Market, By Technology, 2019-2032 (USD Million)
67. Middle East and Africa Onboard Carbon Capture System Market, By End-User, 2019-2032 (USD Million)
68. UAE Onboard Carbon Capture System Market, By Service, 2019-2032 (USD Million)
69. UAE Onboard Carbon Capture System Market, By Technology, 2019-2032 (USD Million)
70. UAE Onboard Carbon Capture System Market, By End-User, 2019-2032 (USD Million)
71. South Africa Onboard Carbon Capture System Market, By Service, 2019-2032 (USD Million)
72. South Africa Onboard Carbon Capture System Market, By Technology, 2019-2032 (USD Million)
73. South Africa Onboard Carbon Capture System Market, By End-User, 2019-2032 (USD Million)
List of Figures
1. Global Onboard Carbon Capture System Market Segmentation
2. Global Onboard Carbon Capture System Market: Research Methodology
3. Market Size Estimation Methodology: Bottom-Up Approach
4. Market Size Estimation Methodology: Top-Down Approach
5. Data Triangulation
6. Porter’s Five Forces Analysis
7. Value Chain Analysis
8. Global Onboard Carbon Capture System Market Attractiveness Analysis by Service
9. Global Onboard Carbon Capture System Market Attractiveness Analysis by Technology
10. Global Onboard Carbon Capture System Market Attractiveness Analysis by End-User
11. Global Onboard Carbon Capture System Market Attractiveness Analysis by Region
12. Global Onboard Carbon Capture System Market: Dynamics
13. Global Onboard Carbon Capture System Market Share by Service (2023 & 2032)
14. Global Onboard Carbon Capture System Market Share by Technology (2023 & 2032)
15. Global Onboard Carbon Capture System Market Share by End-User (2023 & 2032)
16. Global Onboard Carbon Capture System Market Share by Regions (2023 & 2032)
17. Global Onboard Carbon Capture System Market Share by Company (2022)
This study forecasts global, regional, and country revenue from 2019 to 2032. The Brainy Insights has segmented the global onboard carbon capture system market based on the below-mentioned segments:
Global Onboard Carbon Capture System Market By Service:
Global Onboard Carbon Capture System Market By Technology:
Global Onboard Carbon Capture System Market By End-User:
Global Onboard Carbon Capture System Market By Region:
Research has its special purpose to undertake marketing efficiently. In this competitive scenario, businesses need information across all industry verticals; the information about customer wants, market demand, competition, industry trends, distribution channels etc. This information needs to be updated regularly because businesses operate in a dynamic environment. Our organization, The Brainy Insights incorporates scientific and systematic research procedures in order to get proper market insights and industry analysis for overall business success. The analysis consists of studying the market from a miniscule level wherein we implement statistical tools which helps us in examining the data with accuracy and precision.
Our research reports feature both; quantitative and qualitative aspects for any market. Qualitative information for any market research process are fundamental because they reveal the customer needs and wants, usage and consumption for any product/service related to a specific industry. This in turn aids the marketers/investors in knowing certain perceptions of the customers. Qualitative research can enlighten about the different product concepts and designs along with unique service offering that in turn, helps define marketing problems and generate opportunities. On the other hand, quantitative research engages with the data collection process through interviews, e-mail interactions, surveys and pilot studies. Quantitative aspects for the market research are useful to validate the hypotheses generated during qualitative research method, explore empirical patterns in the data with the help of statistical tools, and finally make the market estimations.
The Brainy Insights offers comprehensive research and analysis, based on a wide assortment of factual insights gained through interviews with CXOs and global experts and secondary data from reliable sources. Our analysts and industry specialist assume vital roles in building up statistical tools and analysis models, which are used to analyse the data and arrive at accurate insights with exceedingly informative research discoveries. The data provided by our organization have proven precious to a diverse range of companies, facilitating them to address issues such as determining which products/services are the most appealing, whether or not customers use the product in the manner anticipated, the purchasing intentions of the market and many others.
Our research methodology encompasses an idyllic combination of primary and secondary initiatives. Key phases involved in this process are listed below:

The phase involves the gathering and collecting of market data and its related information with the help of different sources & research procedures.

The data procurement stage involves in data gathering and collecting through various data sources.
This stage involves in extensive research. These data sources includes:
Purchased Database: Purchased databases play a crucial role in estimating the market sizes irrespective of the domain. Our purchased database includes:
Primary Research: The Brainy Insights interacts with leading companies and experts of the concerned domain to develop the analyst team’s market understanding and expertise. It improves and substantiates every single data presented in the market reports. Primary research mainly involves in telephonic interviews, E-mail interactions and face-to-face interviews with the raw material providers, manufacturers/producers, distributors, & independent consultants. The interviews that we conduct provides valuable data on market size and industry growth trends prevailing in the market. Our organization also conducts surveys with the various industry experts in order to gain overall insights of the industry/market. For instance, in healthcare industry we conduct surveys with the pharmacists, doctors, surgeons and nurses in order to gain insights and key information of a medical product/device/equipment which the customers are going to usage. Surveys are conducted in the form of questionnaire designed by our own analyst team. Surveys plays an important role in primary research because surveys helps us to identify the key target audiences of the market. Additionally, surveys helps to identify the key target audience engaged with the market. Our survey team conducts the survey by targeting the key audience, thus gaining insights from them. Based on the perspectives of the customers, this information is utilized to formulate market strategies. Moreover, market surveys helps us to understand the current competitive situation of the industry. To be precise, our survey process typically involve with the 360 analysis of the market. This analytical process begins by identifying the prospective customers for a product or service related to the market/industry to obtain data on how a product/service could fit into customers’ lives.

Secondary Research: The secondary data sources includes information published by the on-profit organizations such as World bank, WHO, company fillings, investor presentations, annual reports, national government documents, statistical databases, blogs, articles, white papers and others. From the annual report, we analyse a company’s revenue to understand the key segment and market share of that organization in a particular region. We analyse the company websites and adopt the product mapping technique which is important for deriving the segment revenue. In the product mapping method, we select and categorize the products offered by the companies catering to domain specific market, deduce the product revenue for each of the companies so as to get overall estimation of the market size. We also source data and analyses trends based on information received from supply side and demand side intermediaries in the value chain. The supply side denotes the data gathered from supplier, distributor, wholesaler and the demand side illustrates the data gathered from the end customers for respective market domain.

The supply side for a domain specific market is analysed by:
The demand side for the market is estimated through:
In-house Library: Apart from these third-party sources, we have our in-house library of qualitative and quantitative information. Our in-house database includes market data for various industry and domains. These data are updated on regular basis as per the changing market scenario. Our library includes, historic databases, internal audit reports and archives.
Sometimes there are instances where there is no metadata or raw data available for any domain specific market. For those cases, we use our expertise to forecast and estimate the market size in order to generate comprehensive data sets. Our analyst team adopt a robust research technique in order to produce the estimates:
Data Synthesis: This stage involves the analysis & mapping of all the information obtained from the previous step. It also involves in scrutinizing the data for any discrepancy observed while data gathering related to the market. The data is collected with consideration to the heterogeneity of sources. Robust scientific techniques are in place for synthesizing disparate data sets and provide the essential contextual information that can orient market strategies. The Brainy Insights has extensive experience in data synthesis where the data passes through various stages:


Market Deduction & Formulation: The final stage comprises of assigning data points at appropriate market spaces so as to deduce feasible conclusions. Analyst perspective & subject matter expert based holistic form of market sizing coupled with industry analysis also plays a crucial role in this stage.
This stage involves in finalization of the market size and numbers that we have collected from data integration step. With data interpolation, it is made sure that there is no gap in the market data. Successful trend analysis is done by our analysts using extrapolation techniques, which provide the best possible forecasts for the market.
Data Validation & Market Feedback: Validation is the most important step in the process. Validation & re-validation via an intricately designed process helps us finalize data-points to be used for final calculations.

The Brainy Insights interacts with leading companies and experts of the concerned domain to develop the analyst team’s market understanding and expertise. It improves and substantiates every single data presented in the market reports. The data validation interview and discussion panels are typically composed of the most experienced industry members. The participants include, however, are not limited to:
Moreover, we always validate our data and findings through primary respondents from all the major regions we are working on.


Free Customization
Fortune 500 Clients
Free Yearly Update On Purchase Of Multi/Corporate License
Companies Served Till Date