- +1-315-215-1633
- sales@thebrainyinsights.com

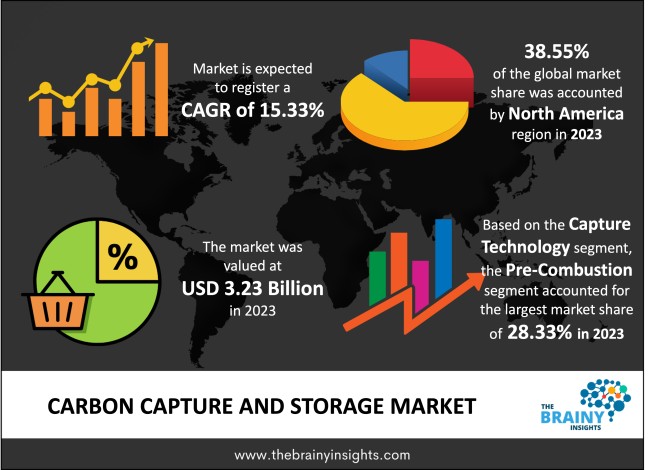
The global carbon capture and storage market was valued at USD 3.23 billion in 2023, which is anticipated to grow at a CAGR of 15.33% from 2024 to 2033. The introduction of carbon capture & storage technology results from growing issues about the damaging effects of carbon emissions on the environment. Due to the possibility of carbon capture and storage technology to serve as a large-scale solution for attaining the high CO2 emission reduction objectives and climate management goals, numerous governments are promoting technology implementation through pilot projects across diverse industries.
Carbon capture and storage is the process of gathering carbon dioxide emissions from sources like coal-fired power plants and reusing or storing the gas after it has been emitted to preserve the environment and stop pollution. The use of carbon capture and storage technology can help reduce carbon emissions, which could be crucial in the fight against global warming. The procedure includes capturing CO2 from the manufacturing processes that produce electricity, such as producing, transmitting, and storing iron and concrete. To prevent atmospheric emissions of CO2 created during the production of electricity and other industrial processes, carbon capture and storage technology is used. Using carbon capture and storage technology might significantly lower CO2 emissions from energy systems. To mitigate the effects of climate change, the objective is to limit CO2 emissions from heavy industries. Adsorption, absorption, membrane gas separation, chemical looping, and gas hydration can be used to remove CO2 directly from an industrial source, such as a cement furnace. Around one-thousandth of the world's CO2 emissions were captured using CCS in 2020. Projects likely to have been industrial in nature. With this method, over 90% of the carbon emissions produced by manufacturing steel and cement, as well as other industrial processes that use fossil fuels, can be captured. Carbon capture and storage have been utilized extensively in various industrial fields, which is also known as carbon control and sequestration. Gas injection Enhanced Oil Recovery (EOR) techniques will increasingly be used because offshore oil and gas exploration and production activities grow due to technological advancements. Crude oil is extracted using carbon dioxide. Oil reservoirs that are getting old and losing capacity will encourage the utilisation of gas injection EOR techniques for both onshore and offshore wells. The CCS market is projected to rise over the forecast period due to the rising demand for CO2 regarding EOR activities in the oil & gas sector. Due to the presence of numerous high-capacity CCS plants and the growing use of CO2 in EOR techniques, it is predicted that the market will experience substantial growth.
Get an overview of this study by requesting a free sample
The rise in investments and technological advancements- The study and advancement of cutting-edge capture technology have attracted increasing financial investment. Additionally, governments are starting programmes to promote CCS technology, encouraging industrial expansion. The public and private sectors are providing significant money towards developing and commercializing low-carbon technology since doing so will reduce carbon prices and protect the environment.
The need for carbon capture and storage is growing- The need for carbon capture and storage has expanded due to strict environmental rules and legislation. Natural gas, petrol, diesel and petroleum products are recently used as principal energy fuels. Exploring and producing these fuels harm the environment. On the other hand, natural gas is seen as a substitute fuel for sustainable development because it lowers carbon emissions, moderates global warming, and lowers GH emissions. The government has implemented various rules and regulations to reduce the dangers of using petrol and diesel as fuel and encourage the usage of natural gas. The benefits of implementing carbon capture and storage, which would lower carbon emissions, are being considered by countries with substantial natural gas reserves.
Safety issues with storage techniques and locations- Carbon dioxide leakage is a critical issue in storing carbon dioxide beneath the planet's surface. CO2 leaks can result in cryogenic burns, water pollution, soil acidification, and changes to groundwater. Therefore, determining the amount and likelihood of risks requires selecting the appropriate place for CO2 storage. Following an underground injection of CO2, it may escape through several geological features, including rock fractures. Another potential problem is leakage through wells. Both well blowouts and ongoing CO2 leaks from active or inactive wells are possible sources. Continuous leakage is a persistent leak caused by subpar well construction, including cement deterioration, casing failures, and well blowouts, and these are frequently driven by subpar pressure control. Well blowouts are rare, but they can result in rapid leakage and have significant environmental repercussions that could result in both human and animal mortality.
The regions analyzed for the market include North America, Europe, South America, Asia Pacific, the Middle East, and Africa. North America emerged as the most significant global carbon capture and storage market, with a 38.55% market revenue share in 2023. It is because of the rising oil and gas industry demand and the strict government rules aimed at lowering carbon emissions. Throughout the projected period, this trend is anticipated to persist.
North America Region Carbon Capture and Storage Market Share in 2023 - 38.55%
www.thebrainyinsights.com
Check the geographical analysis of this market by requesting a free sample
The capture technology segment is divided into industrial process, post-combustion, pre-combustion, and oxy-combustion. The pre-combustion segment dominated, with a market share of around 28.33% in 2023. Pre-combustion CO2 capture using the Acid Gas Removal (AGR) technique and water gas shift reaction is currently being used commercially throughout the world. The benefit of employing this pressure-based capture technology is that it has a 20% lower energy cost for 90% CO2 capture than existing PCC technology.
The application segment is divided into oil & gas, cement, power generation, metal production, and others. The power generation segment dominated the market, with a market share of around 24.31% in 2023. The most significant sources of carbon dioxide emissions are coal-fired power facilities. Utilizing CCS facilities has become essential to reduce carbon emissions to the necessary standards due to constraints placed on power plants. Implementing these technologies is crucial to possibly continue using coal resources for energy production while lowering CO2 emissions. Additionally, the efficiency of the existing power plants can be maintained by upgrading CCS facilities. These factors are expected to increase CCS technology adoption in the power production sector throughout the projection period.
| Attribute | Description |
|---|---|
| Market Size | Revenue (USD Billion) |
| Market size value in 2023 | USD 3.23 Billion |
| Market size value in 2033 | USD 13.45 Billion |
| CAGR (2024 to 2033) | 15.33% |
| Historical data | 2020-2022 |
| Base Year | 2023 |
| Forecast | 2024-2033 |
| Region | The regions analyzed for the market are Asia Pacific, Europe, South America, North America, and Middle East & Africa. Furthermore, the regions are further analyzed at the country level. |
| Segments | Capture Technology, Application |
As per The Brainy Insights, the size of the carbon capture and storage market was valued at USD 3.23 billion in 2023 & USD 13.45 billion by 2033.
Global carbon capture and storage market is growing at a CAGR of 15.33% during the forecast period 2024-2033.
North America region emerged as the largest market for the carbon capture and storage.
The rise in investments and advancements in technology is a significant driving factor for the growth of the carbon capture and storage market.
The growing need for carbon capture and storage is a significant opportunity for the growth of the carbon capture and storage market.
Safety issues with storage techniques and locations is a significant challenging factor for the growth of the carbon capture and storage market.
Key players are Aker Solutions, Dakota Gasification Company, Siemens Energy, Sulzer Ltd., Japan CCS Co., Ltd., LanzaTech, Shell PLC, Linde plc, Mitsubishi Heavy Industries, Equinor ASA, Carbon Engineering Ltd., Fluor Corporation, among others.
1. Introduction
1.1. Objective of the Study
1.2. Market Definition
1.3. Research Scope
1.4. Currency
1.5. Key Target Audience
2. Research Methodology and Assumptions
3. Executive Summary
4. Premium Insights
4.1. Porter’s Five Forces Analysis
4.2. Value Chain Analysis
4.3. Top Investment Pockets
4.3.1. Market Attractiveness Analysis By Capture Technology
4.3.2. Market Attractiveness Analysis By Application
4.3.3. Market Attractiveness Analysis By Region
4.4. Industry Trends
5. Market Dynamics
5.1. Market Evaluation
5.2. Drivers
5.2.1. The rise in investments and advancements in technology
5.3. Opportunities
5.3.1. The need for carbon capture and storage is growing
5.4. Challenges
5.4.1. Safety issues with storage techniques and locations
6. Global Carbon Capture and Storage Market Analysis and Forecast, By Capture Technology
6.1. Segment Overview
6.2. Industrial Process
6.3. Post-combustion
6.4. Pre-combustion
6.5. Oxy-combustion
7. Global Carbon Capture and Storage Market Analysis and Forecast, By Application
7.1. Segment Overview
7.2. Oil & Gas
7.3. Cement
7.4. Power Generation
7.5. Metal Production
7.6. Others
8. Global Carbon Capture and Storage Market Analysis and Forecast, By Regional Analysis
8.1. Segment Overview
8.2. North America
8.2.1. U.S.
8.2.2. Canada
8.2.3. Mexico
8.3. Europe
8.3.1. Germany
8.3.2. France
8.3.3. U.K.
8.3.4. Italy
8.3.5. Spain
8.4. Asia-Pacific
8.4.1. Japan
8.4.2. China
8.4.3. India
8.5. South America
8.5.1. Brazil
8.6. Middle East and Africa
8.6.1. UAE
8.6.2. South Africa
9. Global Carbon Capture and Storage Market-Competitive Landscape
9.1. Overview
9.2. Market Share of Key Players in the Carbon Capture and Storage Market
9.2.1. Global Company Market Share
9.2.2. North America Company Market Share
9.2.3. Europe Company Market Share
9.2.4. APAC Company Market Share
9.3. Competitive Situations and Trends
9.3.1. Product Launches and Developments
9.3.2. Partnerships, Collaborations, and Agreements
9.3.3. Mergers & Acquisitions
9.3.4. Expansions
10. Company Profiles
10.1. Aker Solutions
10.1.1. Business Overview
10.1.2. Company Snapshot
10.1.3. Company Market Share Analysis
10.1.4. Company Product Portfolio
10.1.5. Recent Developments
10.1.6. SWOT Analysis
10.2. Dakota Gasification Company
10.2.1. Business Overview
10.2.2. Company Snapshot
10.2.3. Company Market Share Analysis
10.2.4. Company Product Portfolio
10.2.5. Recent Developments
10.2.6. SWOT Analysis
10.3. Siemens Energy
10.3.1. Business Overview
10.3.2. Company Snapshot
10.3.3. Company Market Share Analysis
10.3.4. Company Product Portfolio
10.3.5. Recent Developments
10.3.6. SWOT Analysis
10.4. Sulzer Ltd.
10.4.1. Business Overview
10.4.2. Company Snapshot
10.4.3. Company Market Share Analysis
10.4.4. Company Product Portfolio
10.4.5. Recent Developments
10.4.6. SWOT Analysis
10.5. Japan CCS Co., Ltd.
10.5.1. Business Overview
10.5.2. Company Snapshot
10.5.3. Company Market Share Analysis
10.5.4. Company Product Portfolio
10.5.5. Recent Developments
10.5.6. SWOT Analysis
10.6. LanzaTech
10.6.1. Business Overview
10.6.2. Company Snapshot
10.6.3. Company Market Share Analysis
10.6.4. Company Product Portfolio
10.6.5. Recent Developments
10.6.6. SWOT Analysis
10.7. Shell PLC
10.7.1. Business Overview
10.7.2. Company Snapshot
10.7.3. Company Market Share Analysis
10.7.4. Company Product Portfolio
10.7.5. Recent Developments
10.7.6. SWOT Analysis
10.8. Linde plc
10.8.1. Business Overview
10.8.2. Company Snapshot
10.8.3. Company Market Share Analysis
10.8.4. Company Product Portfolio
10.8.5. Recent Developments
10.8.6. SWOT Analysis
10.9. Mitsubishi Heavy Industries
10.9.1. Business Overview
10.9.2. Company Snapshot
10.9.3. Company Market Share Analysis
10.9.4. Company Product Portfolio
10.9.5. Recent Developments
10.9.6. SWOT Analysis
10.10. Equinor ASA
10.10.1. Business Overview
10.10.2. Company Snapshot
10.10.3. Company Market Share Analysis
10.10.4. Company Product Portfolio
10.10.5. Recent Developments
10.10.6. SWOT Analysis
10.11. Carbon Engineering Ltd.
10.11.1. Business Overview
10.11.2. Company Snapshot
10.11.3. Company Market Share Analysis
10.11.4. Company Product Portfolio
10.11.5. Recent Developments
10.11.6. SWOT Analysis
10.12. Fluor Corporation
10.12.1. Business Overview
10.12.2. Company Snapshot
10.12.3. Company Market Share Analysis
10.12.4. Company Product Portfolio
10.12.5. Recent Developments
10.12.6. SWOT Analysis
List of Table
1. Global Carbon Capture and Storage Market, By Capture Technology, 2020-2033 (USD Billion)
2. Global Industrial Process, Carbon Capture and Storage Market, By Region, 2020-2033 (USD Billion)
3. Global Post-combustion, Carbon Capture and Storage Market, By Region, 2020-2033 (USD Billion)
4. Global Pre-combustion, Carbon Capture and Storage Market, By Region, 2020-2033 (USD Billion)
5. Global Oxy-combustion, Carbon Capture and Storage Market, By Region, 2020-2033 (USD Billion)
6. Global Carbon Capture and Storage Market, By Application, 2020-2033 (USD Billion)
7. Global Oil & Gas, Carbon Capture and Storage Market, By Region, 2020-2033 (USD Billion)
8. Global Cement, Carbon Capture and Storage Market, By Region, 2020-2033 (USD Billion)
9. Global Power Generation, Carbon Capture and Storage Market, By Region, 2020-2033 (USD Billion)
10. Global Metal Production, Carbon Capture and Storage Market, By Region, 2020-2033 (USD Billion)
11. Global Others, Carbon Capture and Storage Market, By Region, 2020-2033 (USD Billion)
12. Global Carbon Capture and Storage Market, By Region, 2020-2033 (USD Billion)
13. North America Carbon Capture and Storage Market, By Capture Technology, 2020-2033 (USD Billion)
14. North America Carbon Capture and Storage Market, By Application, 2020-2033 (USD Billion)
15. U.S. Carbon Capture and Storage Market, By Capture Technology, 2020-2033 (USD Billion)
16. U.S. Carbon Capture and Storage Market, By Application, 2020-2033 (USD Billion)
17. Canada Carbon Capture and Storage Market, By Capture Technology, 2020-2033 (USD Billion)
18. Canada Carbon Capture and Storage Market, By Application, 2020-2033 (USD Billion)
19. Mexico Carbon Capture and Storage Market, By Capture Technology, 2020-2033 (USD Billion)
20. Mexico Carbon Capture and Storage Market, By Application, 2020-2033 (USD Billion)
21. Europe Carbon Capture and Storage Market, By Capture Technology, 2020-2033 (USD Billion)
22. Europe Carbon Capture and Storage Market, By Application, 2020-2033 (USD Billion)
23. Germany Carbon Capture and Storage Market, By Capture Technology, 2020-2033 (USD Billion)
24. Germany Carbon Capture and Storage Market, By Application, 2020-2033 (USD Billion)
25. France Carbon Capture and Storage Market, By Capture Technology, 2020-2033 (USD Billion)
26. France Carbon Capture and Storage Market, By Application, 2020-2033 (USD Billion)
27. U.K. Carbon Capture and Storage Market, By Capture Technology, 2020-2033 (USD Billion)
28. U.K. Carbon Capture and Storage Market, By Application, 2020-2033 (USD Billion)
29. Italy Carbon Capture and Storage Market, By Capture Technology, 2020-2033 (USD Billion)
30. Italy Carbon Capture and Storage Market, By Application, 2020-2033 (USD Billion)
31. Spain Carbon Capture and Storage Market, By Capture Technology, 2020-2033 (USD Billion)
32. Spain Carbon Capture and Storage Market, By Application, 2020-2033 (USD Billion)
33. Asia Pacific Carbon Capture and Storage Market, By Capture Technology, 2020-2033 (USD Billion)
34. Asia Pacific Carbon Capture and Storage Market, By Application, 2020-2033 (USD Billion)
35. Japan Carbon Capture and Storage Market, By Capture Technology, 2020-2033 (USD Billion)
36. Japan Carbon Capture and Storage Market, By Application, 2020-2033 (USD Billion)
37. China Carbon Capture and Storage Market, By Capture Technology, 2020-2033 (USD Billion)
38. China Carbon Capture and Storage Market, By Application, 2020-2033 (USD Billion)
39. India Carbon Capture and Storage Market, By Capture Technology, 2020-2033 (USD Billion)
40. India Carbon Capture and Storage Market, By Application, 2020-2033 (USD Billion)
41. South America Carbon Capture and Storage Market, By Capture Technology, 2020-2033 (USD Billion)
42. South America Carbon Capture and Storage Market, By Application, 2020-2033 (USD Billion)
43. Brazil Carbon Capture and Storage Market, By Capture Technology, 2020-2033 (USD Billion)
44. Brazil Carbon Capture and Storage Market, By Application, 2020-2033 (USD Billion)
45. Middle East and Africa Carbon Capture and Storage Market, By Capture Technology, 2020-2033 (USD Billion)
46. Middle East and Africa Carbon Capture and Storage Market, By Application, 2020-2033 (USD Billion)
47. UAE Carbon Capture and Storage Market, By Capture Technology, 2020-2033 (USD Billion)
48. UAE Carbon Capture and Storage Market, By Application, 2020-2033 (USD Billion)
49. South Africa Carbon Capture and Storage Market, By Capture Technology, 2020-2033 (USD Billion)
50. South Africa Carbon Capture and Storage Market, By Application, 2020-2033 (USD Billion)
List of Figures
1. Global Carbon Capture and Storage Market Segmentation
2. Carbon Capture and Storage Market: Research Methodology
3. Market Size Estimation Methodology: Bottom-Up Approach
4. Market Size Estimation Methodology: Top-Down Approach
5. Data Triangulation
6. Porter’s Five Forces Analysis
7. Value Chain Analysis
8. Global Carbon Capture and Storage Market Attractiveness Analysis By Capture Technology
9. Global Carbon Capture and Storage Market Attractiveness Analysis By Application
10. Global Carbon Capture and Storage Market Attractiveness Analysis By Region
11. Global Carbon Capture and Storage Market: Dynamics
12. Global Carbon Capture and Storage Market Share by Capture Technology (2023 & 2033)
13. Global Carbon Capture and Storage Market Share by Application (2023 & 2033)
14. Global Carbon Capture and Storage Market Share by Regions (2023 & 2033)
15. Global Carbon Capture and Storage Market Share by Company (2023)
This study forecasts revenue at global, regional, and country levels from 2020 to 2033. The Brainy Insights has segmented the global carbon capture and storage market based on below mentioned segments:
Global Carbon Capture and Storage by Capture Technology:
Global Carbon Capture and Storage by Application:
Global Carbon Capture and Storage by Region:
Research has its special purpose to undertake marketing efficiently. In this competitive scenario, businesses need information across all industry verticals; the information about customer wants, market demand, competition, industry trends, distribution channels etc. This information needs to be updated regularly because businesses operate in a dynamic environment. Our organization, The Brainy Insights incorporates scientific and systematic research procedures in order to get proper market insights and industry analysis for overall business success. The analysis consists of studying the market from a miniscule level wherein we implement statistical tools which helps us in examining the data with accuracy and precision.
Our research reports feature both; quantitative and qualitative aspects for any market. Qualitative information for any market research process are fundamental because they reveal the customer needs and wants, usage and consumption for any product/service related to a specific industry. This in turn aids the marketers/investors in knowing certain perceptions of the customers. Qualitative research can enlighten about the different product concepts and designs along with unique service offering that in turn, helps define marketing problems and generate opportunities. On the other hand, quantitative research engages with the data collection process through interviews, e-mail interactions, surveys and pilot studies. Quantitative aspects for the market research are useful to validate the hypotheses generated during qualitative research method, explore empirical patterns in the data with the help of statistical tools, and finally make the market estimations.
The Brainy Insights offers comprehensive research and analysis, based on a wide assortment of factual insights gained through interviews with CXOs and global experts and secondary data from reliable sources. Our analysts and industry specialist assume vital roles in building up statistical tools and analysis models, which are used to analyse the data and arrive at accurate insights with exceedingly informative research discoveries. The data provided by our organization have proven precious to a diverse range of companies, facilitating them to address issues such as determining which products/services are the most appealing, whether or not customers use the product in the manner anticipated, the purchasing intentions of the market and many others.
Our research methodology encompasses an idyllic combination of primary and secondary initiatives. Key phases involved in this process are listed below:

The phase involves the gathering and collecting of market data and its related information with the help of different sources & research procedures.

The data procurement stage involves in data gathering and collecting through various data sources.
This stage involves in extensive research. These data sources includes:
Purchased Database: Purchased databases play a crucial role in estimating the market sizes irrespective of the domain. Our purchased database includes:
Primary Research: The Brainy Insights interacts with leading companies and experts of the concerned domain to develop the analyst team’s market understanding and expertise. It improves and substantiates every single data presented in the market reports. Primary research mainly involves in telephonic interviews, E-mail interactions and face-to-face interviews with the raw material providers, manufacturers/producers, distributors, & independent consultants. The interviews that we conduct provides valuable data on market size and industry growth trends prevailing in the market. Our organization also conducts surveys with the various industry experts in order to gain overall insights of the industry/market. For instance, in healthcare industry we conduct surveys with the pharmacists, doctors, surgeons and nurses in order to gain insights and key information of a medical product/device/equipment which the customers are going to usage. Surveys are conducted in the form of questionnaire designed by our own analyst team. Surveys plays an important role in primary research because surveys helps us to identify the key target audiences of the market. Additionally, surveys helps to identify the key target audience engaged with the market. Our survey team conducts the survey by targeting the key audience, thus gaining insights from them. Based on the perspectives of the customers, this information is utilized to formulate market strategies. Moreover, market surveys helps us to understand the current competitive situation of the industry. To be precise, our survey process typically involve with the 360 analysis of the market. This analytical process begins by identifying the prospective customers for a product or service related to the market/industry to obtain data on how a product/service could fit into customers’ lives.

Secondary Research: The secondary data sources includes information published by the on-profit organizations such as World bank, WHO, company fillings, investor presentations, annual reports, national government documents, statistical databases, blogs, articles, white papers and others. From the annual report, we analyse a company’s revenue to understand the key segment and market share of that organization in a particular region. We analyse the company websites and adopt the product mapping technique which is important for deriving the segment revenue. In the product mapping method, we select and categorize the products offered by the companies catering to domain specific market, deduce the product revenue for each of the companies so as to get overall estimation of the market size. We also source data and analyses trends based on information received from supply side and demand side intermediaries in the value chain. The supply side denotes the data gathered from supplier, distributor, wholesaler and the demand side illustrates the data gathered from the end customers for respective market domain.

The supply side for a domain specific market is analysed by:
The demand side for the market is estimated through:
In-house Library: Apart from these third-party sources, we have our in-house library of qualitative and quantitative information. Our in-house database includes market data for various industry and domains. These data are updated on regular basis as per the changing market scenario. Our library includes, historic databases, internal audit reports and archives.
Sometimes there are instances where there is no metadata or raw data available for any domain specific market. For those cases, we use our expertise to forecast and estimate the market size in order to generate comprehensive data sets. Our analyst team adopt a robust research technique in order to produce the estimates:
Data Synthesis: This stage involves the analysis & mapping of all the information obtained from the previous step. It also involves in scrutinizing the data for any discrepancy observed while data gathering related to the market. The data is collected with consideration to the heterogeneity of sources. Robust scientific techniques are in place for synthesizing disparate data sets and provide the essential contextual information that can orient market strategies. The Brainy Insights has extensive experience in data synthesis where the data passes through various stages:


Market Deduction & Formulation: The final stage comprises of assigning data points at appropriate market spaces so as to deduce feasible conclusions. Analyst perspective & subject matter expert based holistic form of market sizing coupled with industry analysis also plays a crucial role in this stage.
This stage involves in finalization of the market size and numbers that we have collected from data integration step. With data interpolation, it is made sure that there is no gap in the market data. Successful trend analysis is done by our analysts using extrapolation techniques, which provide the best possible forecasts for the market.
Data Validation & Market Feedback: Validation is the most important step in the process. Validation & re-validation via an intricately designed process helps us finalize data-points to be used for final calculations.

The Brainy Insights interacts with leading companies and experts of the concerned domain to develop the analyst team’s market understanding and expertise. It improves and substantiates every single data presented in the market reports. The data validation interview and discussion panels are typically composed of the most experienced industry members. The participants include, however, are not limited to:
Moreover, we always validate our data and findings through primary respondents from all the major regions we are working on.


Free Customization
Fortune 500 Clients
Free Yearly Update On Purchase Of Multi/Corporate License
Companies Served Till Date