- +1-315-215-1633
- sales@thebrainyinsights.com

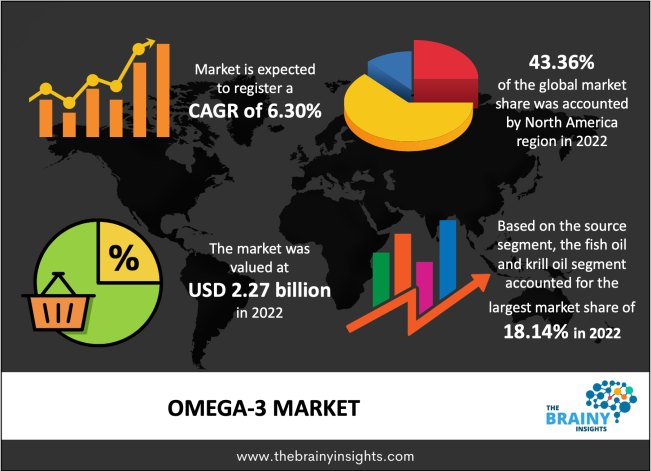
The global omega-3 market was valued at USD 2.27 Billion in 2022, increasing at a CAGR of 6.30% from 2022 to 2030 and anticipated to reach USD 3.71 Billion by 2030. Asia Pacific is expected to grow the fastest during the forecast period. Further, the power of omega-3 to boost forestalling & immunity to chronic conditions such as inflammatory internal organ disease in dogs and cats is anticipated to propel the market growth during the forecast period. Also, the ever-increasing vegan population, along with increasing customer awareness regarding the product benefits, are driving factors of the market growth.
Omega-3 fatty acids are a type of fat the body cannot make on its own. They are essential fat, which means they are required to survive. Omega-3 fatty acids are a form of polyunsaturated fat that the body emanates from food. Omega-3s are known as important fatty acids (EFAs) because the body cannot make these fatty acids on its own, so omega-3s must be obtained from food. These various kinds of fatty acids can be obtained in foods like cold-water fish, including mackerel, tuna, and salmon. Other essential omega-3 fatty acids are found in dark green leafy vegetables, chia seeds, flaxseed oils, walnuts, and certain vegetable oils. Omega-3 fatty acids are beneficial for the heart. Positive effects contain lowering cholesterol and triglyceride levels, anti-inflammatory & anti-blood clotting actions, and reduced blood pressure. These fatty acids may also reduce the risks & symptoms of other diseases, including diabetes, rheumatoid arthritis, some cancers, asthma, stroke, inflammatory bowel disease, ulcerative colitis, and mental decline.
Get an overview of this study by requesting a free sample
For example, in October 2019, KD Pharma Company introduced Kardio3, a blend of phytosterols, vitamin K2, and omega-3. It helps heart & bone health and assists in maintaining healthy lipids.
For instance, in August 2019, Cargill Company obtained support for producing omega-3 sourced from canola that can be broadly utilized in the aquaculture feed market.
For example, on 31 August 2021, India's agriculture minister founded the vegetarian omega-3 supplement RuVega which is extracted from the Perilla Plant & formulated and developed jointly by a unit of scientists at the Center of Aromatic Plants (CAP).
The rising health awareness of consumption of omega 3s: The rising customer awareness of the advantages of polyunsaturated fatty acids for healthy eating and body composition is the driving factor of the market growth. Further, the gradual increase in several patients suffering from cardiovascular diseases propels market growth. Also, the ever-increasing concern towards healthy eating among health-conscious customers is leading to a proliferation in demand for omega-3 ingredients across regions such as Asia Pacific, North America, Europe, Latin America, the Middle East, and Africa. Moreover, rising efforts to avoid health complexities related to high blood pressure & high triglyceride level is driving factor of the market growth. In addition, the gradual flow of information about the benefits associated with consuming food products high in omega-3 is anticipated to drive market growth during the forecast period.
The stringent & uncertain regulatory environment: The uneven fish capture and the absence of recommended daily intake (RDI) restrain the market growth. Furthermore, the fish & other sea oils utilized to produce omega-3 are expensive and highly unstable. This factor is also limiting the market growth. Further, the stringent government rules related to product approval and side effects of the omega-3 are anticipated to hamper the market growth. Moreover, the increasing demand for fish from other application sources reduces their availability at a lower cost inhibiting the market growth during the forecast period.
The rising R&D activities: The increasing investments in clinical R&D facilities are an opportunity for market growth. Furthermore, the crucial participants in the market are investing huge capital in research and development to incorporate technology that will improve the bioavailability of omega-3 in the body. In addition, efforts to improve the organoleptic properties of the fatty acids extracted from marine sources propel the market growth during the forecast period. Also, players' inclination towards tracking the untapped market in emerging economies is anticipated to drive market growth.
The regions analyzed for the market include Europe, South America, Asia Pacific, North America, the Middle East, and Africa. North America emerged as the largest global omega-3 market, with a 43.36% market revenue share in 2022. North America dominates the omega-3 market due to the presence of major companies that use omega-3 as crucial components in various products. Moreover, the growing occurrences of chronic diseases, high focus on enhancing the customer base, introducing innovative products, rising customer awareness about cholesterol control, technology advancement, and growing merger activities to strengthen the product portfolio are also propelling the market growth. Asia Pacific is expected to grow the fastest during the forecast period due to the shift in customer preference toward a healthy diet containing omega-3 ingredients and the usage of fish oil. Also, the abundant availability of raw materials and cost-effective labour in countries are stimulating market growth in this region. Furthermore, the growing preference to spend on supplements and the increasing customer coverage of online media are helping to propel the market growth during the forecast period.
North America Region Omega 3 Market Share in 2022 - 43.36%
www.thebrainyinsights.com
Check the geographical analysis of this market by requesting a free sample
The source segment is divided into algal oil, fish oil & krill oil, canola oil, walnut, soybean oil, pumpkin seeds, bean curd, and others. The fish oil & krill oil segment dominated, with a market share of around 18.14% in 2022. This growth is attributed to the ever-increasing use of krill oil in the pharmaceutical and food & beverage industry. Also, species such as sardines & anchovies are rich in omega-3 fatty acids, and other species like salmon & tuna are also popular among manufacturers. In addition, the growing consumption of improved medication, along with the need to increase the life expectancy of the ageing population, is propelling the segment's market growth. Further, by 2030, the algal oil segment will likely dominate the market due to the ever-increasing awareness regarding the long-term benefits of omega-3 consumption. Additionally, algal oil is gaining popularity among vegan customers as it does not include fish oil or fishy odour traces.
The type segment is divided into eicosapentaenoic acid (EPA), docosahexaenoic acid (DHA), and alpha-linolenic acid (ALA). In 2022, the docosahexaenoic acid (DHA) segment dominated the market with the largest market share of 41.11% and a revenue of 0.93 billion. This growth is attributed to the increasing R&D activities and continuous modernization. Docosahexaenoic acid is also needed to maintain normal brain function in adults. Including plentiful DHA in the diet improves learning capability, whereas deficiencies in docosahexaenoic acid deficiencies are associated with learning deficits. Further, by 2030, the alpha-linolenic acid (ALA) segment will likely dominate the market due to the increasing demand for plant-based omega-3 PUFA from vegan & vegetarian customers across the globe.
The application segment is divided into infant formula, dietary supplements, pharmaceuticals, fish feed, pet food, and food & beverage. In 2022, the dietary supplement segment dominated the market, accounting for around 23.15% of global revenue. This growth is attributed to the offering of different health benefits in powders and capsules. Moreover, an increasing number of gymnasiums, fitness centres, and health clubs are also helping to boost the segment's market growth. Also, the impact of COVID-19 resulted in the generation of opportunities for manufacturers of health-oriented products, particularly dietary supplements. Further, by 2030, the infant formula segment will likely dominate the market due to the ever-increasing consumption of breast milk substitutes, which closely correspond to the functionality & composition of breast milk.
| Attribute | Description |
|---|---|
| Market Size | Revenue (USD Billion) |
| Market size value in 2022 | USD 2.27 Billion, Volume in tons |
| Market size value in 2030 | USD 3.71 Billion, Volume in tons |
| CAGR (2022 to 2030) | 6.30% |
| Historical data | 2019-2020 |
| Base Year | 2021 |
| Forecast | 2022-2030 |
| Segments | Key Segments are source, type, application, and regions |
| Regional Segments | The key regions are North America, South America, Europe, Asia Pacific, and Middle East & Africa. |
1. Introduction
1.1. Objectives of the Study
1.2. Market Definition
1.3. Research Scope
1.4. Currency
1.5. Key Target Audience
2. Research Methodology and Assumptions
3. Executive Summary
4. Premium Insights
4.1. Porter’s Five Forces Analysis
4.2. Value Chain Analysis
4.3. Top Investment Pockets
4.3.1. Market Attractiveness Analysis By Source
4.3.2. Market Attractiveness Analysis By Type
4.3.3. Market Attractiveness Analysis By Application
4.3.4. Market Attractiveness Analysis By Region
4.4. Industry Trends
5. Market Dynamics
5.1. Market Evaluation
5.2. Drivers
5.2.1. The prevalence of improved medication and better health supplements
5.2.2. The rising awareness of health benefits of polyunsaturated fatty acids (PUFA)
5.2.3. The prevalence of improved medication and better health supplements
5.3. Restraints
5.3.1. The stringent & uncertain regulatory environment
5.3.2. The absence of recommended daily intake (RDI)
5.4. Opportunities
5.4.1. The rising R&D activities
5.4.2. The technological advancements
6. Global Omega 3 Market Analysis and Forecast, By Source
6.1. Segment Overview
6.2. Algal Oil
6.3. Fish Oil & Krill Oil
6.4. Canola Oil
6.5. Walnut
6.6. Soybean Oil
6.7. Pumpkin Seeds
6.8. Bean Curd
6.9. Others
7. Global Omega 3 Market Analysis and Forecast, By Type
7.1. Segment Overview
7.2. Eicosapentaenoic Acid (EPA)
7.3. Docosahexaenoic Acid (DHA)
7.4. Alpha-Linolenic Acid (ALA)
8. Global Omega 3 Market Analysis and Forecast, By Application
8.1. Segment Overview
8.2. Infant Formula
8.3. Dietary Supplement
8.4. Pharmaceutical
8.5. Fish Feed
8.6. Pet Food
8.7. Food & Beverage
9. Global Omega 3 Market Analysis and Forecast, By Regional Analysis
9.1. Segment Overview
9.2. North America
9.2.1. U.S.
9.2.2. Canada
9.2.3. Mexico
9.3. Europe
9.3.1. Germany
9.3.2. France
9.3.3. U.K.
9.3.4. Italy
9.3.5. Spain
9.4. Asia-Pacific
9.4.1. Japan
9.4.2. China
9.4.3. India
9.5. South America
9.5.1. Brazil
9.6. Middle East and Africa
9.6.1. UAE
9.6.2. South Africa
10. Global Omega 3 Market-Competitive Landscape
10.1. Overview
10.2. Market Share of Key Players in Global Omega 3 Market
10.2.1. Global Company Market Share
10.2.2. North America Company Market Share
10.2.3. Europe Company Market Share
10.2.4. APAC Company Market Share
10.3. Competitive Situations and Trends
10.3.1. Product Launches and Developments
10.3.2. Partnerships, Collaborations, and Agreements
10.3.3. Mergers & Acquisitions
10.3.4. Expansions
11. Company Profiles
11.1. BASF SE
11.1.1. Business Overview
11.1.2. Company Snapshot
11.1.3. Company Market Share Analysis
11.1.4. Company Product Portfolio
11.1.5. Recent Developments
11.1.6. SWOT Analysis
11.2. DSM
11.2.1. Business Overview
11.2.2. Company Snapshot
11.2.3. Company Market Share Analysis
11.2.4. Company Product Portfolio
11.2.5. Recent Developments
11.2.6. SWOT Analysis
11.3. Glanbia Plc.
11.3.1. Business Overview
11.3.2. Company Snapshot
11.3.3. Company Market Share Analysis
11.3.4. Company Product Portfolio
11.3.5. Recent Developments
11.3.6. SWOT Analysis
11.4. Lonza Group
11.4.1. Business Overview
11.4.2. Company Snapshot
11.4.3. Company Market Share Analysis
11.4.4. Company Product Portfolio
11.4.5. Recent Developments
11.4.6. SWOT Analysis
11.5. SternVitamin GmbH & Co. KG
11.5.1. Business Overview
11.5.2. Company Snapshot
11.5.3. Company Market Share Analysis
11.5.4. Company Product Portfolio
11.5.5. Recent Developments
11.5.6. SWOT Analysis
11.6. Farbest Brands
11.6.1. Business Overview
11.6.2. Company Snapshot
11.6.3. Company Market Share Analysis
11.6.4. Company Product Portfolio
11.6.5. Recent Developments
11.6.6. SWOT Analysis
11.7. ADM
11.7.1. Business Overview
11.7.2. Company Snapshot
11.7.3. Company Market Share Analysis
11.7.4. Company Product Portfolio
11.7.5. Recent Developments
11.7.6. SWOT Analysis
11.8. BTSA Biotechnologias Aplicadas S.L.
11.8.1. Business Overview
11.8.2. Company Snapshot
11.8.3. Company Market Share Analysis
11.8.4. Company Product Portfolio
11.8.5. Recent Developments
11.8.6. SWOT Analysis
11.9. Adisseo
11.9.1. Business Overview
11.9.2. Company Snapshot
11.9.3. Company Market Share Analysis
11.9.4. Company Product Portfolio
11.9.5. Recent Developments
11.9.6. SWOT Analysis
11.10. Golden Omega
11.10.1. Business Overview
11.10.2. Company Snapshot
11.10.3. Company Market Share Analysis
11.10.4. Company Product Portfolio
11.10.5. Recent Developments
11.10.6. SWOT Analysis
11.11. Rabar Pty Ltd
11.11.1. Business Overview
11.11.2. Company Snapshot
11.11.3. Company Market Share Analysis
11.11.4. Company Product Portfolio
11.11.5. Recent Developments
11.11.6. SWOT Analysis
11.12. Kinomega Biopharm Inc.
11.12.1. Business Overview
11.12.2. Company Snapshot
11.12.3. Company Market Share Analysis
11.12.4. Company Product Portfolio
11.12.5. Recent Developments
11.12.6. SWOT Analysis
11.13. Polaris
11.13.1. Business Overview
11.13.2. Company Snapshot
11.13.3. Company Market Share Analysis
11.13.4. Company Product Portfolio
11.13.5. Recent Developments
11.13.6. SWOT Analysis
11.14. Sinomega Biotech Engineering Co. Ltd.
11.14.1. Business Overview
11.14.2. Company Snapshot
11.14.3. Company Market Share Analysis
11.14.4. Company Product Portfolio
11.14.5. Recent Developments
11.14.6. SWOT Analysis
11.15. Pharma Marine AS
11.15.1. Business Overview
11.15.2. Company Snapshot
11.15.3. Company Market Share Analysis
11.15.4. Company Product Portfolio
11.15.5. Recent Developments
11.15.6. SWOT Analysis
11.16. Huatai Biopharm
11.16.1. Business Overview
11.16.2. Company Snapshot
11.16.3. Company Market Share Analysis
11.16.4. Company Product Portfolio
11.16.5. Recent Developments
11.16.6. SWOT Analysis
11.17. ALGISYS LLC
11.17.1. Business Overview
11.17.2. Company Snapshot
11.17.3. Company Market Share Analysis
11.17.4. Company Product Portfolio
11.17.5. Recent Developments
11.17.6. SWOT Analysis
11.18. Biosearch Life
11.18.1. Business Overview
11.18.2. Company Snapshot
11.18.3. Company Market Share Analysis
11.18.4. Company Product Portfolio
11.18.5. Recent Developments
11.18.6. SWOT Analysis
List of Table
1. Global Omega 3 Market, By Source, 2019-2030 (USD Billion) (Tons)
2. Global Algal Oil, Omega 3 Market, By Region, 2019-2030 (USD Billion) (Tons)
3. Global Fish Oil & Krill Oil, Omega 3 Market, By Region, 2019-2030 (USD Billion) (Tons)
4. Global Canola Oil, Omega 3 Market, By Region, 2019-2030 (USD Billion) (Tons)
5. Global Walnut, Omega 3 Market, By Region, 2019-2030 (USD Billion) (Tons)
6. Global Soybean Oil, Omega 3 Market, By Region, 2019-2030 (USD Billion) (Tons)
7. Global Pumpkin Seeds, Omega 3 Market, By Region, 2019-2030 (USD Billion) (Tons)
8. Global Bean Curd, Omega 3 Market, By Region, 2019-2030 (USD Billion) (Tons)
9. Global Others, Omega 3 Market, By Region, 2019-2030 (USD Billion) (Tons)
10. Global Omega 3 Market, By Type, 2019-2030 (USD Billion) (Tons)
11. Global Eicosapentaenoic Acid (EPA), Omega 3 Market, By Region, 2019-2030 (USD Billion) (Tons)
12. Global Docosahexaenoic Acid (DHA), Omega 3 Market, By Region, 2019-2030 (USD Billion) (Tons)
13. Global Alpha-Linolenic Acid (ALA), Omega 3 Market, By Region, 2019-2030 (USD Billion) (Tons)
14. Global Omega 3 Market, By Application, 2019-2030 (USD Billion) (Tons)
15. Global Infant Formula, Omega 3 Market, By Region, 2019-2030 (USD Billion) (Tons)
16. Global Dietary Supplement, Omega 3 Market, By Region, 2019-2030 (USD Billion) (Tons)
17. Global Pharmaceutical, Omega 3 Market, By Region, 2019-2030 (USD Billion) (Tons)
18. Global Fish Feed, Omega 3 Market, By Region, 2019-2030 (USD Billion) (Tons)
19. Global Pet Food, Omega 3 Market, By Region, 2019-2030 (USD Billion) (Tons)
20. Global Food & Beverage, Omega 3 Market, By Region, 2019-2030 (USD Billion) (Tons)
21. North America Omega 3 Market, By Source, 2019-2030 (USD Billion) (Tons)
22. North America Omega 3 Market, By Type, 2019-2030 (USD Billion) (Tons)
23. North America Omega 3 Market, By Application, 2019-2030 (USD Billion) (Tons)
24. U.S. Omega 3 Market, By Source, 2019-2030 (USD Billion) (Tons)
25. U.S. Omega 3 Market, By Type, 2019-2030 (USD Billion) (Tons)
26. U.S. Omega 3 Market, By Application, 2019-2030 (USD Billion) (Tons)
27. Canada Omega 3 Market, By Source, 2019-2030 (USD Billion) (Tons)
28. Canada Omega 3 Market, By Type, 2019-2030 (USD Billion) (Tons)
29. Canada Omega 3 Market, By Application, 2019-2030 (USD Billion) (Tons)
30. Mexico Omega 3 Market, By Source, 2019-2030 (USD Billion) (Tons)
31. Mexico Omega 3 Market, By Type, 2019-2030 (USD Billion) (Tons)
32. Mexico Omega 3 Market, By Application, 2019-2030 (USD Billion) (Tons)
33. Europe Omega 3 Market, By Source, 2019-2030 (USD Billion) (Tons)
34. Europe Omega 3 Market, By Type, 2019-2030 (USD Billion) (Tons)
35. Europe Omega 3 Market, By Application, 2019-2030 (USD Billion) (Tons)
36. Germany Omega 3 Market, By Source, 2019-2030 (USD Billion) (Tons)
37. Germany Omega 3 Market, By Type, 2019-2030 (USD Billion) (Tons)
38. Germany Omega 3 Market, By Application, 2019-2030 (USD Billion) (Tons)
39. France Omega 3 Market, By Source, 2019-2030 (USD Billion) (Tons)
40. France Omega 3 Market, By Type, 2019-2030 (USD Billion) (Tons)
41. France Omega 3 Market, By Application, 2019-2030 (USD Billion) (Tons)
42. U.K. Omega 3 Market, By Source, 2019-2030 (USD Billion) (Tons)
43. U.K. Omega 3 Market, By Type, 2019-2030 (USD Billion) (Tons)
44. U.K. Omega 3 Market, By Application, 2019-2030 (USD Billion) (Tons)
45. Italy Omega 3 Market, By Source, 2019-2030 (USD Billion) (Tons)
46. Italy Omega 3 Market, By Type, 2019-2030 (USD Billion) (Tons)
47. Italy Omega 3 Market, By Application, 2019-2030 (USD Billion) (Tons)
48. Spain Omega 3 Market, By Source, 2019-2030 (USD Billion) (Tons)
49. Spain Omega 3 Market, By Type, 2019-2030 (USD Billion) (Tons)
50. Spain Omega 3 Market, By Application, 2019-2030 (USD Billion) (Tons)
51. Asia Pacific Omega 3 Market, By Source, 2019-2030 (USD Billion) (Tons)
52. Asia Pacific Omega 3 Market, By Type, 2019-2030 (USD Billion) (Tons)
53. Asia Pacific Omega 3 Market, By Application, 2019-2030 (USD Billion) (Tons)
54. Japan Omega 3 Market, By Source, 2019-2030 (USD Billion) (Tons)
55. Japan Omega 3 Market, By Type, 2019-2030 (USD Billion) (Tons)
56. Japan Omega 3 Market, By Application, 2019-2030 (USD Billion) (Tons)
57. China Omega 3 Market, By Source, 2019-2030 (USD Billion) (Tons)
58. China Omega 3 Market, By Type, 2019-2030 (USD Billion) (Tons)
59. China Omega 3 Market, By Application, 2019-2030 (USD Billion) (Tons)
60. India Omega 3 Market, By Source, 2019-2030 (USD Billion) (Tons)
61. India Omega 3 Market, By Type, 2019-2030 (USD Billion) (Tons)
62. India Omega 3 Market, By Application, 2019-2030 (USD Billion) (Tons)
63. South America Omega 3 Market, By Source, 2019-2030 (USD Billion) (Tons)
64. South America Omega 3 Market, By Type, 2019-2030 (USD Billion) (Tons)
65. South America Omega 3 Market, By Application, 2019-2030 (USD Billion) (Tons)
66. Brazil Omega 3 Market, By Source, 2019-2030 (USD Billion) (Tons)
67. Brazil Omega 3 Market, By Type, 2019-2030 (USD Billion) (Tons)
68. Brazil Omega 3 Market, By Application, 2019-2030 (USD Billion) (Tons)
69. Middle East and Africa Omega 3 Market, By Source, 2019-2030 (USD Billion) (Tons)
70. Middle East and Africa Omega 3 Market, By Type, 2019-2030 (USD Billion) (Tons)
71. Middle East and Africa Omega 3 Market, By Application, 2019-2030 (USD Billion) (Tons)
72. UAE Omega 3 Market, By Source, 2019-2030 (USD Billion) (Tons)
73. UAE Omega 3 Market, By Type, 2019-2030 (USD Billion) (Tons)
74. UAE Omega 3 Market, By Application, 2019-2030 (USD Billion) (Tons)
75. South Africa Omega 3 Market, By Source, 2019-2030 (USD Billion) (Tons)
76. South Africa Omega 3 Market, By Type, 2019-2030 (USD Billion) (Tons)
77. South Africa Omega 3 Market, By Application, 2019-2030 (USD Billion) (Tons)
List of Figures
1. Global Omega 3 Market Segmentation
2. Global Omega 3 Market: Research Methodology
3. Market Size Estimation Methodology: Bottom-Up Approach
4. Market Size Estimation Methodology: Top- Approach
5. Data Triangulation
6. Porter’s Five Forces Analysis
7. Value Chain Analysis
8. Global Omega 3 Market Attractiveness Analysis By Source
9. Global Omega 3 Market Attractiveness Analysis By Type
10. Global Omega 3 Market Attractiveness Analysis By Application
11. Global Omega 3 Market Attractiveness Analysis By Region
12. Global Omega 3 Market: Dynamics
13. Global Omega 3 Market Share By Source (2022 & 2030)
14. Global Omega 3 Market Share By Type (2022 & 2030)
15. Global Omega 3 Market Share By Application (2022 & 2030)
16. Global Omega 3 Market Share By Regions (2022 & 2030)
17. Global Omega 3 Market Share By Company (2021)
This study forecasts revenue at global, regional, and country levels from 2019 to 2030. The Brainy Insights has segmented the global omega 3 based on below mentioned segments:
Global Omega 3 Market by Source:
Global Omega 3 Market by Type:
Global Omega 3 Market by Application:
Global Omega 3 by Region:
Research has its special purpose to undertake marketing efficiently. In this competitive scenario, businesses need information across all industry verticals; the information about customer wants, market demand, competition, industry trends, distribution channels etc. This information needs to be updated regularly because businesses operate in a dynamic environment. Our organization, The Brainy Insights incorporates scientific and systematic research procedures in order to get proper market insights and industry analysis for overall business success. The analysis consists of studying the market from a miniscule level wherein we implement statistical tools which helps us in examining the data with accuracy and precision.
Our research reports feature both; quantitative and qualitative aspects for any market. Qualitative information for any market research process are fundamental because they reveal the customer needs and wants, usage and consumption for any product/service related to a specific industry. This in turn aids the marketers/investors in knowing certain perceptions of the customers. Qualitative research can enlighten about the different product concepts and designs along with unique service offering that in turn, helps define marketing problems and generate opportunities. On the other hand, quantitative research engages with the data collection process through interviews, e-mail interactions, surveys and pilot studies. Quantitative aspects for the market research are useful to validate the hypotheses generated during qualitative research method, explore empirical patterns in the data with the help of statistical tools, and finally make the market estimations.
The Brainy Insights offers comprehensive research and analysis, based on a wide assortment of factual insights gained through interviews with CXOs and global experts and secondary data from reliable sources. Our analysts and industry specialist assume vital roles in building up statistical tools and analysis models, which are used to analyse the data and arrive at accurate insights with exceedingly informative research discoveries. The data provided by our organization have proven precious to a diverse range of companies, facilitating them to address issues such as determining which products/services are the most appealing, whether or not customers use the product in the manner anticipated, the purchasing intentions of the market and many others.
Our research methodology encompasses an idyllic combination of primary and secondary initiatives. Key phases involved in this process are listed below:

The phase involves the gathering and collecting of market data and its related information with the help of different sources & research procedures.

The data procurement stage involves in data gathering and collecting through various data sources.
This stage involves in extensive research. These data sources includes:
Purchased Database: Purchased databases play a crucial role in estimating the market sizes irrespective of the domain. Our purchased database includes:
Primary Research: The Brainy Insights interacts with leading companies and experts of the concerned domain to develop the analyst team’s market understanding and expertise. It improves and substantiates every single data presented in the market reports. Primary research mainly involves in telephonic interviews, E-mail interactions and face-to-face interviews with the raw material providers, manufacturers/producers, distributors, & independent consultants. The interviews that we conduct provides valuable data on market size and industry growth trends prevailing in the market. Our organization also conducts surveys with the various industry experts in order to gain overall insights of the industry/market. For instance, in healthcare industry we conduct surveys with the pharmacists, doctors, surgeons and nurses in order to gain insights and key information of a medical product/device/equipment which the customers are going to usage. Surveys are conducted in the form of questionnaire designed by our own analyst team. Surveys plays an important role in primary research because surveys helps us to identify the key target audiences of the market. Additionally, surveys helps to identify the key target audience engaged with the market. Our survey team conducts the survey by targeting the key audience, thus gaining insights from them. Based on the perspectives of the customers, this information is utilized to formulate market strategies. Moreover, market surveys helps us to understand the current competitive situation of the industry. To be precise, our survey process typically involve with the 360 analysis of the market. This analytical process begins by identifying the prospective customers for a product or service related to the market/industry to obtain data on how a product/service could fit into customers’ lives.

Secondary Research: The secondary data sources includes information published by the on-profit organizations such as World bank, WHO, company fillings, investor presentations, annual reports, national government documents, statistical databases, blogs, articles, white papers and others. From the annual report, we analyse a company’s revenue to understand the key segment and market share of that organization in a particular region. We analyse the company websites and adopt the product mapping technique which is important for deriving the segment revenue. In the product mapping method, we select and categorize the products offered by the companies catering to domain specific market, deduce the product revenue for each of the companies so as to get overall estimation of the market size. We also source data and analyses trends based on information received from supply side and demand side intermediaries in the value chain. The supply side denotes the data gathered from supplier, distributor, wholesaler and the demand side illustrates the data gathered from the end customers for respective market domain.

The supply side for a domain specific market is analysed by:
The demand side for the market is estimated through:
In-house Library: Apart from these third-party sources, we have our in-house library of qualitative and quantitative information. Our in-house database includes market data for various industry and domains. These data are updated on regular basis as per the changing market scenario. Our library includes, historic databases, internal audit reports and archives.
Sometimes there are instances where there is no metadata or raw data available for any domain specific market. For those cases, we use our expertise to forecast and estimate the market size in order to generate comprehensive data sets. Our analyst team adopt a robust research technique in order to produce the estimates:
Data Synthesis: This stage involves the analysis & mapping of all the information obtained from the previous step. It also involves in scrutinizing the data for any discrepancy observed while data gathering related to the market. The data is collected with consideration to the heterogeneity of sources. Robust scientific techniques are in place for synthesizing disparate data sets and provide the essential contextual information that can orient market strategies. The Brainy Insights has extensive experience in data synthesis where the data passes through various stages:


Market Deduction & Formulation: The final stage comprises of assigning data points at appropriate market spaces so as to deduce feasible conclusions. Analyst perspective & subject matter expert based holistic form of market sizing coupled with industry analysis also plays a crucial role in this stage.
This stage involves in finalization of the market size and numbers that we have collected from data integration step. With data interpolation, it is made sure that there is no gap in the market data. Successful trend analysis is done by our analysts using extrapolation techniques, which provide the best possible forecasts for the market.
Data Validation & Market Feedback: Validation is the most important step in the process. Validation & re-validation via an intricately designed process helps us finalize data-points to be used for final calculations.

The Brainy Insights interacts with leading companies and experts of the concerned domain to develop the analyst team’s market understanding and expertise. It improves and substantiates every single data presented in the market reports. The data validation interview and discussion panels are typically composed of the most experienced industry members. The participants include, however, are not limited to:
Moreover, we always validate our data and findings through primary respondents from all the major regions we are working on.


Free Customization
Fortune 500 Clients
Free Yearly Update On Purchase Of Multi/Corporate License
Companies Served Till Date