- +1-315-215-1633
- sales@thebrainyinsights.com

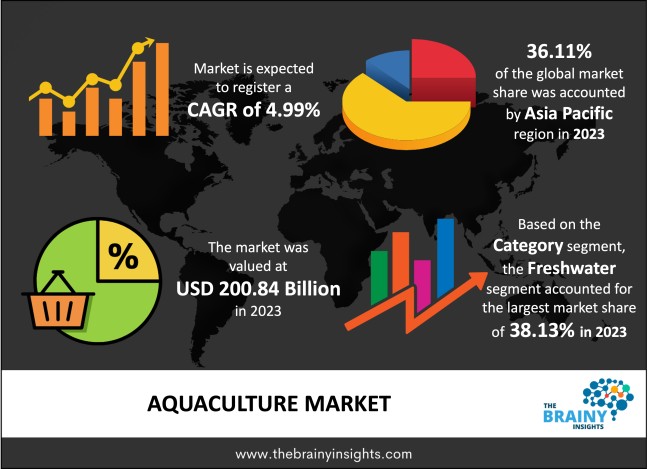
The global aquaculture market is expected to grow from USD 200.84 billion in 2023 to USD 326.79 billion by 2033, at a CAGR of 4.99% during the forecast period 2024-2033. Asia-Pacific dominated the market in 2023.
Aquaculture is referred to as the practice of raising and cultivating aquatic organisms. Aquaculture is practiced in rivers, coastal waters and freshwater ponds. Aquaculture has been practiced for thousands of years and has slowly evolved due to growing advancements. Due to its integration with its environmental, economic, social and cultural contexts has been growing for ages. Due to the increase, aquaculture now provides more than half of the world's fish for human consumption. The practice involves farming fish, crabs, molluscs, and plants. Several ways to increase productivity include predator protection, frequent stocking, feeding, etc. There are stages of the production process in aquaculture. The fish are bred and raised in the hatchery stage through their early life phases. The fish are then sent to farms and are harvested there using feeds. The fish are then sent to restaurants or grocery rates in the final stage.
Get an overview of this study by requesting a free sample
Increasing consumption of seafood: Over the past 50 years, global seafood consumption has steadily climbed. Several different factors influence each nation's seafood intake. It is well recognized that the major causes of the recent rise in global consumption of fishery products were rapid population expansion, rising incomes in some developing nations, and rising health consciousness in some affluent countries. The increasing consumption of seafood is attributed to growing awareness regarding protein intake, the health benefits of fish, lower prices, etc. Third, lower prices positively correlate with increased fish consumption in many Asian countries. Many people prefer seafood due to their taste preferences and dietary requirements.
Preference towards vegetarianism– Several consumers are gradually becoming more considerate towards animals. These consumers are thus adopting vegetarianism-based food practices. Therefore, many of them are avoiding seafood, impacting seafood sales. Thus, the increasing preference towards vegetarian food affects the market growth of aquaculture.
Increasing innovation in the aquaculture industry: The rising demand for seafood has put pressure on resources and sustainable fishing practices, necessitating the creative application of current and new technologies. Aquaculture could be on the verge of a transformation, with underwater drones providing fish farmers with eyes beneath the waves, allowing them to monitor water conditions and the correct equipment. Fortunately, with the advancement of technology, there is a lot of promise for sustainably producing this protein source. Aquaculture technologies, like those being introduced in other agricultural industries, are attracting the attention of farmers and investors. Many drones have sensors that move underwater and acquire data like pH, oxygen levels, salinity, and contaminants. These technologies are helping to improve industry efficiency by analyzing oxygen levels, water temperature and heart rate.
Stringent regulations for product approval – The regulations for product approval in aquaculture are stringent. The companies raising and cultivating fish must adhere to specific regional and global regulations. FDA regulations are necessary for aquaculture, and the companies must provide the aquaculture procedure details and the declaration of the chemical and fertilizers used. Hence, the companies involved in aquaculture must adhere to these regulations to gain higher market shares.
The regions analyzed for the market include North America, Europe, South America, Asia Pacific, the Middle East, and Africa. Asia-Pacific emerged as the most significant global Aquaculture market, with a revenue share of 36.11% in 2023. The region has a high market growth rate due to the increasing preference for seafood among the locals. The Asia-Pacific market will be driven by seafood industry investment to support the aquaculture market. Several countries have high amounts of water reserves, a fish culture resource. Also, many people are becoming health-conscious, which is leading to an increase in demand for seafood. The North American region is anticipated to grow lucratively during the forecast period. The rise in investment in the aquaculture industry and increasing advancements in the infrastructure will likely provide more growth opportunities to the aquaculture market in the region.
Asia-Pacific region Aquaculture Market Share in 2023 - 36.11%
www.thebrainyinsights.com
Check the geographical analysis of this market by requesting a free sample
The category segment is divided into freshwater, marine water and brackish water. The freshwater segment dominated the market with a revenue share of 38.13% in 2023. Freshwater aquaculture, which is significant to the aquaculture business, is cultivating and breeding aquatic creatures and plants for economic gain. Many people prefer seafood which is prepared using fish produced in freshwater.
The fish type segment includes molluscs, carp, mackerels, crustaceans, sea bream and others. The molluscs segment dominated the market with a revenue share of 34.55% in 2023. Molluscs are considered a high protein source. Fitness enthusiasts prefer to consume molluscs due to their high nutritional content.
The product type segment includes chemicals, pharmaceuticals, fertilizers and equipment. The food equipment segment includes water pumps and filters, cleaning equipment, feeders, containment equipment, water circulating and aerating equipment and others. The equipment segment dominated the market with a revenue share of 43.42% in 2023. Aquaculture equipment is mainly used for breeding fish. These equipment are necessary for various applications such as pumping water, building a pond, testing water and others.
| Attribute | Description |
|---|---|
| Market Size | Revenue (USD Billion) |
| Market size value in 2023 | USD 200.84 Billion |
| Market size value in 2033 | USD 326.79 Billion |
| CAGR (2024 to 2033) | 4.99% |
| Historical data | 2020-2022 |
| Base Year | 2023 |
| Forecast | 2024-2033 |
| Region | The regions examined for the market are Europe, Asia Pacific, North America, South America, and Middle East & Africa. |
| Segments | The research segment is based on category, fish type, and product type. |
As per The Brainy Insights, the size of the aquaculture market was valued USD 200.84 billion in 2023 to USD 326.79 billion by 2033.
Global aquaculture market is growing at a CAGR of 4.99% during the forecast period 2024-2033.
Asia-Pacific region emerged as the largest market for the aquaculture.
The market's growth will be influenced by the growing demand for seafood.
The rising vegetarian population could hamper the market growth.
The increasing investment in aquaculture industry is providing huge opportunities to the market.
1. Introduction
1.1. Objectives of the Study
1.2. Market Definition
1.3. Research Scope
1.4. Currency
1.5. Key Target Audience
2. Research Methodology and Assumptions
3. Executive Summary
4. Premium Insights
4.1. Porter’s Five Forces Analysis
4.2. Value Chain Analysis
4.3. Top Investment Pockets
4.3.1. Market Attractiveness Analysis By Category
4.3.2. Market Attractiveness Analysis By Fish Type
4.3.3. Market Attractiveness Analysis By Product Type
4.3.4. Market Attractiveness Analysis By Region
4.4. Industry Trends
5. Market Dynamics
5.1. Market Evaluation
5.2. Drivers
5.2.1. Increasing consumption of seafood
5.3. Restraints
5.3.1. Preference towards vegetarianism
5.4. Opportunities
5.4.1. Increasing investment in aquaculture industry
5.5. Challenges
5.5.1. Stringent regulations for product approval
6. Global Aquaculture Market Analysis and Forecast, By Category
6.1. Segment Overview
6.2. Fresh Water
6.3. Marine Water
6.4. Brackish Water
7. Global Aquaculture Market Analysis and Forecast, By Fish Type
7.1. Segment Overview
7.2. Molluscs
7.3. Carps
7.4. Mackerels
7.5. Crustaceans
7.6. Sea Bream
7.7. Others
8. Global Aquaculture Market Analysis and Forecast, By Product Type
8.1. Segment Overview
8.2. Chemical
8.3. Pharmaceuticals
8.4. Fertilizers
8.5. Equipment
8.5.1. Water Pump and Filters
8.5.2. Cleaning Equipment
8.5.3. Feeders
8.5.4. Containment Equipment
8.5.5. Water Circulating and Aerating Equipment
8.5.6. Others
9. Global Aquaculture Market Analysis and Forecast, By Regional Analysis
9.1. Segment Overview
9.2. North America
9.2.1. U.S.
9.2.2. Canada
9.2.3. Mexico
9.3. Europe
9.3.1. Germany
9.3.2. France
9.3.3. U.K.
9.3.4. Italy
9.3.5. Spain
9.4. Asia-Pacific
9.4.1. Japan
9.4.2. China
9.4.3. India
9.5. South America
9.5.1. Brazil
9.6. Middle East and Africa
9.6.1. UAE
9.6.2. South Africa
10. Global Aquaculture Market-Competitive Landscape
10.1. Overview
10.2. Market Share of Key Players in the Aquaculture Market
10.2.1. Global Company Market Share
10.2.2. North America Company Market Share
10.2.3. Europe Company Market Share
10.2.4. APAC Company Market Share
10.3. Competitive Situations and Trends
10.3.1. Product Launches and Developments
10.3.2. Partnerships, Collaborations, and Agreements
10.3.3. Mergers & Acquisitions
10.3.4. Expansions
11. Company Profiles
11.1. Alpha Group Ltd.
11.1.1. Business Overview
11.1.2. Company Snapshot
11.1.3. Company Market Share Analysis
11.1.4. Company Product Portfolio
11.1.5. Recent Developments
11.1.6. SWOT Analysis
11.2. Cermaq Group As
11.2.1. Business Overview
11.2.2. Company Snapshot
11.2.3. Company Market Share Analysis
11.2.4. Company Product Portfolio
11.2.5. Recent Developments
11.2.6. SWOT Analysis
11.3. Aquaculture Technologies Asia Limited
11.3.1. Business Overview
11.3.2. Company Snapshot
11.3.3. Company Market Share Analysis
11.3.4. Company Product Portfolio
11.3.5. Recent Developments
11.3.6. SWOT Analysis
11.4. Cooke Aquaculture
11.4.1. Business Overview
11.4.2. Company Snapshot
11.4.3. Company Market Share Analysis
11.4.4. Company Product Portfolio
11.4.5. Recent Developments
11.4.6. SWOT Analysis
11.5. Marine Harvest Asa
11.5.1. Business Overview
11.5.2. Company Snapshot
11.5.3. Company Market Share Analysis
11.5.4. Company Product Portfolio
11.5.5. Recent Developments
11.5.6. SWOT Analysis
11.6. Leroy Seafood Group Asa
11.6.1. Business Overview
11.6.2. Company Snapshot
11.6.3. Company Market Share Analysis
11.6.4. Company Product Portfolio
11.6.5. Recent Developments
11.6.6. SWOT Analysis
11.7. Nippon Suisan Kaisha Ltd.
11.7.1. Business Overview
11.7.2. Company Snapshot
11.7.3. Company Market Share Analysis
11.7.4. Company Product Portfolio
11.7.5. Recent Developments
11.7.6. SWOT Analysis
11.8. P/F Bakkafrost
1.1.1. Business Overview
1.1.2. Company Snapshot
1.1.3. Company Market Share Analysis
1.1.4. Company Product Portfolio
1.1.5. Recent Developments
1.1.6. SWOT Analysis
11.9. Tassal Group Limited
11.9.1. Business Overview
11.9.2. Company Snapshot
11.9.3. Company Market Share Analysis
11.9.4. Company Product Portfolio
11.9.5. Recent Developments
11.9.6. SWOT Analysis
11.10. Nireus S.A. Ltd.
11.10.1. Business Overview
11.10.2. Company Snapshot
11.10.3. Company Market Share Analysis
11.10.4. Company Product Portfolio
11.10.5. Recent Developments
11.10.6. SWOT Analysis
11.11. Dainichi Corporation
11.11.1. Business Overview
11.11.2. Company Snapshot
11.11.3. Company Market Share Analysis
11.11.4. Company Product Portfolio
11.11.5. Recent Developments
11.11.6. SWOT Analysis
11.12. SalMar ASA
11.12.1. Business Overview
11.12.2. Company Snapshot
11.12.3. Company Market Share Analysis
11.12.4. Company Product Portfolio
11.12.5. Recent Developments
11.12.6. SWOT Analysis
11.13. Norway Royal Samson ASA
11.13.1. Business Overview
11.13.2. Company Snapshot
11.13.3. Company Market Share Analysis
11.13.4. Company Product Portfolio
11.13.5. Recent Developments
11.13.6. SWOT Analysis
List of Table
1. Global Aquaculture Market, By Category, 2020-2033 (USD Billion)
2. Global Fresh Water, Aquaculture Market, By Region, 2020-2033 (USD Billion)
3. Global Marine Water, Aquaculture Market, By Region, 2020-2033 (USD Billion)
4. Global Brackish Water, Aquaculture Market, By Region, 2020-2033 (USD Billion)
5. Global Aquaculture Market, By Fish Type, 2020-2033 (USD Billion)
6. Global Molluscs, Aquaculture Market, By Region, 2020-2033 (USD Billion)
7. Global Carps, Aquaculture Market, By Region, 2020-2033 (USD Billion)
8. Global Mackerels, Aquaculture Market, By Region, 2020-2033 (USD Billion)
9. Global Crustaceans, Aquaculture Market, By Region, 2020-2033 (USD Billion)
10. Global Sea Bream, Aquaculture Market, By Region, 2020-2033 (USD Billion)
11. Global Others, Aquaculture Market, By Region, 2020-2033 (USD Billion)
12. Global Aquaculture Market, By Product Type, 2020-2033 (USD Billion)
13. Global Chemical, Aquaculture Market, By Region, 2020-2033 (USD Billion)
14. Global Pharmaceuticals, Aquaculture Market, By Region, 2020-2033 (USD Billion)
15. Global Fertilizers, Aquaculture Market, By Region, 2020-2033 (USD Billion)
16. Global Equipment, Aquaculture Market, By Region, 2020-2033 (USD Billion)
17. Global Aquaculture Market, By Region, 2020-2033 (USD Billion)
18. North America Aquaculture Market, By Category, 2020-2033 (USD Billion)
19. North America Aquaculture Market, By Fish Type, 2020-2033 (USD Billion)
20. North America Aquaculture Market, By Product Type, 2020-2033 (USD Billion)
21. U.S. Aquaculture Market, By Category, 2020-2033 (USD Billion)
22. U.S. Aquaculture Market, By Fish Type, 2020-2033 (USD Billion)
23. U.S. Aquaculture Market, By Product Type, 2020-2033 (USD Billion)
24. Canada Aquaculture Market, By Category, 2020-2033 (USD Billion)
25. Canada Aquaculture Market, By Fish Type, 2020-2033 (USD Billion)
26. Canada Aquaculture Market, By Product Type, 2020-2033 (USD Billion)
27. Mexico Aquaculture Market, By Category, 2020-2033 (USD Billion)
28. Mexico Aquaculture Market, By Fish Type, 2020-2033 (USD Billion)
29. Mexico Aquaculture Market, By Product Type, 2020-2033 (USD Billion)
30. Europe Aquaculture Market, By Category, 2020-2033 (USD Billion)
31. Europe Aquaculture Market, By Fish Type, 2020-2033 (USD Billion)
32. Europe Aquaculture Market, By Product Type, 2020-2033 (USD Billion)
33. Germany Aquaculture Market, By Category, 2020-2033 (USD Billion)
34. Germany Aquaculture Market, By Fish Type, 2020-2033 (USD Billion)
35. Germany Aquaculture Market, By Product Type, 2020-2033 (USD Billion)
36. France Aquaculture Market, By Category, 2020-2033 (USD Billion)
37. France Aquaculture Market, By Fish Type, 2020-2033 (USD Billion)
38. France Aquaculture Market, By Product Type, 2020-2033 (USD Billion)
39. U.K. Aquaculture Market, By Category, 2020-2033 (USD Billion)
40. U.K. Aquaculture Market, By Fish Type, 2020-2033 (USD Billion)
41. U.K. Aquaculture Market, By Product Type, 2020-2033 (USD Billion)
42. Italy Aquaculture Market, By Category, 2020-2033 (USD Billion)
43. Italy Aquaculture Market, By Fish Type, 2020-2033 (USD Billion)
44. Italy Aquaculture Market, By Product Type, 2020-2033 (USD Billion)
45. Spain Aquaculture Market, By Category, 2020-2033 (USD Billion)
46. Spain Aquaculture Market, By Fish Type, 2020-2033 (USD Billion)
47. Spain Aquaculture Market, By Product Type, 2020-2033 (USD Billion)
48. Asia Pacific Aquaculture Market, By Category, 2020-2033 (USD Billion)
49. Asia Pacific Aquaculture Market, By Fish Type, 2020-2033 (USD Billion)
50. Asia Pacific Aquaculture Market, By Product Type, 2020-2033 (USD Billion)
51. Japan Aquaculture Market, By Category, 2020-2033 (USD Billion)
52. Japan Aquaculture Market, By Fish Type, 2020-2033 (USD Billion)
53. Japan Aquaculture Market, By Product Type, 2020-2033 (USD Billion)
54. China Aquaculture Market, By Category, 2020-2033 (USD Billion)
55. China Aquaculture Market, By Fish Type, 2020-2033 (USD Billion)
56. China Aquaculture Market, By Product Type, 2020-2033 (USD Billion)
57. India Aquaculture Market, By Category, 2020-2033 (USD Billion)
58. India Aquaculture Market, By Fish Type, 2020-2033 (USD Billion)
59. India Aquaculture Market, By Product Type, 2020-2033 (USD Billion)
60. South America Aquaculture Market, By Category, 2020-2033 (USD Billion)
61. South America Aquaculture Market, By Fish Type, 2020-2033 (USD Billion)
62. South America Aquaculture Market, By Product Type, 2020-2033 (USD Billion)
63. Brazil Aquaculture Market, By Category, 2020-2033 (USD Billion)
64. Brazil Aquaculture Market, By Fish Type, 2020-2033 (USD Billion)
65. Brazil Aquaculture Market, By Product Type, 2020-2033 (USD Billion)
66. Middle East and Africa Aquaculture Market, By Category, 2020-2033 (USD Billion)
67. Middle East and Africa Aquaculture Market, By Fish Type, 2020-2033 (USD Billion)
68. Middle East and Africa Aquaculture Market, By Product Type, 2020-2033 (USD Billion)
69. UAE Aquaculture Market, By Category, 2020-2033 (USD Billion)
70. UAE Aquaculture Market, By Fish Type, 2020-2033 (USD Billion)
71. UAE Aquaculture Market, By Product Type, 2020-2033 (USD Billion)
72. South Africa Aquaculture Market, By Category, 2020-2033 (USD Billion)
73. South Africa Aquaculture Market, By Fish Type, 2020-2033 (USD Billion)
74. South Africa Aquaculture Market, By Product Type, 2020-2033 (USD Billion)
List of Figures
1. Global Aquaculture Market Segmentation
2. Aquaculture Market: Research Methodology
3. Market Size Estimation Methodology: Bottom-Up Approach
4. Market Size Estimation Methodology: Top-Down Approach
5. Data Triangulation
6. Porter’s Five Forces Analysis
7. Value Chain Analysis
8. Global Aquaculture Market Attractiveness Analysis By Category
9. Global Aquaculture Market Attractiveness Analysis By Fish Type
10. Global Aquaculture Market Attractiveness Analysis By Product Type
11. Global Aquaculture Market Attractiveness Analysis By Region
12. Global Aquaculture Market: Dynamics
13. Global Aquaculture Market Share by Category (2023 & 2033)
14. Global Aquaculture Market Share by Fish Type (2023 & 2033)
15. Global Aquaculture Market Share by Product Type (2023 & 2033)
16. Global Aquaculture Market Share by Regions (2023 & 2033)
17. Global Aquaculture Market Share by Company (2023)
This study forecasts revenue at global, regional, and country levels from 2020 to 2033. The Brainy Insights has segmented the global aquaculture market based on below mentioned segments:
Global Aquaculture Market by Category:
Global Aquaculture Market by Fish Type:
Global Aquaculture Market by Product Type:
Global Aquaculture Market by Region:
Research has its special purpose to undertake marketing efficiently. In this competitive scenario, businesses need information across all industry verticals; the information about customer wants, market demand, competition, industry trends, distribution channels etc. This information needs to be updated regularly because businesses operate in a dynamic environment. Our organization, The Brainy Insights incorporates scientific and systematic research procedures in order to get proper market insights and industry analysis for overall business success. The analysis consists of studying the market from a miniscule level wherein we implement statistical tools which helps us in examining the data with accuracy and precision.
Our research reports feature both; quantitative and qualitative aspects for any market. Qualitative information for any market research process are fundamental because they reveal the customer needs and wants, usage and consumption for any product/service related to a specific industry. This in turn aids the marketers/investors in knowing certain perceptions of the customers. Qualitative research can enlighten about the different product concepts and designs along with unique service offering that in turn, helps define marketing problems and generate opportunities. On the other hand, quantitative research engages with the data collection process through interviews, e-mail interactions, surveys and pilot studies. Quantitative aspects for the market research are useful to validate the hypotheses generated during qualitative research method, explore empirical patterns in the data with the help of statistical tools, and finally make the market estimations.
The Brainy Insights offers comprehensive research and analysis, based on a wide assortment of factual insights gained through interviews with CXOs and global experts and secondary data from reliable sources. Our analysts and industry specialist assume vital roles in building up statistical tools and analysis models, which are used to analyse the data and arrive at accurate insights with exceedingly informative research discoveries. The data provided by our organization have proven precious to a diverse range of companies, facilitating them to address issues such as determining which products/services are the most appealing, whether or not customers use the product in the manner anticipated, the purchasing intentions of the market and many others.
Our research methodology encompasses an idyllic combination of primary and secondary initiatives. Key phases involved in this process are listed below:

The phase involves the gathering and collecting of market data and its related information with the help of different sources & research procedures.

The data procurement stage involves in data gathering and collecting through various data sources.
This stage involves in extensive research. These data sources includes:
Purchased Database: Purchased databases play a crucial role in estimating the market sizes irrespective of the domain. Our purchased database includes:
Primary Research: The Brainy Insights interacts with leading companies and experts of the concerned domain to develop the analyst team’s market understanding and expertise. It improves and substantiates every single data presented in the market reports. Primary research mainly involves in telephonic interviews, E-mail interactions and face-to-face interviews with the raw material providers, manufacturers/producers, distributors, & independent consultants. The interviews that we conduct provides valuable data on market size and industry growth trends prevailing in the market. Our organization also conducts surveys with the various industry experts in order to gain overall insights of the industry/market. For instance, in healthcare industry we conduct surveys with the pharmacists, doctors, surgeons and nurses in order to gain insights and key information of a medical product/device/equipment which the customers are going to usage. Surveys are conducted in the form of questionnaire designed by our own analyst team. Surveys plays an important role in primary research because surveys helps us to identify the key target audiences of the market. Additionally, surveys helps to identify the key target audience engaged with the market. Our survey team conducts the survey by targeting the key audience, thus gaining insights from them. Based on the perspectives of the customers, this information is utilized to formulate market strategies. Moreover, market surveys helps us to understand the current competitive situation of the industry. To be precise, our survey process typically involve with the 360 analysis of the market. This analytical process begins by identifying the prospective customers for a product or service related to the market/industry to obtain data on how a product/service could fit into customers’ lives.

Secondary Research: The secondary data sources includes information published by the on-profit organizations such as World bank, WHO, company fillings, investor presentations, annual reports, national government documents, statistical databases, blogs, articles, white papers and others. From the annual report, we analyse a company’s revenue to understand the key segment and market share of that organization in a particular region. We analyse the company websites and adopt the product mapping technique which is important for deriving the segment revenue. In the product mapping method, we select and categorize the products offered by the companies catering to domain specific market, deduce the product revenue for each of the companies so as to get overall estimation of the market size. We also source data and analyses trends based on information received from supply side and demand side intermediaries in the value chain. The supply side denotes the data gathered from supplier, distributor, wholesaler and the demand side illustrates the data gathered from the end customers for respective market domain.

The supply side for a domain specific market is analysed by:
The demand side for the market is estimated through:
In-house Library: Apart from these third-party sources, we have our in-house library of qualitative and quantitative information. Our in-house database includes market data for various industry and domains. These data are updated on regular basis as per the changing market scenario. Our library includes, historic databases, internal audit reports and archives.
Sometimes there are instances where there is no metadata or raw data available for any domain specific market. For those cases, we use our expertise to forecast and estimate the market size in order to generate comprehensive data sets. Our analyst team adopt a robust research technique in order to produce the estimates:
Data Synthesis: This stage involves the analysis & mapping of all the information obtained from the previous step. It also involves in scrutinizing the data for any discrepancy observed while data gathering related to the market. The data is collected with consideration to the heterogeneity of sources. Robust scientific techniques are in place for synthesizing disparate data sets and provide the essential contextual information that can orient market strategies. The Brainy Insights has extensive experience in data synthesis where the data passes through various stages:


Market Deduction & Formulation: The final stage comprises of assigning data points at appropriate market spaces so as to deduce feasible conclusions. Analyst perspective & subject matter expert based holistic form of market sizing coupled with industry analysis also plays a crucial role in this stage.
This stage involves in finalization of the market size and numbers that we have collected from data integration step. With data interpolation, it is made sure that there is no gap in the market data. Successful trend analysis is done by our analysts using extrapolation techniques, which provide the best possible forecasts for the market.
Data Validation & Market Feedback: Validation is the most important step in the process. Validation & re-validation via an intricately designed process helps us finalize data-points to be used for final calculations.

The Brainy Insights interacts with leading companies and experts of the concerned domain to develop the analyst team’s market understanding and expertise. It improves and substantiates every single data presented in the market reports. The data validation interview and discussion panels are typically composed of the most experienced industry members. The participants include, however, are not limited to:
Moreover, we always validate our data and findings through primary respondents from all the major regions we are working on.


Free Customization
Fortune 500 Clients
Free Yearly Update On Purchase Of Multi/Corporate License
Companies Served Till Date