- +1-315-215-1633
- sales@thebrainyinsights.com

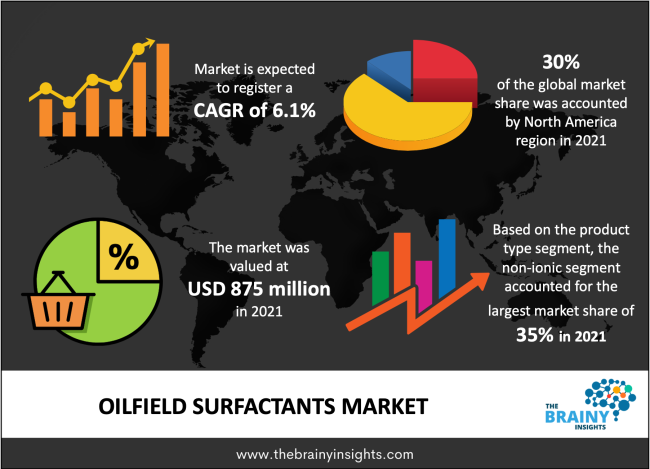
The oilfield surfactants market was estimated at around USD 875 million in 2021, growing at a CAGR of nearly 6.1% during 2022-2030. The market is projected to reach approximately USD 1,480 million by 2030.
Surfactants are substances that effectively reduce the surface tension between two fluids in an oil field, or between two fluids and a solid. Oilfield surfactants are utilized in a number of physical and chemical processes, including drilling, production, refining, increased oil recovery, and stimulation. Only a few of the applications include asphalting dispersants, corrosion prevention, emulsifiers, demulsifier intermediates, oil wetters, paraffin inhibitors, water-wetters, foamers, and defoamers. The type of surfactant behaviour is determined by the chemical structure, specifically the structural groups on the molecule. Due to the expanding oil and gas exploration across the world and the rising demand for energy by the residential and commercial sectors, there is an increased demand for international oilfield services. The equipment and services for well completion, well intervention, coiled tubing, pressure pumping, Oil Country Tubular Goods (OCTG), and wireline services are all considered oil field services. As a result, the demand for oilfield services in the global market for oilfield surfactants has increased due to the growth of oilfield services.
Get an overview of this study by requesting a free sample
Due to the global lockdown in many nations brought on by the COVID-19 epidemic, there has been a disruption in the global supply chain of many industrial items. Additionally, because of the unpredictability of the capital markets and the global economy, the coronavirus outbreak results in a decline in demand for industrial goods. In the oil and gas sector, surfactants are essential for fluid recovery, enhanced oil recovery, drilling, and other processes. As the world initially went into lockdowns, crude oil prices plunged to extremely low levels. Since 2020, as crude oil production increased, the surfactant sector has been slowly recovering. It is anticipated that this recovery will continue from 2022 through 2030.
Increasing production of oil & gas to accelerate the market’s growth
Global oil and natural gas production has been rising consistently over the past ten years, with oil reaching 92.6 million barrels per day (BPD), with the United States leading the world in oil production. These figures suggest that oilfield surfactants have a very substantial growth potential to fulfil this high demand capacity as oil production, extraction, and exploration activities expand. At different stages of drilling, production, and stimulation in oilfields, surfactants such emulsifiers, demulsifiers, biocides, etc. would be greatly in demand. Bio-based oilfield surfactants would also be in great demand as the globe intends to move toward a more sustainable and environmentally friendly future. Since Enhanced Oil Recovery (EOR) is only possible with the use of these surfactants, their use is growing in favor in the oil sector due to its ability to reduce costs and increase production.
The amount of oil and gas projects expanding throughout Europe will increase consumer demand
European power markets have begun to see unheard-of transformation. Baseload week-ahead prices have increased to €200 per megawatt-hour (MWh) in a number of European countries, which is nearly four times the historical norm. Power prices have reached new highs. The rise in natural gas and carbon prices, which are currently above €100 per MWh and €60 per metric ton, respectively, is largely to blame for this increase. The price of electricity generated by natural-gas power plants, which largely determines prices in European markets, has been impacted by this change. A tight supply-and-demand balance in the European power system and the uncertain output of renewable assets are causing price volatility to soar to new heights at the same time. To balance the supply and demand, new initiatives and government projects are being established. Thus, this will have an impact on the market for oilfield surfactants.
The oilfield surfactants market is segmented into the product, source, and application. By product, the non-ionic segment is anticipated to dominant the oilfield surfactants market during the forecast period. The primary element driving the expansion of the non-ionic segment has been the expanding oil exploration by oil and gas firms in developing countries. These surfactants are more affordable than other types of surfactants and are useful in the emulsification of fluids. These elements are anticipated to positively affect the non-ionic category's growth and help it become the fastest-growing section.
Based on source, the market for bio-based segment is estimated to lead the market during the forecast period. Compared to its competitors, bio-based oilfield surfactants are highly biodegradable and have a longer shelf life. The development of the oilfield surfactants market should be aided by low toxicity and high sustainability in relation to petroleum-based replacements coupled with rigorous regulations anticipated for the usage of bio-based products. In order to reduce pollution and educate consumers about the benefits of using bio-based products, biosurfactants are employed.
Based on application, the market for enhanced oil recovery segment is estimated to lead the market during the forecast period. Chemical approaches in enhanced oil recovery frequently involve surfactants. Because of the expanding population and industrialization, there are an increasing number of deep-water drilling projects worldwide. This supports the demand for chemicals used in enhanced oil recovery procedures, which has a direct impact on the demand for surfactants in the EOR application.
Throughout the projection period, North America is projected to stay one of the most alluring markets, accounting for the majority revenue share in the market. One of the main producers of crude oil worldwide is North America. Over the previous six years, the United States has been the world's leading oil producer, producing more than 19% of all crude oil produced worldwide in 2020. (as of 2021). The top five crude oil producers worldwide include Canada. One of the key factors in this market's supremacy has been the region's significant oil and gas presence.
The global Oilfield Surfactants Market is segmented as follows:
By Product
By Source
By Application
By Region/Geography
| Attribute | Description |
|---|---|
| Base Year | 2021 |
| Forecast period | 2022-2030 |
| Report Coverage | Revenue estimation and forecast, company profile, competitive landscape, growth factors, and recent trends |
| Regional scope | North America, Europe, Asia Pacific, Middle East & Africa, and Latin America |
| Market Size(unit) | USD Million |
| CAGR (2022 to 2030) | 6.1% |
| Segments Covered |
By Product |
1. Introduction
1.1. Objectives of the Study
1.2. Market Definition
1.3. Research Scope
2. Research Methodology and Assumptions
3. Executive Summary
4. Premium Insights
4.1. Porter’s Five Forces Analysis
4.2. Value Chain Analysis
4.3. Top Investment Pockets
4.3.1. Market Attractiveness Analysis By Product
4.3.2. Market Attractiveness Analysis By Source
4.3.3. Market Attractiveness Analysis By Application
4.4. Industry Trends
5. Market Dynamics
5.1. Market Evaluation
5.2. Drivers
5.2.1. Increasing production of oil & gas to accelerate the market’s growth
5.2.2. The amount of oil and gas projects expanding throughout Europe will increase consumer demand
5.3. Restrains
5.3.1. Costly biosurfactant production could impede industry expansion
5.4. Opportunities
5.4.1. Rising investments
6. Global Oilfield Surfactants Market Analysis and Forecast, By Product
6.1. Segment Overview
6.2. Anionic
6.3. Non-Ionic
6.4. Cationic
6.5. Amphoteric
6.6. Silicone
7. Global Oilfield Surfactants Market Analysis and Forecast, By Source
7.1. Segment Overview
7.2. Synthetic
7.3. Bio-Based
8. Global Oilfield Surfactants Market Analysis and Forecast, By Application
8.1. Segment Overview
8.2. Stimulation Flowback/ Fluid Recovery
8.3. Enhanced Oil Recovery
8.4. Foamers
8.5. Drilling Surfactants
8.6. Rig Wash Solutions/Cleaners
8.7. Wetting Agents
8.8. Surface Active Materials
8.9. Emulsion Breakers
8.10. Non-Emulsifiers
8.11. Spacers
9. Global Oilfield Surfactants Market Analysis and Forecast, By Regional Analysis
9.1. Segment Overview
9.2. North America
9.2.1. U.S.
9.2.2. Canada
9.2.3. Mexico
9.3. Europe
9.3.1. Germany
9.3.2. France
9.3.3. U.K.
9.3.4. Italy
9.3.5. Spain
9.3.6. Rest of Europe
9.4. Asia-Pacific
9.4.1. Japan
9.4.2. China
9.4.3. India
9.4.4. Australia
9.4.5. South Korea
9.4.6. Rest of Asia-Pacific
9.5. South America
9.5.1. Brazil
9.5.2. Argentina
9.5.3. Rest of South America
9.6. Middle East and Africa
9.6.1. UAE
9.6.2. South Africa
9.6.3. Egypt
9.6.4. Kuwait
9.6.5. Saudi Arabia
9.6.6. Rest of Middle East & Africa
10. Global Oilfield Surfactants Market-Competitive Landscape
10.1. Overview
10.2. Market Share of Key Players in the Oilfield Surfactants market
10.2.1. Global Company Market Share
10.2.2. North America Company Market Share
10.2.3. Europe Company Market Share
10.2.4. APAC Company Market Share
10.3. Competitive Situations and Trends
10.3.1. Product Launches and Developments
10.3.2. Partnerships, Collaborations, and Agreements
10.3.3. Mergers & Acquisitions
10.3.4. Expansions
11. Company Profiles
11.1. CP Kelco Oil Field Group
11.1.1. Business Overview
11.1.2. Company Snapshot
11.1.3. Company Market Share Analysis
11.1.4. Company Source Portfolio
11.1.5. Recent Developments
11.1.6. SWOT Analysis
11.2. Huntsman Corporation
11.2.1. Business Overview
11.2.2. Company Snapshot
11.2.3. Company Market Share Analysis
11.2.4. Company Source Portfolio
11.2.5. Recent Developments
11.2.6. SWOT Analysis
11.3. Croda International PLC
11.3.1. Business Overview
11.3.2. Company Snapshot
11.3.3. Company Market Share Analysis
11.3.4. Company Source Portfolio
11.3.5. Recent Developments
11.3.6. SWOT Analysis
11.4. Weatherford International
11.4.1. Business Overview
11.4.2. Company Snapshot
11.4.3. Company Market Share Analysis
11.4.4. Company Source Portfolio
11.4.5. Recent Developments
11.4.6. SWOT Analysis
11.5. Stepan Company
11.5.1. Business Overview
11.5.2. Company Snapshot
11.5.3. Company Market Share Analysis
11.5.4. Company Source Portfolio
11.5.5. Recent Developments
11.5.6. SWOT Analysis
11.6. Evonik Industries AG
11.6.1. Business Overview
11.6.2. Company Snapshot
11.6.3. Company Market Share Analysis
11.6.4. Company Source Portfolio
11.6.5. Recent Developments
11.6.6. SWOT Analysis
11.7. Flotek Industries
11.7.1. Business Overview
11.7.2. Company Snapshot
11.7.3. Company Market Share Analysis
11.7.4. Company Source Portfolio
11.7.5. Recent Developments
11.7.6. SWOT Analysis
11.8. DowDupont
11.8.1. Business Overview
11.8.2. Company Snapshot
11.8.3. Company Market Share Analysis
11.8.4. Company Source Portfolio
11.8.5. Recent Developments
11.8.6. SWOT Analysis
11.9. Schlumberger
11.9.1. Business Overview
11.9.2. Company Snapshot
11.9.3. Company Market Share Analysis
11.9.4. Company Source Portfolio
11.9.5. Recent Developments
11.9.6. SWOT Analysis
11.10. Halliburton
11.10.1. Business Overview
11.10.2. Company Snapshot
11.10.3. Company Market Share Analysis
11.10.4. Company Source Portfolio
11.10.5. Recent Developments
11.10.6. SWOT Analysis
List of Table
1. Global Oilfield Surfactants Market, By Product, 2022-2030(USD Million)
2. Global Anionic Oilfield Surfactants Market, By Region, 2022-2030(USD Million)
3. Global Non-Ionic Oilfield Surfactants Market, By Region, 2022-2030(USD Million)
4. Global Cationic Oilfield Surfactants Market, By Region, 2022-2030(USD Million)
5. Global Amphoteric Oilfield Surfactants Market, By Region, 2022-2030(USD Million)
6. Global Silicone Oilfield Surfactants Market, By Region, 2022-2030(USD Million)
7. Global Oilfield Surfactants Market, By Source, 2022-2030(USD Million)
8. Global Synthetic Oilfield Surfactants Market, By Region, 2022-2030(USD Million)
9. Global Bio-Based Oilfield Surfactants Market, By Region, 2022-2030(USD Million)
10. Global Oilfield Surfactants Market, By Application, 2022-2030(USD Million)
11. Global Stimulation Flowback/ Fluid Recovery Oilfield Surfactants Market, By Region, 2022-2030(USD Million)
12. Global Enhanced Oil Recovery Oilfield Surfactants Market, By Region, 2022-2030(USD Million)
13. Global Foamers Oilfield Surfactants Market, By Region, 2022-2030(USD Million)
14. Global Drilling Surfactants Oilfield Surfactants Market, By Region, 2022-2030(USD Million)
15. Global Rig Wash Solutions/Cleaners Oilfield Surfactants Market, By Region, 2022-2030(USD Million)
16. Global Wetting Agents Oilfield Surfactants Market, By Region, 2022-2030(USD Million)
17. Global Surface Active Materials Oilfield Surfactants Market, By Region, 2022-2030(USD Million)
18. Global Emulsion Breakers Oilfield Surfactants Market, By Region, 2022-2030(USD Million)
19. Global Non-Emulsifiers Oilfield Surfactants Market, By Region, 2022-2030(USD Million)
20. Global Spacers Oilfield Surfactants Market, By Region, 2022-2030(USD Million)
21. Global Oilfield Surfactants Market, By Region, 2022-2030(USD Million)
22. Global Oilfield Surfactants Market, By North America, 2022-2030(USD Million)
23. North America Oilfield Surfactants Market, By Product, 2022-2030(USD Million)
24. North America Oilfield Surfactants Market, By Source, 2022-2030(USD Million)
25. North America Oilfield Surfactants Market, By Application, 2022-2030(USD Million)
26. U.S. Oilfield Surfactants Market, By Product, 2022-2030(USD Million)
27. U.S. Oilfield Surfactants Market, By Source, 2022-2030(USD Million)
28. U.S. Oilfield Surfactants Market, By Application, 2022-2030(USD Million)
29. Canada Oilfield Surfactants Market, By Product, 2022-2030(USD Million)
30. Canada Oilfield Surfactants Market, By Source, 2022-2030(USD Million)
31. Canada Oilfield Surfactants Market, By Application, 2022-2030(USD Million)
32. Mexico Oilfield Surfactants Market, By Product, 2022-2030(USD Million)
33. Mexico Oilfield Surfactants Market, By Source, 2022-2030(USD Million)
34. Mexico Oilfield Surfactants Market, By Application, 2022-2030(USD Million)
35. Europe Oilfield Surfactants Market, By Product, 2022-2030(USD Million)
36. Europe Oilfield Surfactants Market, By Source, 2022-2030(USD Million)
37. Europe Oilfield Surfactants Market, By Application, 2022-2030(USD Million)
38. Germany Oilfield Surfactants Market, By Product, 2022-2030(USD Million)
39. Germany Oilfield Surfactants Market, By Source, 2022-2030(USD Million)
40. Germany Oilfield Surfactants Market, By Application, 2022-2030(USD Million)
41. France Oilfield Surfactants Market, By Product, 2022-2030(USD Million)
42. France Oilfield Surfactants Market, By Source, 2022-2030(USD Million)
43. France Oilfield Surfactants Market, By Application, 2022-2030(USD Million)
44. U.K. Oilfield Surfactants Market, By Product, 2022-2030(USD Million)
45. U.K. Oilfield Surfactants Market, By Source, 2022-2030(USD Million)
46. U.K. Oilfield Surfactants Market, By Application, 2022-2030(USD Million)
47. Italy Oilfield Surfactants Market, By Product, 2022-2030(USD Million)
48. Italy Oilfield Surfactants Market, By Source, 2022-2030(USD Million)
49. Italy Oilfield Surfactants Market, By Application, 2022-2030(USD Million)
50. Spain Oilfield Surfactants Market, By Product, 2022-2030(USD Million)
51. Spain Oilfield Surfactants Market, By Source, 2022-2030(USD Million)
52. Spain Oilfield Surfactants Market, By Application, 2022-2030(USD Million)
53. Rest of Europe Oilfield Surfactants Market, By Product, 2022-2030(USD Million)
54. Rest of Europe Oilfield Surfactants Market, By Source, 2022-2030(USD Million)
55. Rest of Europe Oilfield Surfactants Market, By Application, 2022-2030(USD Million)
56. Asia Pacific Oilfield Surfactants Market, By Product, 2022-2030(USD Million)
57. Asia Pacific Oilfield Surfactants Market, By Source, 2022-2030(USD Million)
58. Asia Pacific Oilfield Surfactants Market, By Application, 2022-2030(USD Million)
59. Japan Oilfield Surfactants Market, By Product, 2022-2030(USD Million)
60. Japan Oilfield Surfactants Market, By Source, 2022-2030(USD Million)
61. Japan Oilfield Surfactants Market, By Application, 2022-2030(USD Million)
62. China Oilfield Surfactants Market, By Product, 2022-2030(USD Million)
63. China Oilfield Surfactants Market, By Source, 2022-2030(USD Million)
64. China Oilfield Surfactants Market, By Application, 2022-2030(USD Million)
65. India Oilfield Surfactants Market, By Product, 2022-2030(USD Million)
66. India Oilfield Surfactants Market, By Source, 2022-2030(USD Million)
67. India Oilfield Surfactants Market, By Application, 2022-2030(USD Million)
68. Australia Oilfield Surfactants Market, By Product, 2022-2030(USD Million)
69. Australia Oilfield Surfactants Market, By Source, 2022-2030(USD Million)
70. Australia Oilfield Surfactants Market, By Application, 2022-2030(USD Million)
71. South Korea Oilfield Surfactants Market, By Product, 2022-2030(USD Million)
72. South Korea Oilfield Surfactants Market, By Source, 2022-2030(USD Million)
73. South Korea Oilfield Surfactants Market, By Application, 2022-2030(USD Million)
74. Rest of Asia-Pacific Oilfield Surfactants Market, By Product, 2022-2030(USD Million)
75. Rest of Asia-Pacific Oilfield Surfactants Market, By Source, 2022-2030(USD Million)
76. Rest of Asia-Pacific Oilfield Surfactants Market, By Application, 2022-2030(USD Million)
77. South America Oilfield Surfactants Market, By Product, 2022-2030(USD Million)
78. South America Oilfield Surfactants Market, By Source, 2022-2030(USD Million)
79. South America Oilfield Surfactants Market, By Application, 2022-2030(USD Million)
80. Brazil Oilfield Surfactants Market, By Product, 2022-2030(USD Million)
81. Brazil Oilfield Surfactants Market, By Source, 2022-2030(USD Million)
82. Brazil Oilfield Surfactants Market, By Application, 2022-2030(USD Million)
83. Argentina Oilfield Surfactants Market, By Product, 2022-2030(USD Million)
84. Argentina Oilfield Surfactants Market, By Source, 2022-2030(USD Million)
85. Argentina Oilfield Surfactants Market, By Application, 2022-2030(USD Million)
86. Rest of Latin America Oilfield Surfactants Market, By Product, 2022-2030(USD Million)
87. Rest of Latin America Oilfield Surfactants Market, By Source, 2022-2030(USD Million)
88. Rest of Latin America Oilfield Surfactants Market, By Application, 2022-2030(USD Million)
89. Middle East and Africa Oilfield Surfactants Market, By Product, 2022-2030(USD Million)
90. Middle East and Africa Oilfield Surfactants Market, By Source, 2022-2030(USD Million)
91. Middle East and Africa Oilfield Surfactants Market, By Application, 2022-2030(USD Million)
92. UAE Oilfield Surfactants Market, By Product, 2022-2030(USD Million)
93. UAE Oilfield Surfactants Market, By Source, 2022-2030(USD Million)
94. UAE Oilfield Surfactants Market, By Application, 2022-2030(USD Million)
95. South Africa Oilfield Surfactants Market, By Product, 2022-2030(USD Million)
96. South Africa Oilfield Surfactants Market, By Source, 2022-2030(USD Million)
97. South Africa Oilfield Surfactants Market, By Application, 2022-2030(USD Million)
98. Egypt Oilfield Surfactants Market, By Product, 2022-2030(USD Million)
99. Egypt Oilfield Surfactants Market, By Source, 2022-2030(USD Million)
100. Egypt Oilfield Surfactants Market, By Application, 2022-2030(USD Million)
101. Kuwait Oilfield Surfactants Market, By Product, 2022-2030(USD Million)
102. Kuwait Oilfield Surfactants Market, By Source, 2022-2030(USD Million)
103. Kuwait Oilfield Surfactants Market, By Application, 2022-2030(USD Million)
104. Saudi Arabia Oilfield Surfactants Market, By Product, 2022-2030(USD Million)
105. Saudi Arabia Oilfield Surfactants Market, By Source, 2022-2030(USD Million)
106. Saudi Arabia Oilfield Surfactants Market, By Application, 2022-2030(USD Million)
107. Rest of Middle East Oilfield Surfactants Market, By Product, 2022-2030(USD Million)
108. Rest of Middle East Oilfield Surfactants Market, By Source, 2022-2030(USD Million)
109. Rest of Middle East Oilfield Surfactants Market, By Application, 2022-2030(USD Million)
List of Figures
1. Global Oilfield Surfactants Market Segmentation
2. Oilfield Surfactants Market: Research Methodology
3. Market Size Estimation Methodology: Bottom-Up Approach
4. Market Size Estimation Methodology: Top-Down Approach
5. Data Triangulation
6. Porter’s Five Forces Analysis
7. Value Chain Analysis
8. Global Oilfield Surfactants Market Attractiveness Analysis By Product
9. Global Oilfield Surfactants Market Attractiveness Analysis By Source
10. Global Oilfield Surfactants Market Attractiveness Analysis By Application
11. Global Oilfield Surfactants Market Attractiveness Analysis By Region
12. Global Oilfield Surfactants Market: Dynamics
13. Global Oilfield Surfactants Market Share By Product(2022 & 2030)
14. Global Oilfield Surfactants Market Share By Source(2022 & 2030)
15. Global Oilfield Surfactants Market Share By Application(2022 & 2030)
16. Global Oilfield Surfactants Market Share by Regions (2022 & 2030)
17. Global Oilfield Surfactants Market Share by Company (2021)
By Product
By Source
By Application
By Region/Geography
Research has its special purpose to undertake marketing efficiently. In this competitive scenario, businesses need information across all industry verticals; the information about customer wants, market demand, competition, industry trends, distribution channels etc. This information needs to be updated regularly because businesses operate in a dynamic environment. Our organization, The Brainy Insights incorporates scientific and systematic research procedures in order to get proper market insights and industry analysis for overall business success. The analysis consists of studying the market from a miniscule level wherein we implement statistical tools which helps us in examining the data with accuracy and precision.
Our research reports feature both; quantitative and qualitative aspects for any market. Qualitative information for any market research process are fundamental because they reveal the customer needs and wants, usage and consumption for any product/service related to a specific industry. This in turn aids the marketers/investors in knowing certain perceptions of the customers. Qualitative research can enlighten about the different product concepts and designs along with unique service offering that in turn, helps define marketing problems and generate opportunities. On the other hand, quantitative research engages with the data collection process through interviews, e-mail interactions, surveys and pilot studies. Quantitative aspects for the market research are useful to validate the hypotheses generated during qualitative research method, explore empirical patterns in the data with the help of statistical tools, and finally make the market estimations.
The Brainy Insights offers comprehensive research and analysis, based on a wide assortment of factual insights gained through interviews with CXOs and global experts and secondary data from reliable sources. Our analysts and industry specialist assume vital roles in building up statistical tools and analysis models, which are used to analyse the data and arrive at accurate insights with exceedingly informative research discoveries. The data provided by our organization have proven precious to a diverse range of companies, facilitating them to address issues such as determining which products/services are the most appealing, whether or not customers use the product in the manner anticipated, the purchasing intentions of the market and many others.
Our research methodology encompasses an idyllic combination of primary and secondary initiatives. Key phases involved in this process are listed below:

The phase involves the gathering and collecting of market data and its related information with the help of different sources & research procedures.

The data procurement stage involves in data gathering and collecting through various data sources.
This stage involves in extensive research. These data sources includes:
Purchased Database: Purchased databases play a crucial role in estimating the market sizes irrespective of the domain. Our purchased database includes:
Primary Research: The Brainy Insights interacts with leading companies and experts of the concerned domain to develop the analyst team’s market understanding and expertise. It improves and substantiates every single data presented in the market reports. Primary research mainly involves in telephonic interviews, E-mail interactions and face-to-face interviews with the raw material providers, manufacturers/producers, distributors, & independent consultants. The interviews that we conduct provides valuable data on market size and industry growth trends prevailing in the market. Our organization also conducts surveys with the various industry experts in order to gain overall insights of the industry/market. For instance, in healthcare industry we conduct surveys with the pharmacists, doctors, surgeons and nurses in order to gain insights and key information of a medical product/device/equipment which the customers are going to usage. Surveys are conducted in the form of questionnaire designed by our own analyst team. Surveys plays an important role in primary research because surveys helps us to identify the key target audiences of the market. Additionally, surveys helps to identify the key target audience engaged with the market. Our survey team conducts the survey by targeting the key audience, thus gaining insights from them. Based on the perspectives of the customers, this information is utilized to formulate market strategies. Moreover, market surveys helps us to understand the current competitive situation of the industry. To be precise, our survey process typically involve with the 360 analysis of the market. This analytical process begins by identifying the prospective customers for a product or service related to the market/industry to obtain data on how a product/service could fit into customers’ lives.

Secondary Research: The secondary data sources includes information published by the on-profit organizations such as World bank, WHO, company fillings, investor presentations, annual reports, national government documents, statistical databases, blogs, articles, white papers and others. From the annual report, we analyse a company’s revenue to understand the key segment and market share of that organization in a particular region. We analyse the company websites and adopt the product mapping technique which is important for deriving the segment revenue. In the product mapping method, we select and categorize the products offered by the companies catering to domain specific market, deduce the product revenue for each of the companies so as to get overall estimation of the market size. We also source data and analyses trends based on information received from supply side and demand side intermediaries in the value chain. The supply side denotes the data gathered from supplier, distributor, wholesaler and the demand side illustrates the data gathered from the end customers for respective market domain.

The supply side for a domain specific market is analysed by:
The demand side for the market is estimated through:
In-house Library: Apart from these third-party sources, we have our in-house library of qualitative and quantitative information. Our in-house database includes market data for various industry and domains. These data are updated on regular basis as per the changing market scenario. Our library includes, historic databases, internal audit reports and archives.
Sometimes there are instances where there is no metadata or raw data available for any domain specific market. For those cases, we use our expertise to forecast and estimate the market size in order to generate comprehensive data sets. Our analyst team adopt a robust research technique in order to produce the estimates:
Data Synthesis: This stage involves the analysis & mapping of all the information obtained from the previous step. It also involves in scrutinizing the data for any discrepancy observed while data gathering related to the market. The data is collected with consideration to the heterogeneity of sources. Robust scientific techniques are in place for synthesizing disparate data sets and provide the essential contextual information that can orient market strategies. The Brainy Insights has extensive experience in data synthesis where the data passes through various stages:


Market Deduction & Formulation: The final stage comprises of assigning data points at appropriate market spaces so as to deduce feasible conclusions. Analyst perspective & subject matter expert based holistic form of market sizing coupled with industry analysis also plays a crucial role in this stage.
This stage involves in finalization of the market size and numbers that we have collected from data integration step. With data interpolation, it is made sure that there is no gap in the market data. Successful trend analysis is done by our analysts using extrapolation techniques, which provide the best possible forecasts for the market.
Data Validation & Market Feedback: Validation is the most important step in the process. Validation & re-validation via an intricately designed process helps us finalize data-points to be used for final calculations.

The Brainy Insights interacts with leading companies and experts of the concerned domain to develop the analyst team’s market understanding and expertise. It improves and substantiates every single data presented in the market reports. The data validation interview and discussion panels are typically composed of the most experienced industry members. The participants include, however, are not limited to:
Moreover, we always validate our data and findings through primary respondents from all the major regions we are working on.


Free Customization
Fortune 500 Clients
Free Yearly Update On Purchase Of Multi/Corporate License
Companies Served Till Date