- +1-315-215-1633
- sales@thebrainyinsights.com

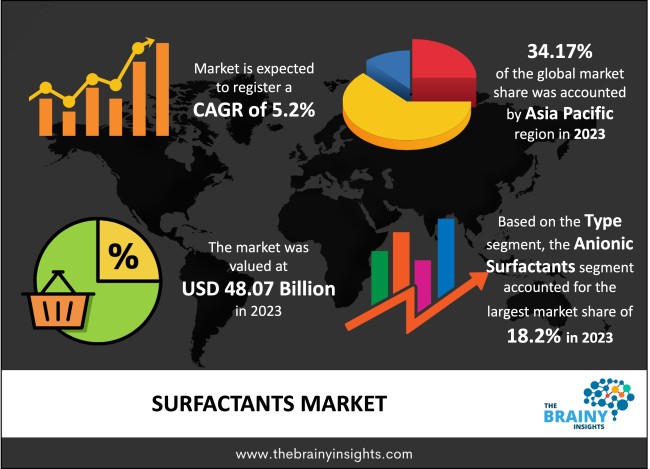
The global surfactants market was valued at USD 48.07 billion in 2023 and growing at a CAGR of 5.2% from 2024 to 2033. The market is expected to reach USD 79.81 billion by 2033. Increasing bio-based product need, especially in North America and Europe, is anticipated to push the overall market over the projection years. Customer awareness and government help towards bio-based product consumption and manufacturing are calculated to promote industry development. Surfactants are primarily utilized to reduce the surface tension between any two liquids or a solid and a liquid in wetting agents, emulsifiers, dispersants, detergents, or foaming agents. Surfactants are used in several end-use industries, like cosmetics, pharmaceuticals, agrochemicals, and petroleum. The constant development in the industry is expected to help the sector shortly. Similarly, rising awareness among customers towards using economically friendly products in developed countries, including Europe and the United States., is anticipated to propel the need for biosurfactants. Furthermore, different regulations set by many economies like the European Union have driven industries to fund eco-friendly bio-based technologies. Due to the popularity of online sales, consumers can buy products of their choice and budget and easily compare products. This gives consumers the satisfaction that they have bought the right product at a fair price, which has led to growth in the surfactant market.
Surfactant, also known as a surface-active agent, a substance like a detergent that, when mixed with liquid, decreases its surface tension, thereby improving its spreading and wetting effects. In textile dyeing, surfactants are helpful in dye to penetrate the fabric evenly. They are used to distribute liquid suspensions of insoluble perfumes and dyes. The chemical compounds utilized to lower the interfacial tension between different mixtures, like two liquids or between a liquid and a gas, are known as surfactants; they can also be between a solid and a liquid. Surfactants are classified as organic compounds and are amphiphilic. Which means it includes both hydrophilic and hydrophobic groups. The surfactant word was derived from a surface-active agent and was coined in 1950. The surfactants have multiple uses in industries. They are present in wetting agents, foaming agents, detergents, emulsifiers, etc. Surfactants are essential elements used in detergents that prevent dirt from the skin, household utensils, clothes, and especially in bathrooms and kitchens. Additionally, a surfactant has both a water-insoluble feature and a water-soluble element. The surfactant properties are dispersed in water and adsorb at interfaces between water and air. It can also adsorb at the interface between water and oil, where water is mixed with oil. The water-insoluble group can expand out of the bulk water phase and move into the air or oil phase. On the other hand, the water-soluble head group usually remains in the water phase.
Get an overview of this study by requesting a free sample
In March 2021, BASF SE, Holiferm Ltd, and Allied Carbon Solutions Co. Ltd entered an arrangement to raise their positions in the active and bio-based surfactants industry. The development shall enable BASF to manufacture and produce the potential for industrial formulators, personal care, and home care products.
High Demand of Surfactants in the Textile Industry- Surface‐active agents are broadly used in manufacturing dyes, dyeing techniques, and preliminary processes for dyeing. Numerous surface‐active agents exist and have different names depending on their method; detergents are utilized in scouring and washing procedures. Some are named wetting agents and are integrated into formulations of dye powders to help wet out when the powder is being dissolved in water and enable the wetting of fibers before dyeing. Retarding and levelling agents are also surfactants; these types include fibers to ionic dyes. Dispersing agents are a different form of surfactant used in the formulation of disperse dyes, ensuring a stable dispersion of the dyes in the dyebath during the dyeing procedure, helping in uniform coloring by the fiber. Regardless, surfactants in the textile wet processing industry are operated as detergents, emulsifying, wetting agents, and dispersing agents; specific surfactants are utilized as lubricants, softeners, anti-bacterial, and anti-static agents.
Fluctuations in raw material prices to hamper market- The cost of raw materials is volatile due to environmental problems and crude oil prices. The adverse consequences of surfactants on the environment, like toxicity and degradability, affect the prices of raw materials. Different regional governments have mandated rules for environmental safety and the usage of resources. Lower raw material prices and technological limitations in the commercial production of petroleum products are anticipated to hamper the market during the projection years.
Technological Advancement- The more significant opportunities for HPC and green Surfactants are the variability and availability of renewable raw materials and their flexibility together with other non-conventional raw materials like waste oil, new greener processes, and synthetic routes such as the bio-catalysis and fermentation of new formulations, which allow low-temperature wash, less packaging, and 3-in-1 functionality and use of polymeric surfactants. Additionally, the growing awareness and willingness to purchase safer and environmentally friendly products.
The regions analyzed for the market include North America, Europe, South America, Asia Pacific, the Middle East, and Africa. Asia Pacific's emerged as the largest market for the global surfactants market, with a 34.17% share of the market revenue in 2023.
The increasing population pushes Asia Pacific's surfactant market to countries like India and China. The significant development of different end-use sectors, including textile, personal care, and agriculture, wherein surfactants find large-scale applications. Similarly, substantial international players in the detergent market, like Procter & Gamble(P&G) and different countries in the region, are described by several domestic players concentrating on maintaining their position in the market. For example, the presence of significant players like Nirma, Rohit Surfactants Private Ltd., and Hindustan Unilever Limited in the Indian detergent market represents the increasing consumption of surfactants in the region.
Asia Pacific Region Surfactants Market Share in 2023 - 34.17%
www.thebrainyinsights.com
Check the geographical analysis of this market by requesting a free sample
The type segment is divided into silicone surfactants, cationic surfactants, non-ionic surfactants, anionic surfactants, amphoteric surfactants, and others. The anionic surfactants segment dominated the market, with a market share of around 18.2% in 2023. On the hydrophilic end anionic surfactants have a negative charge. The negative charge enables the surfactant molecules raise and suspend soils in micelles. Also, they can strike a broad spectrum of soils, anionic surfactants are utilized often in detergents and soaps. The Anionic surfactants make a lot of foam. While anionic surfactants are perfect for lifting and suspending particulate soils, as compared to anionic emulsifying oily soils are better.
The application segment is divided into food processing, household, soaps and detergents, personal care, industry and institutional cleaning, agricultural chemicals, oilfield chemicals, lubricants and fuel additives, emulsion polymerization, textile processing, and others. The household segment dominated the market, with a market share of around 10.4% in 2023. Due to increasing customer need for sanitizers, detergent, hand wash, cleaners, and other products. The Covid-19 has resulted in increased awareness about hygiene/ sanitizing among customers, which has caused improved consumption of consumer goods, therefore pushing the demand of the market. In food & beverages applications, the surfactants are mainly utilized for food additives/ingredients and for treating agents for food contact surfaces.
| Attribute | Description |
|---|---|
| Market Size | Revenue (USD Billion) |
| Market size value in 2023 | USD 48.07 Billion |
| Market size value in 2033 | USD 79.81 Billion |
| CAGR (2024 to 2033) | 5.2% |
| Historical data | 2020-2022 |
| Base Year | 2023 |
| Forecast | 2024-2033 |
| Region | The regions analyzed for the market are North America, Asia Pacific, Europe, South America, and Middle East & Africa. Furthermore, the regions are further analyzed at the country level. |
| Segments | Type, Application |
As per The Brainy Insights, the size of the surfactants market was valued at USD 48.07 billion in 2023 to USD 79.81 billion by 2033.
The global surfactants market is growing at a CAGR of 5.2% during the forecast period 2024-2033.
Asia Pacific region emerged as the largest market for the surfactants market.
High demand of surfactants in the textile industry to propel market growth.
Fluctuations in raw material prices to hamper market.
Technological advancement will provide huge opportunities to the market.
1. Introduction
1.1. Objectives of the Study
1.2. Market Definition
1.3. Research Scope
1.4. Currency
1.5. Key Target Audience
2. Research Methodology and Assumptions
3. Executive Summary
4. Premium Insights
4.1. Porter’s Five Forces Analysis
4.2. Value Chain Analysis
4.3. Top Investment Pockets
4.3.1. Market Attractiveness Analysis by Type
4.3.2. Market Attractiveness Analysis by Application
4.3.3. Market Attractiveness Analysis by Region
4.4. Industry Trends
5. Market Dynamics
5.1. Market Evaluation
5.2. Drivers
5.2.1. High demand of surfactants in the textile industry
5.3. Restraints
5.3.1. Fluctuations in raw material prices to hamper market
5.4. Opportunities
5.4.1. Technological advancement
6. Global Surfactants Market Analysis and Forecast, By Type:
6.1. Segment Overview
6.2. Silicone Surfactants
6.3. Cationic Surfactants
6.4. Non-ionic Surfactants
6.5. Anionic Surfactants
6.6. Amphoteric Surfactants
6.7. Others
7. Global Surfactants Market Analysis and Forecast, By Application
7.1. Segment Overview
7.2. Food Processing
7.3. Household
7.4. Personal Care
7.5. Industry and Institutional Cleaning
7.6. Agricultural Chemicals
7.7. Oilfield Chemicals
7.8. Lubricants and Fuel Additives
7.9. Emulsion Polymerization
7.10. Textile Processing
7.11. Others
8. Global Surfactants Market Analysis and Forecast, By Regional Analysis
8.1. Segment Overview
8.2. North America
8.2.1. U.S.
8.2.2. Canada
8.2.3. Mexico
8.3. Europe
8.3.1. Germany
8.3.2. France
8.3.3. U.K.
8.3.4. Italy
8.3.5. Spain
8.4. Asia-Pacific
8.4.1. Japan
8.4.2. China
8.4.3. India
8.5. South America
8.5.1. Brazil
8.6. Middle East and Africa
8.6.1. UAE
8.6.2. South Africa
9. Global Surfactants Market-Competitive Landscape
9.1. Overview
9.2. Market Share of Key Players in the Surfactants Market
9.2.1. Global Company Market Share
9.2.2. North America Company Market Share
9.2.3. Europe Company Market Share
9.2.4. APAC Company Market Share
9.3. Competitive Situations and Trends
9.3.1. Product Launches and Developments
9.3.2. Partnerships, Collaborations, and Agreements
9.3.3. Mergers & Acquisitions
9.3.4. Expansions
10. Company Profiles
10.1. Stepan Company
10.1.1. Business Overview
10.1.2. Company Snapshot
10.1.3. Company Market Share Analysis
10.1.4. Company Product Portfolio
10.1.5. Recent Developments
10.1.6. SWOT Analysis
10.2. Solvay.
10.2.1. Business Overview
10.2.2. Company Snapshot
10.2.3. Company Market Share Analysis
10.2.4. Company Product Portfolio
10.2.5. Recent Developments
10.2.6. SWOT Analysis
10.3. Nouryon
10.3.1. Business Overview
10.3.2. Company Snapshot
10.3.3. Company Market Share Analysis
10.3.4. Company Product Portfolio
10.3.5. Recent Developments
10.3.6. SWOT Analysis
10.4. Lion Corporation
10.4.1. Business Overview
10.4.2. Company Snapshot
10.4.3. Company Market Share Analysis
10.4.4. Company Product Portfolio
10.4.5. Recent Developments
10.4.6. SWOT Analysis
10.5. Kao Corporation.
10.5.1. Business Overview
10.5.2. Company Snapshot
10.5.3. Company Market Share Analysis
10.5.4. Company Product Portfolio
10.5.5. Recent Developments
10.5.6. SWOT Analysis
10.6. Indorama Ventures Public Company Limited
10.6.1. Business Overview
10.6.2. Company Snapshot
10.6.3. Company Market Share Analysis
10.6.4. Company Product Portfolio
10.6.5. Recent Developments
10.6.6. SWOT Analysis
10.7. Evonik Industries AG
10.7.1. Business Overview
10.7.2. Company Snapshot
10.7.3. Company Market Share Analysis
10.7.4. Company Product Portfolio
10.7.5. Recent Developments
10.7.6. SWOT Analysis
10.8. Dow Chemical Company
10.8.1. Business Overview
10.8.2. Company Snapshot
10.8.3. Company Market Share Analysis
10.8.4. Company Product Portfolio
10.8.5. Recent Developments
10.8.6. SWOT Analysis
10.9. Clariant AG
10.9.1. Business Overview
10.9.2. Company Snapshot
10.9.3. Company Market Share Analysis
10.9.4. Company Product Portfolio
10.9.5. Recent Developments
10.9.6. SWOT Analysis
10.10. Croda International Plc
10.10.1. Business Overview
10.10.2. Company Snapshot
10.10.3. Company Market Share Analysis
10.10.4. Company Product Portfolio
10.10.5. Recent Developments
10.10.6. SWOT Analysis
10.11. BASF SE
10.11.1. Business Overview
10.11.2. Company Snapshot
10.11.3. Company Market Share Analysis
10.11.4. Company Product Portfolio
10.11.5. Recent Developments
10.11.6. SWOT Analysis
10.12. Ashland Global Holdings Inc
10.12.1. Business Overview
10.12.2. Company Snapshot
10.12.3. Company Market Share Analysis
10.12.4. Company Product Portfolio
10.12.5. Recent Developments
10.12.6. SWOT Analysis
10.13. Akzonobel N.V.
10.13.1. Business Overview
10.13.2. Company Snapshot
10.13.3. Company Market Share Analysis
10.13.4. Company Product Portfolio
10.13.5. Recent Developments
10.13.6. SWOT Analysis
List of Table
1. Global Surfactants Market, By Type, 2020-2033 (USD Billion)
2. Global Silicone Surfactants Surfactants Market, By Region, 2020-2033 (USD Billion)
3. Global Cationic Surfactants Surfactants Market, By Region, 2020-2033 (USD Billion)
4. Global Non-ionic Surfactants Surfactants Market, By Region, 2020-2033 (USD Billion)
5. Global Anionic Surfactants Surfactants Market, By Region, 2020-2033 (USD Billion)
6. Global Amphoteric Surfactants Surfactants Market, By Region, 2020-2033 (USD Billion)
7. Global Others Surfactants Market, By Region, 2020-2033 (USD Billion)
8. Global Surfactants Market, By Application, 2020-2033 (USD Billion)
9. Global Food Processing Surfactants Market, By Region, 2020-2033 (USD Billion)
10. Global Household Surfactants Market, By Region, 2020-2033 (USD Billion)
11. North America Surfactants Market, By Type, 2020-2033 (USD Billion)
12. North America Surfactants Market, By Application, 2020-2033 (USD Billion)
13. U.S. Surfactants Market, By Type, 2020-2033 (USD Billion)
14. U.S. Surfactants Market, By Application, 2020-2033 (USD Billion)
15. Canada Surfactants Market, By Type, 2020-2033 (USD Billion)
16. Canada Surfactants Market, By Application, 2020-2033 (USD Billion)
17. Mexico Surfactants Market, By Type, 2020-2033 (USD Billion)
18. Mexico Surfactants Market, By Application, 2020-2033 (USD Billion)
19. Europe Surfactants Market, By Type, 2020-2033 (USD Billion)
20. Europe Surfactants Market, By Application, 2020-2033 (USD Billion)
21. Germany Surfactants Market, By Type, 2020-2033 (USD Billion)
22. Germany Surfactants Market, By Application, 2020-2033 (USD Billion)
23. France Surfactants Market, By Type 2020-2033 (USD Billion)
24. France Surfactants Market, By Application, 2020-2033 (USD Billion)
25. U.K. Surfactants Market, By Type, 2020-2033 (USD Billion)
26. U.K. Surfactants Market, By Application, 2020-2033 (USD Billion)
27. Italy Surfactants Market, By Type, 2020-2033 (USD Billion)
28. Italy Surfactants Market, By Application, 2020-2033 (USD Billion)
29. Spain Surfactants Market, By Type, 2020-2033 (USD Billion)
30. Spain Surfactants Market, By Application, 2020-2033 (USD Billion)
31. Asia Pacific Surfactants Market, By Type, 2020-2033 (USD Billion)
32. Asia Pacific Surfactants Market, By Application, 2020-2033 (USD Billion)
33. Japan Surfactants Market, By Type, 2020-2033 (USD Billion)
34. Japan Surfactants Market, By Application, 2020-2033 (USD Billion)
35. China Surfactants Market, By Type 2020-2033 (USD Billion)
36. China Surfactants Market, By Application, 2020-2033 (USD Billion)
37. India Surfactants Market, By Type 2020-2033 (USD Billion)
38. India Surfactants Market, By Application, 2020-2033 (USD Billion)
39. South America Surfactants Market, By Type, 2020-2033 (USD Billion)
40. South America Surfactants Market, By Application, 2020-2033 (USD Billion)
41. Brazil Surfactants Market, By Type 2020-2033 (USD Billion)
42. Brazil Surfactants Market, By Application, 2020-2033 (USD Billion)
43. Middle East and Africa Surfactants Market, By Type, 2020-2033 (USD Billion)
44. Middle East and Africa Surfactants Market, By Application, 2020-2033 (USD Billion)
45. UAE Surfactants Market, By Type, 2020-2033 (USD Billion)
46. UAE Surfactants Market, By Application, 2020-2033 (USD Billion)
47. South Africa Surfactants Market, By Type 2020-2033 (USD Billion)
48. South Africa Surfactants Market, By Application, 2020-2033 (USD Billion)
List of Figures
1. Global Surfactants Market Segmentation
2. Surfactants Market: Research Methodology
3. Market Size Estimation Methodology: Bottom-Up Approach
4. Market Size Estimation Methodology: Top-Down Approach
5. Data Triangulation
6. Porter’s Five Forces Analysis
7. Value Chain Analysis
8. Global Surfactants Market Attractiveness Analysis by Type
9. Global Surfactants Market Attractiveness Analysis by Application
10. Global Surfactants Market Attractiveness Analysis by Region
11. Global Surfactants Market: Dynamics
12. Global Surfactants Market Share by Type (2023 & 2033)
13. Global Surfactants Market Share by Application (2023 & 2033)
14. Global Surfactants Market Share by Regions (2023 & 203)
15. Global Surfactants Market Share by Company (2023)
This study forecasts revenue at global, regional, and country levels from 2020 to 2033. The Brainy Insights has segmented the global surfactants market based on below mentioned segments:
Global Surfactants Market Type:
Global Surfactants Market Application:
Global Surfactants Market by Region:
Research has its special purpose to undertake marketing efficiently. In this competitive scenario, businesses need information across all industry verticals; the information about customer wants, market demand, competition, industry trends, distribution channels etc. This information needs to be updated regularly because businesses operate in a dynamic environment. Our organization, The Brainy Insights incorporates scientific and systematic research procedures in order to get proper market insights and industry analysis for overall business success. The analysis consists of studying the market from a miniscule level wherein we implement statistical tools which helps us in examining the data with accuracy and precision.
Our research reports feature both; quantitative and qualitative aspects for any market. Qualitative information for any market research process are fundamental because they reveal the customer needs and wants, usage and consumption for any product/service related to a specific industry. This in turn aids the marketers/investors in knowing certain perceptions of the customers. Qualitative research can enlighten about the different product concepts and designs along with unique service offering that in turn, helps define marketing problems and generate opportunities. On the other hand, quantitative research engages with the data collection process through interviews, e-mail interactions, surveys and pilot studies. Quantitative aspects for the market research are useful to validate the hypotheses generated during qualitative research method, explore empirical patterns in the data with the help of statistical tools, and finally make the market estimations.
The Brainy Insights offers comprehensive research and analysis, based on a wide assortment of factual insights gained through interviews with CXOs and global experts and secondary data from reliable sources. Our analysts and industry specialist assume vital roles in building up statistical tools and analysis models, which are used to analyse the data and arrive at accurate insights with exceedingly informative research discoveries. The data provided by our organization have proven precious to a diverse range of companies, facilitating them to address issues such as determining which products/services are the most appealing, whether or not customers use the product in the manner anticipated, the purchasing intentions of the market and many others.
Our research methodology encompasses an idyllic combination of primary and secondary initiatives. Key phases involved in this process are listed below:

The phase involves the gathering and collecting of market data and its related information with the help of different sources & research procedures.

The data procurement stage involves in data gathering and collecting through various data sources.
This stage involves in extensive research. These data sources includes:
Purchased Database: Purchased databases play a crucial role in estimating the market sizes irrespective of the domain. Our purchased database includes:
Primary Research: The Brainy Insights interacts with leading companies and experts of the concerned domain to develop the analyst team’s market understanding and expertise. It improves and substantiates every single data presented in the market reports. Primary research mainly involves in telephonic interviews, E-mail interactions and face-to-face interviews with the raw material providers, manufacturers/producers, distributors, & independent consultants. The interviews that we conduct provides valuable data on market size and industry growth trends prevailing in the market. Our organization also conducts surveys with the various industry experts in order to gain overall insights of the industry/market. For instance, in healthcare industry we conduct surveys with the pharmacists, doctors, surgeons and nurses in order to gain insights and key information of a medical product/device/equipment which the customers are going to usage. Surveys are conducted in the form of questionnaire designed by our own analyst team. Surveys plays an important role in primary research because surveys helps us to identify the key target audiences of the market. Additionally, surveys helps to identify the key target audience engaged with the market. Our survey team conducts the survey by targeting the key audience, thus gaining insights from them. Based on the perspectives of the customers, this information is utilized to formulate market strategies. Moreover, market surveys helps us to understand the current competitive situation of the industry. To be precise, our survey process typically involve with the 360 analysis of the market. This analytical process begins by identifying the prospective customers for a product or service related to the market/industry to obtain data on how a product/service could fit into customers’ lives.

Secondary Research: The secondary data sources includes information published by the on-profit organizations such as World bank, WHO, company fillings, investor presentations, annual reports, national government documents, statistical databases, blogs, articles, white papers and others. From the annual report, we analyse a company’s revenue to understand the key segment and market share of that organization in a particular region. We analyse the company websites and adopt the product mapping technique which is important for deriving the segment revenue. In the product mapping method, we select and categorize the products offered by the companies catering to domain specific market, deduce the product revenue for each of the companies so as to get overall estimation of the market size. We also source data and analyses trends based on information received from supply side and demand side intermediaries in the value chain. The supply side denotes the data gathered from supplier, distributor, wholesaler and the demand side illustrates the data gathered from the end customers for respective market domain.

The supply side for a domain specific market is analysed by:
The demand side for the market is estimated through:
In-house Library: Apart from these third-party sources, we have our in-house library of qualitative and quantitative information. Our in-house database includes market data for various industry and domains. These data are updated on regular basis as per the changing market scenario. Our library includes, historic databases, internal audit reports and archives.
Sometimes there are instances where there is no metadata or raw data available for any domain specific market. For those cases, we use our expertise to forecast and estimate the market size in order to generate comprehensive data sets. Our analyst team adopt a robust research technique in order to produce the estimates:
Data Synthesis: This stage involves the analysis & mapping of all the information obtained from the previous step. It also involves in scrutinizing the data for any discrepancy observed while data gathering related to the market. The data is collected with consideration to the heterogeneity of sources. Robust scientific techniques are in place for synthesizing disparate data sets and provide the essential contextual information that can orient market strategies. The Brainy Insights has extensive experience in data synthesis where the data passes through various stages:


Market Deduction & Formulation: The final stage comprises of assigning data points at appropriate market spaces so as to deduce feasible conclusions. Analyst perspective & subject matter expert based holistic form of market sizing coupled with industry analysis also plays a crucial role in this stage.
This stage involves in finalization of the market size and numbers that we have collected from data integration step. With data interpolation, it is made sure that there is no gap in the market data. Successful trend analysis is done by our analysts using extrapolation techniques, which provide the best possible forecasts for the market.
Data Validation & Market Feedback: Validation is the most important step in the process. Validation & re-validation via an intricately designed process helps us finalize data-points to be used for final calculations.

The Brainy Insights interacts with leading companies and experts of the concerned domain to develop the analyst team’s market understanding and expertise. It improves and substantiates every single data presented in the market reports. The data validation interview and discussion panels are typically composed of the most experienced industry members. The participants include, however, are not limited to:
Moreover, we always validate our data and findings through primary respondents from all the major regions we are working on.


Free Customization
Fortune 500 Clients
Free Yearly Update On Purchase Of Multi/Corporate License
Companies Served Till Date