- +1-315-215-1633
- sales@thebrainyinsights.com

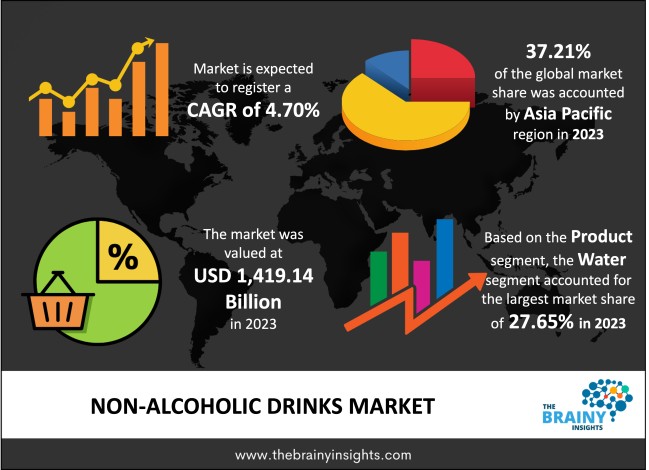
The global non-alcoholic drinks market was valued at USD 1,419.14 billion in 2023, growing at a CAGR of 4.70% from 2024 to 2033. The market is expected to reach USD 2,246.43 billion by 2033. Manufacturers are responding to the new trends and innovating existing product portfolios in the non-alcoholic drinks. This is anticipated to bode well for future growth as customers adopt the no-alcohol and low-alcohol categories more and more. Non-alcoholic drink's popularity is growing due to a surge in drinking culture. Based on one of the studies, more than 50% of the drinkers are replacing their alcoholic drinks with non-alcoholic beverages.
Mocktails, near beer, and virgin drinks are other terms for non-alcoholic drinks, defined as liquids with less than 0.5% alcohol by volume. The market for non-alcoholic drinks includes various refreshing drinks, such as probiotics, energy drinks, juices, soft drinks, coffee and tea, and bottled water. Over the past ten years, a remarkable shift in customer preferences has affected the beverage business. A Waitrose Food and Drink Report from October 2021 states that the number of people searching for alcohol-free beverages rises by 22% annually. Companies have been introducing new products or growing their current ranges to keep up with emerging trends. For example, American tea company Good Earth increased its range of products in the United Kingdom in May 2020. The brand offers a selection of flavoured and original kombucha, green, black, fruit, and herbal teas mixed with natural ingredients. The 2022 Bacardi Cocktail Trends Report estimates that 58% of consumers worldwide are switching to cocktails and beverages with minimal alcohol content and no added sugar.
Get an overview of this study by requesting a free sample
In July 2022, Colorado is now home to PepsiCo's biggest bottling facility in the US. The proposed plant may accomplish reduced use of virgin plastic, best-in-class water efficiency, and 100% renewable electricity.
In March 2022, Red Bull introduced its strawberry and apricot limited-edition flavour extension. Beginning on April 4, 2022, Red Bull Summer Edition Strawberry Apricot was stocked on Walmart's shelves in the United States. It was offered in single cans, measuring 8.4 oz (25 cm) and 12 oz (35 cm).
In March 2022, Start-up based in the United Kingdom A line of natural energy drinks in cans, powered by matcha green tea, was introduced by PerfectTed. Made from actual fruit juice, the three flavours are pineapple yuzu, apple raspberry, and pear ginger. The beverages include no added sugar, preservatives, additives, or gluten and are made entirely of plants.
Strong demand from fitness-conscious consumers- During high-intensity activity, athletes usually drink sports and energy drinks to restore fluids and electrolytes and to supply them with rapid energy. Because of this, athletes, gym patrons, and fitness fanatics mostly take it to expedite rehydration, supply immediate energy, and enhance general recuperation following physical activity. For example, Applied Nutrition introduced its new L-Carnitine sports drink in February 2022. This innovative beverage has 1,500 mg of L-carnitine, zero calories, no sugar, and vitamins B3, B6, and B12.
Fluctuation in availability of raw materials- Non-alcoholic drinks has several negative social and environmental effects since it depends so heavily on natural resources like water and electricity. Decreased water availability, rising pollution, and indirect greenhouse gas emissions all contribute to the disruption of natural resource availability, which is predicted to hinder market production capacity. Nonetheless, producers have joined forces with the alcohol sector to establish the Beverage Industry Environmental Roundtable (BIER) after realizing the potential dangers linked to sustainability concerns. Leading corporations, including the Coca-Cola Company, Pepsi Co., and others, have formed the technical alliance BIER to advance sustainability in the beverage industry.
Evolution of e-commerce platforms- These days customers are becoming more reliant on the internet and e-commerce, technological advancements and virtual shopping trends are predicted to impact the beverage industry significantly. The global E-commerce Foundation 2018 reports that the percentage of people using the internet is rising yearly. In 2018, e-commerce accounted for around 30% of worldwide grocery income, which is projected to climb. To help expand the market during the anticipated years, soft drink producers are concentrating heavily on creating new online storefronts.
The regions analyzed for the market include North America, Europe, South America, Asia Pacific, the Middle East, and Africa. Asia Pacific emerged as the largest global non-alcoholic drinks market, with a 37.21% market revenue share in 2023.
Rising consumer knowledge and a need for more from products labelled as "organic" or "free from" indicate that the region is seeing a demand for cleaner, more minimalist beverage products. Veganism is becoming more and more popular as a result of consumer awareness of allergies, hormones, and inhumane animal husbandry practices used in the food and beverage sector. As a result, there is a growing demand for beverages made without animal products. Consequently, businesses began to introduce plant-based beverages. For example, GO MATE introduced a range of natural energy drinks in July 2022. The brand uses only natural components to create a range of flavours.
Asia Pacific Region Non-Alcoholic Drinks Market Share in 2023 - 37.21%
www.thebrainyinsights.com
Check the geographical analysis of this market by requesting a free sample
The product segment is divided into water, tea, carbonated soft drinks, sports & functional drinks, and bubble/sparkling water. The water segment dominated the market, with a market share of around 27.65% in 2023. Demand for bottled water is predicted to be fueled by the growing expansion of tourism industry. Furthermore, the user-friendly packaging is a key driver propelling the growth of bottled water segment.
The distribution channel segment is divided into retail and food service. The retail segment dominated the market, with a market share of around 57.64% in 2023. The retail channel comprises supermarkets, hypermarkets, internet retailers, and other channels. Supermarkets and hypermarkets hold the largest share of this subcategory because they offer a wide range of brands and goods under one roof. Whole Foods, Target, Aldi, and Walmart are just a few supermarkets expanding their offerings in the non-alcoholic drinks market.
| Attribute | Description |
|---|---|
| Market Size | Revenue (USD Billion) |
| Market size value in 2023 | USD 1,419.14 Billion |
| Market size value in 2033 | USD 2,246.43 Billion |
| CAGR (2024 to 2033) | 4.70% |
| Historical data | 2020-2022 |
| Base Year | 2023 |
| Forecast | 2024-2033 |
| Region | The regions analyzed for the market are Asia Pacific, Europe, South America, North America, and Middle East & Africa. Furthermore, the regions are further analyzed at the country level. |
| Segments | Product, Distribution Channel |
As per The Brainy Insights, the size of the non-alcoholic drinks market was valued at USD 1,419.14 billion in 2023 to USD 2,246.43 billion by 2033.
The global non-alcoholic drinks market is growing at a CAGR of 4.70% during the forecast period 2024-2033.
Asia Pacific emerged as the largest non-alcoholic drinks market.
Key players in the non-alcoholic drinks market are Suja Life, FreshBev, Suntory Beverage & Food, Asahi Group, Kirin Holdings Co., Kraft Foods Group, Inc., LLC, Pressed Juicery, Unilever, and Jacobs Douwe Egberts.
1. Introduction
1.1. Objectives of the Study
1.2. Market Definition
1.3. Research Scope
1.4. Currency
1.5. Key Target Audience
2. Research Methodology and Assumptions
3. Executive Summary
4. Premium Insights
4.1. Porter’s Five Forces Analysis
4.2. Value Chain Analysis
4.3. Top Investment Pockets
4.3.1. Market Attractiveness Analysis by Product
4.3.2. Market Attractiveness Analysis by Distribution Channel
4.3.3. Market Attractiveness Analysis by Region
4.4. Industry Trends
5. Market Dynamics
5.1. Market Evaluation
5.2. Drivers
5.2.1. Strong demand from fitness-conscious consumers
5.3. Restraints
5.3.1. Fluctuation in the availability of raw materials
5.4. Opportunities
5.4.1. Evolution of e-commerce platforms
6. Global Non-Alcoholic Drinks Market Analysis and Forecast, By Product
6.1. Segment Overview
6.2. Water
6.3. Tea
6.4. Carbonated Soft Drinks
6.5. Sports & Functional Drinks
6.6. Bubble/Sparkling Water
7. Global Non-Alcoholic Drinks Market Analysis and Forecast, By Distribution Channel
7.1. Segment Overview
7.2. Retail
7.3. Food Service
8. Global Non-Alcoholic Drinks Market Analysis and Forecast, By Regional Analysis
8.1. Segment Overview
8.2. North America
8.2.1. U.S.
8.2.2. Canada
8.2.3. Mexico
8.3. Europe
8.3.1. Germany
8.3.2. France
8.3.3. U.K.
8.3.4. Italy
8.3.5. Spain
8.4. Asia-Pacific
8.4.1. Japan
8.4.2. China
8.4.3. India
8.5. South America
8.5.1. Brazil
8.6. Middle East and Africa
8.6.1. UAE
8.6.2. South Africa
9. Global Non-Alcoholic Drinks Market-Competitive Landscape
9.1. Overview
9.2. Market Share of Key Players in Global Non-Alcoholic Drinks Market
9.2.1. Global Company Market Share
9.2.2. North America Company Market Share
9.2.3. Europe Company Market Share
9.2.4. APAC Company Market Share
9.3. Competitive Situations and Trends
9.3.1. Product Launches and Developments
9.3.2. Partnerships, Collaborations, and Agreements
9.3.3. Mergers & Acquisitions
9.3.4. Expansions
10. Company Profiles
10.1. Suja Life
10.1.1. Business Overview
10.1.2. Company Snapshot
10.1.3. Company Market Share Analysis
10.1.4. Company Product Portfolio
10.1.5. Recent Developments
10.1.6. SWOT Analysis
10.2. FreshBev
10.2.1. Business Overview
10.2.2. Company Snapshot
10.2.3. Company Market Share Analysis
10.2.4. Company Product Portfolio
10.2.5. Recent Developments
10.2.6. SWOT Analysis
10.3. Suntory Beverage & Food
10.3.1. Business Overview
10.3.2. Company Snapshot
10.3.3. Company Market Share Analysis
10.3.4. Company Product Portfolio
10.3.5. Recent Developments
10.3.6. SWOT Analysis
10.4. Asahi Group
10.4.1. Business Overview
10.4.2. Company Snapshot
10.4.3. Company Market Share Analysis
10.4.4. Company Product Portfolio
10.4.5. Recent Developments
10.4.6. SWOT Analysis
10.5. Kirin Holdings Co.
10.5.1. Business Overview
10.5.2. Company Snapshot
10.5.3. Company Market Share Analysis
10.5.4. Company Product Portfolio
10.5.5. Recent Developments
10.5.6. SWOT Analysis
10.6. Kraft Foods Group, Inc.
10.6.1. Business Overview
10.6.2. Company Snapshot
10.6.3. Company Market Share Analysis
10.6.4. Company Product Portfolio
10.6.5. Recent Developments
10.6.6. SWOT Analysis
10.7. LLC
10.7.1. Business Overview
10.7.2. Company Snapshot
10.7.3. Company Market Share Analysis
10.7.4. Company Product Portfolio
10.7.5. Recent Developments
10.7.6. SWOT Analysis
10.8. Pressed Juicery
10.8.1. Business Overview
10.8.2. Company Snapshot
10.8.3. Company Market Share Analysis
10.8.4. Company Product Portfolio
10.8.5. Recent Developments
10.8.6. SWOT Analysis
10.9. Unilever
10.9.1. Business Overview
10.9.2. Company Snapshot
10.9.3. Company Market Share Analysis
10.9.4. Company Product Portfolio
10.9.5. Recent Developments
10.9.6. SWOT Analysis
10.10. Jacobs Douwe Egberts
10.10.1. Business Overview
10.10.2. Company Snapshot
10.10.3. Company Market Share Analysis
10.10.4. Company Product Portfolio
10.10.5. Recent Developments
10.10.6. SWOT Analysis
List of Table
1. Global Non-Alcoholic Drinks Market, By Product, 2020 - 2033 (USD Billion)
2. Global Water, Non-Alcoholic Drinks Market, By Region, 2020 - 2033 (USD Billion)
3. Global Tea, Non-Alcoholic Drinks Market, By Region, 2020 - 2033 (USD Billion)
4. Global Carbonated Soft Drinks, Non-Alcoholic Drinks Market, By Region, 2020 - 2033 (USD Billion)
5. Global Sports & Functional Drinks, Non-Alcoholic Drinks Market, By Region, 2020 - 2033 (USD Billion)
6. Global Bubble/Sparkling Water, Non-Alcoholic Drinks Market, By Region, 2020 - 2033 (USD Billion)
7. Global Non-Alcoholic Drinks Market, By Distribution Channel, 2020 - 2033 (USD Billion)
8. Global Retail, Non-Alcoholic Drinks Market, By Region, 2020 - 2033 (USD Billion)
9. Global Food Service, Non-Alcoholic Drinks Market, By Region, 2020 - 2033 (USD Billion)
10. North America Non-Alcoholic Drinks Market, By Product, 2020 - 2033 (USD Billion)
11. North America Non-Alcoholic Drinks Market, By Distribution Channel, 2020 - 2033 (USD Billion)
12. U.S. Non-Alcoholic Drinks Market, By Product, 2020 - 2033 (USD Billion)
13. U.S. Non-Alcoholic Drinks Market, By Distribution Channel, 2020 - 2033 (USD Billion)
14. Canada Non-Alcoholic Drinks Market, By Product, 2020 - 2033 (USD Billion)
15. Canada Non-Alcoholic Drinks Market, By Distribution Channel, 2020 - 2033 (USD Billion)
16. Mexico Non-Alcoholic Drinks Market, By Product, 2020 - 2033 (USD Billion)
17. Mexico Non-Alcoholic Drinks Market, By Distribution Channel, 2020 - 2033 (USD Billion)
18. Europe Non-Alcoholic Drinks Market, By Product, 2020 - 2033 (USD Billion)
19. Europe Non-Alcoholic Drinks Market, By Distribution Channel, 2020 - 2033 (USD Billion)
20. Germany Non-Alcoholic Drinks Market, By Product, 2020 - 2033 (USD Billion)
21. Germany Non-Alcoholic Drinks Market, By Distribution Channel, 2020 - 2033 (USD Billion)
22. France Non-Alcoholic Drinks Market, By Product, 2020 - 2033 (USD Billion)
23. France Non-Alcoholic Drinks Market, By Distribution Channel, 2020 - 2033 (USD Billion)
24. U.K. Non-Alcoholic Drinks Market, By Product, 2020 - 2033 (USD Billion)
25. U.K. Non-Alcoholic Drinks Market, By Distribution Channel, 2020 - 2033 (USD Billion)
26. Italy Non-Alcoholic Drinks Market, By Product, 2020 - 2033 (USD Billion)
27. Italy Non-Alcoholic Drinks Market, By Distribution Channel, 2020 - 2033 (USD Billion)
28. Spain Non-Alcoholic Drinks Market, By Product, 2020 - 2033 (USD Billion)
29. Spain Non-Alcoholic Drinks Market, By Distribution Channel, 2020 - 2033 (USD Billion)
30. Asia Pacific Non-Alcoholic Drinks Market, By Product, 2020 - 2033 (USD Billion)
31. Asia Pacific Non-Alcoholic Drinks Market, By Distribution Channel, 2020 - 2033 (USD Billion)
32. Japan Non-Alcoholic Drinks Market, By Product, 2020 - 2033 (USD Billion)
33. Japan Non-Alcoholic Drinks Market, By Distribution Channel, 2020 - 2033 (USD Billion)
34. China Non-Alcoholic Drinks Market, By Product, 2020 - 2033 (USD Billion)
35. China Non-Alcoholic Drinks Market, By Distribution Channel, 2020 - 2033 (USD Billion)
36. India Non-Alcoholic Drinks Market, By Product, 2020 - 2033 (USD Billion)
37. India Non-Alcoholic Drinks Market, By Distribution Channel, 2020 - 2033 (USD Billion)
38. South America Non-Alcoholic Drinks Market, By Product, 2020 - 2033 (USD Billion)
39. South America Non-Alcoholic Drinks Market, By Distribution Channel, 2020 - 2033 (USD Billion)
40. Brazil Non-Alcoholic Drinks Market, By Product, 2020 - 2033 (USD Billion)
41. Brazil Non-Alcoholic Drinks Market, By Distribution Channel, 2020 - 2033 (USD Billion)
42. Middle East and Africa Non-Alcoholic Drinks Market, By Product, 2020 - 2033 (USD Billion)
43. Middle East and Africa Non-Alcoholic Drinks Market, By Distribution Channel, 2020 - 2033 (USD Billion)
44. UAE Non-Alcoholic Drinks Market, By Product, 2020 - 2033 (USD Billion)
45. UAE Non-Alcoholic Drinks Market, By Distribution Channel, 2020 - 2033 (USD Billion)
46. South Africa Non-Alcoholic Drinks Market, By Product, 2020 - 2033 (USD Billion)
47. South Africa Non-Alcoholic Drinks Market, By Distribution Channel, 2020 - 2033 (USD Billion)
List of Figures
1. Global Non-Alcoholic Drinks Market Segmentation
2. Global Non-Alcoholic Drinks Market: Research Methodology
3. Market Size Estimation Methodology: Bottom-Up Approach
4. Market Size Estimation Methodology: Top-Down Approach
5. Data Triangulation
6. Porter’s Five Forces Analysis
7. Value Chain Analysis
8. Global Non-Alcoholic Drinks Market Attractiveness Analysis by Product
9. Global Non-Alcoholic Drinks Market Attractiveness Analysis by Distribution Channel
10. Global Non-Alcoholic Drinks Market Attractiveness Analysis by Region
11. Global Non-Alcoholic Drinks Market: Dynamics
12. Global Non-Alcoholic Drinks Market Share by Product (2023 & 2033)
13. Global Non-Alcoholic Drinks Market Share by Distribution Channel (2023 & 2033)
14. Global Non-Alcoholic Drinks Market Share by Regions (2023 & 2033)
15. Global Non-Alcoholic Drinks Market Share by Company (2023)
This study forecasts global, regional, and country revenue from 2020 to 2033. The Brainy Insights has segmented the global non-alcoholic drinks market based on the below-mentioned segments:
Global Non-Alcoholic Drinks Market By Product:
Global Non-Alcoholic Drinks Market By Distribution Channel:
Global Non-Alcoholic Drinks Market By Region:
Research has its special purpose to undertake marketing efficiently. In this competitive scenario, businesses need information across all industry verticals; the information about customer wants, market demand, competition, industry trends, distribution channels etc. This information needs to be updated regularly because businesses operate in a dynamic environment. Our organization, The Brainy Insights incorporates scientific and systematic research procedures in order to get proper market insights and industry analysis for overall business success. The analysis consists of studying the market from a miniscule level wherein we implement statistical tools which helps us in examining the data with accuracy and precision.
Our research reports feature both; quantitative and qualitative aspects for any market. Qualitative information for any market research process are fundamental because they reveal the customer needs and wants, usage and consumption for any product/service related to a specific industry. This in turn aids the marketers/investors in knowing certain perceptions of the customers. Qualitative research can enlighten about the different product concepts and designs along with unique service offering that in turn, helps define marketing problems and generate opportunities. On the other hand, quantitative research engages with the data collection process through interviews, e-mail interactions, surveys and pilot studies. Quantitative aspects for the market research are useful to validate the hypotheses generated during qualitative research method, explore empirical patterns in the data with the help of statistical tools, and finally make the market estimations.
The Brainy Insights offers comprehensive research and analysis, based on a wide assortment of factual insights gained through interviews with CXOs and global experts and secondary data from reliable sources. Our analysts and industry specialist assume vital roles in building up statistical tools and analysis models, which are used to analyse the data and arrive at accurate insights with exceedingly informative research discoveries. The data provided by our organization have proven precious to a diverse range of companies, facilitating them to address issues such as determining which products/services are the most appealing, whether or not customers use the product in the manner anticipated, the purchasing intentions of the market and many others.
Our research methodology encompasses an idyllic combination of primary and secondary initiatives. Key phases involved in this process are listed below:

The phase involves the gathering and collecting of market data and its related information with the help of different sources & research procedures.

The data procurement stage involves in data gathering and collecting through various data sources.
This stage involves in extensive research. These data sources includes:
Purchased Database: Purchased databases play a crucial role in estimating the market sizes irrespective of the domain. Our purchased database includes:
Primary Research: The Brainy Insights interacts with leading companies and experts of the concerned domain to develop the analyst team’s market understanding and expertise. It improves and substantiates every single data presented in the market reports. Primary research mainly involves in telephonic interviews, E-mail interactions and face-to-face interviews with the raw material providers, manufacturers/producers, distributors, & independent consultants. The interviews that we conduct provides valuable data on market size and industry growth trends prevailing in the market. Our organization also conducts surveys with the various industry experts in order to gain overall insights of the industry/market. For instance, in healthcare industry we conduct surveys with the pharmacists, doctors, surgeons and nurses in order to gain insights and key information of a medical product/device/equipment which the customers are going to usage. Surveys are conducted in the form of questionnaire designed by our own analyst team. Surveys plays an important role in primary research because surveys helps us to identify the key target audiences of the market. Additionally, surveys helps to identify the key target audience engaged with the market. Our survey team conducts the survey by targeting the key audience, thus gaining insights from them. Based on the perspectives of the customers, this information is utilized to formulate market strategies. Moreover, market surveys helps us to understand the current competitive situation of the industry. To be precise, our survey process typically involve with the 360 analysis of the market. This analytical process begins by identifying the prospective customers for a product or service related to the market/industry to obtain data on how a product/service could fit into customers’ lives.

Secondary Research: The secondary data sources includes information published by the on-profit organizations such as World bank, WHO, company fillings, investor presentations, annual reports, national government documents, statistical databases, blogs, articles, white papers and others. From the annual report, we analyse a company’s revenue to understand the key segment and market share of that organization in a particular region. We analyse the company websites and adopt the product mapping technique which is important for deriving the segment revenue. In the product mapping method, we select and categorize the products offered by the companies catering to domain specific market, deduce the product revenue for each of the companies so as to get overall estimation of the market size. We also source data and analyses trends based on information received from supply side and demand side intermediaries in the value chain. The supply side denotes the data gathered from supplier, distributor, wholesaler and the demand side illustrates the data gathered from the end customers for respective market domain.

The supply side for a domain specific market is analysed by:
The demand side for the market is estimated through:
In-house Library: Apart from these third-party sources, we have our in-house library of qualitative and quantitative information. Our in-house database includes market data for various industry and domains. These data are updated on regular basis as per the changing market scenario. Our library includes, historic databases, internal audit reports and archives.
Sometimes there are instances where there is no metadata or raw data available for any domain specific market. For those cases, we use our expertise to forecast and estimate the market size in order to generate comprehensive data sets. Our analyst team adopt a robust research technique in order to produce the estimates:
Data Synthesis: This stage involves the analysis & mapping of all the information obtained from the previous step. It also involves in scrutinizing the data for any discrepancy observed while data gathering related to the market. The data is collected with consideration to the heterogeneity of sources. Robust scientific techniques are in place for synthesizing disparate data sets and provide the essential contextual information that can orient market strategies. The Brainy Insights has extensive experience in data synthesis where the data passes through various stages:


Market Deduction & Formulation: The final stage comprises of assigning data points at appropriate market spaces so as to deduce feasible conclusions. Analyst perspective & subject matter expert based holistic form of market sizing coupled with industry analysis also plays a crucial role in this stage.
This stage involves in finalization of the market size and numbers that we have collected from data integration step. With data interpolation, it is made sure that there is no gap in the market data. Successful trend analysis is done by our analysts using extrapolation techniques, which provide the best possible forecasts for the market.
Data Validation & Market Feedback: Validation is the most important step in the process. Validation & re-validation via an intricately designed process helps us finalize data-points to be used for final calculations.

The Brainy Insights interacts with leading companies and experts of the concerned domain to develop the analyst team’s market understanding and expertise. It improves and substantiates every single data presented in the market reports. The data validation interview and discussion panels are typically composed of the most experienced industry members. The participants include, however, are not limited to:
Moreover, we always validate our data and findings through primary respondents from all the major regions we are working on.


Free Customization
Fortune 500 Clients
Free Yearly Update On Purchase Of Multi/Corporate License
Companies Served Till Date