- +1-315-215-1633
- sales@thebrainyinsights.com

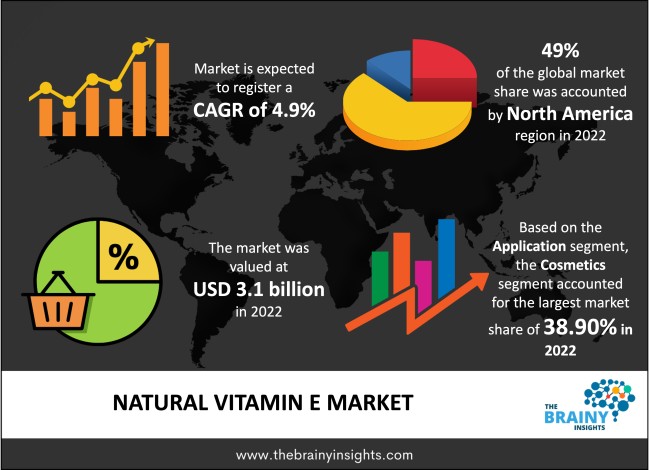
The global natural vitamin E market is expected to reach USD 5.0 billion by 2032, at a CAGR of 4.9% during the forecast period 2023 to 2032. Asia Pacific is expected to grow the fastest during the forecast period.
Vitamin E is a fat-soluble antioxidant that protects the cell membrane from reactive oxygen species. It can be found in various foods, including vegetable oil, fruits and vegetables, meat, cereal, poultry eggs, and wheat germ oil. Vitamin E insufficiency is common in persons with genetic disorders or premature newborns. Vitamin E-rich foods include olive, canola, almonds, margarine, and peanuts. Meats, leafy greens, dairy, and fortified cereals are other good sources of natural vitamin E. Factors such as the rising benefits of vitamin E in reducing the chances of cardiovascular disease and preventing hair loss are driving the expansion of the vitamin E market. Furthermore, increased knowledge about the health advantages of vitamins is another primary reason driving the natural vitamin E market growth. Moreover, the increase in consumer awareness about the health and side effects of vitamin E deficiency, as well as its effectiveness in reducing the problems that are growing or developing as a result of a sedentary lifestyle and the adoption of unhealthy eating habits, is expected to accelerate the market's overall growth.
Get an overview of this study by requesting a free sample
Rising Urbanization- The key drivers of market growth are projected to be population increase, urbanization, and rising household incomes. Levels of urbanization and income growth impact general patterns of food consumption and specific demand for animal products, which contribute directly to natural vitamin E market growth in developing nations. Demand for livestock products such as meat and poultry quickly expands in emerging countries due to increasing urbanization which also increases the demand for natural vitamin E market.
Side effects with Medications- Vitamin E inhibits platelet aggregation, which reduces blood clotting. If you take blood thinners, such as Coumadin (warfarin) or Plavix (clopidogrel), consult your doctor before taking vitamin E, especially if you have poor vitamin K consumption. Furthermore, avoid taking vitamin E at least two weeks before surgery to prevent excessive bleeding.
Alternative Sources- Alternative sources for extracting natural vitamin E from deodorized distillates, such as rapeseed, palm oils, and mixed sources, are expected to provide growth opportunities for the market during the forecast period. Introducing novel formulations and solubility in water-based products are favourable conditions for manufacturers to introduce new products and grow their regional presence, which is expected to add impetus to the market’s growth during the forecast period.
Side Effects of Vitamin E- Excessive usage of vitamin E has several side effects which may challenge the market’s growth as it causes blood thinning and deadly haemorrhage. The supply chain disruption caused to several political and natural causes has further affected product availability, which may be a significant barrier to market growth over the forecast period.
The regions analyzed for the market include North America, Europe, South America, Asia Pacific, the Middle East, and Africa. North America emerged as the largest market for the global natural vitamin E market, with a 49% market revenue share in 2022.
North America dominates the natural vitamin E market with a 49% market revenue share in 2022. The demand for natural vitamin E in the region has been increasing due to increased health concerns such as vitamin insufficiency and gastrointestinal disease incidences caused among major portion of the population due to poor eating habits. Furthermore, the growth in demand for functional food and beverages due to a busy lifestyle in this region also adds to the market growth. In addition to this, the rising awareness about the health advantages of natural vitamin E increases the demand for market.
Asia Pacific is expected to witness the fastest growth during the forecast period. The natural vitamin E market is in its infancy and is developing at a healthy rate in India and China as people become more aware of the benefits of natural-source vitamins and as more enterprises offer a diverse selection of nutritional goods. The market for natural vitamin E in the Asia Pacific region has been growing because of the substantial opportunity in the natural tocopherols (natural vitamin E) market owing to the presence of several sources of natural vitamin E.
North America Region Natural Vitamin E Market Share in 2022 - 49%
www.thebrainyinsights.com
Check the geographical analysis of this market by requesting a free sample
The product type segment is divided into natural and synthetic. The natural segment dominated the market, with a market share of around 61.2% in 2022. Natural Vitamin E boosts the immune system and improves the eyes, brain, and skin health. Thus, vitamin E maintains good health and the prevention and treatment of disease propelling the segment’s growth.
The application segment is divided into functional food and beverages, pet food and animal feed, infant nutrition, pharmaceuticals and dietary supplements, and cosmetics. The cosmetics segment dominated the market, with a market share of around 38.90% in 2022. Many skin care products today focus on natural elements, such as vitamins and minerals, to keep skin healthy and shining. As a result, vitamin E is considerably needed in cosmetic applications, propelling the segment’s growth.
| Attribute | Description |
|---|---|
| Market Size | Revenue (USD Billion) |
| Market size value in 2022 | USD 3.1 billion |
| Market size value in 2032 | USD 5.0 billion |
| CAGR (2023 to 2032) | 4.9% |
| Historical data | 2019-2021 |
| Base Year | 2022 |
| Forecast | 2023-2032 |
| Regional Segments | North America, Asia Pacific, Europe, Latin America, Middle East and Africa |
| Segments | Product Type, Application |
As per The Brainy Insights, the size of the Natural Vitamin E market was valued at USD 3.1 billion in 2022 to USD 5.0 billion by 2032.
The global Natural Vitamin E market is growing at a CAGR of 4.9% during the forecast period 2023-2032.
North America emerged as the largest Natural Vitamin E market.
1. Introduction
1.1. Objectives of the Study
1.2. Market Definition
1.3. Research Scope
1.4. Currency
1.5. Key Target Audience
2. Research Methodology and Assumptions
3. Executive Summary
4. Premium Insights
4.1. Porter’s Five Forces Analysis
4.2. Value Chain Analysis
4.3. Top Investment Pockets
4.3.1. Market Attractiveness Analysis by Product Type
4.3.2. Market Attractiveness Analysis by Application
4.3.3. Market Attractiveness Analysis by Region
4.4. Industry Trends
5. Market Dynamics
5.1. Market Evaluation
5.2. Drivers
5.2.1. Rising Urbanization
5.3. Restraints
5.3.1. Interactions with Medications
5.4. Opportunities
5.4.1. Alternative Sources
5.5. Challenges
5.5.1. Side Effects of Vitamin E
6. Global Natural Vitamin E Market Analysis and Forecast, By Product Type
6.1. Segment Overview
6.2. Natural
6.3. Synthetic
7. Global Natural Vitamin E Market Analysis and Forecast, By Application
7.1. Segment Overview
7.2. Functional Food and Beverages
7.3. Pet Food and Animal Feed
7.4. Infant Nutrition
7.5. Pharmaceuticals and Dietary Supplements
7.6. Cosmetics
8. Global Natural Vitamin E Market Analysis and Forecast, By Regional Analysis
8.1. Segment Overview
8.2. North America
8.2.1. U.S.
8.2.2. Canada
8.2.3. Mexico
8.3. Europe
8.3.1. Germany
8.3.2. France
8.3.3. U.K.
8.3.4. Italy
8.3.5. Spain
8.4. Asia-Pacific
8.4.1. Japan
8.4.2. China
8.4.3. India
8.5. South America
8.5.1. Brazil
8.6. Middle East and Africa
8.6.1. UAE
8.6.2. South Africa
9. Global Natural Vitamin E Market-Competitive Landscape
9.1. Overview
9.2. Market Share of Key Players in Global Natural Vitamin E Market
9.2.1. Global Company Market Share
9.2.2. North America Company Market Share
9.2.3. Europe Company Market Share
9.2.4. APAC Company Market Share
9.3. Competitive Situations and Trends
9.3.1. Product Launches and Developments
9.3.2. Partnerships, Collaborations, and Agreements
9.3.3. Mergers & Acquisitions
9.3.4. Expansions
10. Company Profiles
10.1. RIKEN VITAMIN Co., Ltd.
10.1.1. Business Overview
10.1.2. Company Snapshot
10.1.3. Company Market Share Analysis
10.1.4. Company Product Portfolio
10.1.5. Recent Developments
10.1.6. SWOT Analysis
10.2. Wilmar International Limited
10.2.1. Business Overview
10.2.2. Company Snapshot
10.2.3. Company Market Share Analysis
10.2.4. Company Product Portfolio
10.2.5. Recent Developments
10.2.6. SWOT Analysis
10.3. Southwest Synthetic Pharmaceuticals Corp Ltd.
10.3.1. Business Overview
10.3.2. Company Snapshot
10.3.3. Company Market Share Analysis
10.3.4. Company Product Portfolio
10.3.5. Recent Developments
10.3.6. SWOT Analysis
10.4. Zhejiang Worldbestve Biotechnology Co., Ltd.
10.4.1. Business Overview
10.4.2. Company Snapshot
10.4.3. Company Market Share Analysis
10.4.4. Company Product Portfolio
10.4.5. Recent Developments
10.4.6. SWOT Analysis
10.5. ADM
10.5.1. Business Overview
10.5.2. Company Snapshot
10.5.3. Company Market Share Analysis
10.5.4. Company Product Portfolio
10.5.5. Recent Developments
10.5.6. SWOT Analysis
10.6. Davos Life Science
10.6.1. Business Overview
10.6.2. Company Snapshot
10.6.3. Company Market Share Analysis
10.6.4. Company Product Portfolio
10.6.5. Recent Developments
10.6.6. SWOT Analysis
10.7. DSM
10.7.1. Business Overview
10.7.2. Company Snapshot
10.7.3. Company Market Share Analysis
10.7.4. Company Product Portfolio
10.7.5. Recent Developments
10.7.6. SWOT Analysis
10.8. BASF SE
10.8.1. Business Overview
10.8.2. Company Snapshot
10.8.3. Company Market Share Analysis
10.8.4. Company Product Portfolio
10.8.5. Recent Developments
10.8.6. SWOT Analysis
10.9. Beijing Gingko Group
10.9.1. Business Overview
10.9.2. Company Snapshot
10.9.3. Company Market Share Analysis
10.9.4. Company Product Portfolio
10.9.5. Recent Developments
10.9.6. SWOT Analysis
10.10. Hangzhou Gosun Biotech Co. Ltd
10.10.1. Business Overview
10.10.2. Company Snapshot
10.10.3. Company Market Share Analysis
10.10.4. Company Product Portfolio
10.10.5. Recent Developments
10.10.6. SWOT Analysis
10.11. FenchemBiotek
10.11.1. Business Overview
10.11.2. Company Snapshot
10.11.3. Company Market Share Analysis
10.11.4. Company Product Portfolio
10.11.5. Recent Developments
10.11.6. SWOT Analysis
10.12. Parchem fine & specialty chemicals
10.12.1. Business Overview
10.12.2. Company Snapshot
10.12.3. Company Market Share Analysis
10.12.4. Company Product Portfolio
10.12.5. Recent Developments
10.12.6. SWOT Analysis
10.13. Eisai Co., Ltd.
10.13.1. Business Overview
10.13.2. Company Snapshot
10.13.3. Company Market Share Analysis
10.13.4. Company Product Portfolio
10.13.5. Recent Developments
10.13.6. SWOT Analysis
List of Table
1. Global Natural Vitamin E Market, By Product Type, 2019-2032 (USD Billion)
2. Global Natural, Natural Vitamin E Market, By Region, 2019-2032 (USD Billion)
3. Global Synthetic, Natural Vitamin E Market, By Region, 2019-2032 (USD Billion)
4. Global Natural Vitamin E Market, By Application, 2019-2032 (USD Billion)
5. Global Functional Food and Beverages, Natural Vitamin E Market, By Region, 2019-2032 (USD Billion)
6. Global Pet Food and Animal Feed, Natural Vitamin E Market, By Region, 2019-2032 (USD Billion)
7. Global Infant Nutrition, Natural Vitamin E Market, By Region, 2019-2032 (USD Billion)
8. Global Pharmaceuticals and Dietary Supplements, Natural Vitamin E Market, By Region, 2019-2032 (USD Billion)
9. Global Cosmetics, Natural Vitamin E Market, By Region, 2019-2032 (USD Billion)
10. North America Natural Vitamin E Market, By Product Type, 2019-2032 (USD Billion)
11. North America Natural Vitamin E Market, By Application, 2019-2032 (USD Billion)
12. U.S. Natural Vitamin E Market, By Product Type, 2019-2032 (USD Billion)
13. U.S. Natural Vitamin E Market, By Application, 2019-2032 (USD Billion)
14. Canada Natural Vitamin E Market, By Product Type, 2019-2032 (USD Billion)
15. Canada Natural Vitamin E Market, By Application, 2019-2032 (USD Billion)
16. Mexico Natural Vitamin E Market, By Product Type, 2019-2032 (USD Billion)
17. Mexico Natural Vitamin E Market, By Application, 2019-2032 (USD Billion)
18. Europe Natural Vitamin E Market, By Product Type, 2019-2032 (USD Billion)
19. Europe Natural Vitamin E Market, By Application, 2019-2032 (USD Billion)
20. Germany Natural Vitamin E Market, By Product Type, 2019-2032 (USD Billion)
21. Germany Natural Vitamin E Market, By Application, 2019-2032 (USD Billion)
22. France Natural Vitamin E Market, By Product Type, 2019-2032 (USD Billion)
23. France Natural Vitamin E Market, By Application, 2019-2032 (USD Billion)
24. U.K. Natural Vitamin E Market, By Product Type, 2019-2032 (USD Billion)
25. U.K. Natural Vitamin E Market, By Application, 2019-2032 (USD Billion)
26. Italy Natural Vitamin E Market, By Product Type, 2019-2032 (USD Billion)
27. Italy Natural Vitamin E Market, By Application, 2019-2032 (USD Billion)
28. Spain Natural Vitamin E Market, By Product Type, 2019-2032 (USD Billion)
29. Spain Natural Vitamin E Market, By Application, 2019-2032 (USD Billion)
30. Asia Pacific Natural Vitamin E Market, By Product Type, 2019-2032 (USD Billion)
31. Asia Pacific Natural Vitamin E Market, By Application, 2019-2032 (USD Billion)
32. Japan Natural Vitamin E Market, By Product Type, 2019-2032 (USD Billion)
33. Japan Natural Vitamin E Market, By Application, 2019-2032 (USD Billion)
34. China Natural Vitamin E Market, By Product Type, 2019-2032 (USD Billion)
35. China Natural Vitamin E Market, By Application, 2019-2032 (USD Billion)
36. India Natural Vitamin E Market, By Product Type, 2019-2032 (USD Billion)
37. India Natural Vitamin E Market, By Application, 2019-2032 (USD Billion)
38. South America Natural Vitamin E Market, By Product Type, 2019-2032 (USD Billion)
39. South America Natural Vitamin E Market, By Application, 2019-2032 (USD Billion)
40. Brazil Natural Vitamin E Market, By Product Type, 2019-2032 (USD Billion)
41. Brazil Natural Vitamin E Market, By Application, 2019-2032 (USD Billion)
42. Middle East and Africa Natural Vitamin E Market, By Product Type, 2019-2032 (USD Billion)
43. Middle East and Africa Natural Vitamin E Market, By Application, 2019-2032 (USD Billion)
44. UAE Natural Vitamin E Market, By Product Type, 2019-2032 (USD Billion)
45. UAE Natural Vitamin E Market, By Application, 2019-2032 (USD Billion)
46. South Africa Natural Vitamin E Market, By Product Type, 2019-2032 (USD Billion)
47. South Africa Natural Vitamin E Market, By Application, 2019-2032 (USD Billion)
List of Figures
1. Global Natural Vitamin E Market Segmentation
2. Global Natural Vitamin E Market: Research Methodology
3. Market Size Estimation Methodology: Bottom-Up Approach
4. Market Size Estimation Methodology: Top-Down Approach
5. Data Triangulation
6. Porter’s Five Forces Analysis
7. Value Chain Analysis
8. Global Natural Vitamin E Market Attractiveness Analysis by Product Type
9. Global Natural Vitamin E Market Attractiveness Analysis by Application
10. Global Natural Vitamin E Market Attractiveness Analysis by Region
11. Global Natural Vitamin E Market: Dynamics
12. Global Natural Vitamin E Market Share by Product Type (2023 & 2032)
13. Global Natural Vitamin E Market Share by Application (2023 & 2032)
14. Global Natural Vitamin E Market Share by Regions (2023 & 2032)
15. Global Natural Vitamin E Market Share by Company (2022)
This study forecasts global, regional, and country revenue from 2019 to 2032. The Brainy Insights has segmented the global Natural Vitamin E market based on the below-mentioned segments:
Global Natural Vitamin E Market By Product Type:
Global Natural Vitamin E Market By Application:
Global Natural Vitamin E Market By Region:
Research has its special purpose to undertake marketing efficiently. In this competitive scenario, businesses need information across all industry verticals; the information about customer wants, market demand, competition, industry trends, distribution channels etc. This information needs to be updated regularly because businesses operate in a dynamic environment. Our organization, The Brainy Insights incorporates scientific and systematic research procedures in order to get proper market insights and industry analysis for overall business success. The analysis consists of studying the market from a miniscule level wherein we implement statistical tools which helps us in examining the data with accuracy and precision.
Our research reports feature both; quantitative and qualitative aspects for any market. Qualitative information for any market research process are fundamental because they reveal the customer needs and wants, usage and consumption for any product/service related to a specific industry. This in turn aids the marketers/investors in knowing certain perceptions of the customers. Qualitative research can enlighten about the different product concepts and designs along with unique service offering that in turn, helps define marketing problems and generate opportunities. On the other hand, quantitative research engages with the data collection process through interviews, e-mail interactions, surveys and pilot studies. Quantitative aspects for the market research are useful to validate the hypotheses generated during qualitative research method, explore empirical patterns in the data with the help of statistical tools, and finally make the market estimations.
The Brainy Insights offers comprehensive research and analysis, based on a wide assortment of factual insights gained through interviews with CXOs and global experts and secondary data from reliable sources. Our analysts and industry specialist assume vital roles in building up statistical tools and analysis models, which are used to analyse the data and arrive at accurate insights with exceedingly informative research discoveries. The data provided by our organization have proven precious to a diverse range of companies, facilitating them to address issues such as determining which products/services are the most appealing, whether or not customers use the product in the manner anticipated, the purchasing intentions of the market and many others.
Our research methodology encompasses an idyllic combination of primary and secondary initiatives. Key phases involved in this process are listed below:

The phase involves the gathering and collecting of market data and its related information with the help of different sources & research procedures.

The data procurement stage involves in data gathering and collecting through various data sources.
This stage involves in extensive research. These data sources includes:
Purchased Database: Purchased databases play a crucial role in estimating the market sizes irrespective of the domain. Our purchased database includes:
Primary Research: The Brainy Insights interacts with leading companies and experts of the concerned domain to develop the analyst team’s market understanding and expertise. It improves and substantiates every single data presented in the market reports. Primary research mainly involves in telephonic interviews, E-mail interactions and face-to-face interviews with the raw material providers, manufacturers/producers, distributors, & independent consultants. The interviews that we conduct provides valuable data on market size and industry growth trends prevailing in the market. Our organization also conducts surveys with the various industry experts in order to gain overall insights of the industry/market. For instance, in healthcare industry we conduct surveys with the pharmacists, doctors, surgeons and nurses in order to gain insights and key information of a medical product/device/equipment which the customers are going to usage. Surveys are conducted in the form of questionnaire designed by our own analyst team. Surveys plays an important role in primary research because surveys helps us to identify the key target audiences of the market. Additionally, surveys helps to identify the key target audience engaged with the market. Our survey team conducts the survey by targeting the key audience, thus gaining insights from them. Based on the perspectives of the customers, this information is utilized to formulate market strategies. Moreover, market surveys helps us to understand the current competitive situation of the industry. To be precise, our survey process typically involve with the 360 analysis of the market. This analytical process begins by identifying the prospective customers for a product or service related to the market/industry to obtain data on how a product/service could fit into customers’ lives.

Secondary Research: The secondary data sources includes information published by the on-profit organizations such as World bank, WHO, company fillings, investor presentations, annual reports, national government documents, statistical databases, blogs, articles, white papers and others. From the annual report, we analyse a company’s revenue to understand the key segment and market share of that organization in a particular region. We analyse the company websites and adopt the product mapping technique which is important for deriving the segment revenue. In the product mapping method, we select and categorize the products offered by the companies catering to domain specific market, deduce the product revenue for each of the companies so as to get overall estimation of the market size. We also source data and analyses trends based on information received from supply side and demand side intermediaries in the value chain. The supply side denotes the data gathered from supplier, distributor, wholesaler and the demand side illustrates the data gathered from the end customers for respective market domain.

The supply side for a domain specific market is analysed by:
The demand side for the market is estimated through:
In-house Library: Apart from these third-party sources, we have our in-house library of qualitative and quantitative information. Our in-house database includes market data for various industry and domains. These data are updated on regular basis as per the changing market scenario. Our library includes, historic databases, internal audit reports and archives.
Sometimes there are instances where there is no metadata or raw data available for any domain specific market. For those cases, we use our expertise to forecast and estimate the market size in order to generate comprehensive data sets. Our analyst team adopt a robust research technique in order to produce the estimates:
Data Synthesis: This stage involves the analysis & mapping of all the information obtained from the previous step. It also involves in scrutinizing the data for any discrepancy observed while data gathering related to the market. The data is collected with consideration to the heterogeneity of sources. Robust scientific techniques are in place for synthesizing disparate data sets and provide the essential contextual information that can orient market strategies. The Brainy Insights has extensive experience in data synthesis where the data passes through various stages:


Market Deduction & Formulation: The final stage comprises of assigning data points at appropriate market spaces so as to deduce feasible conclusions. Analyst perspective & subject matter expert based holistic form of market sizing coupled with industry analysis also plays a crucial role in this stage.
This stage involves in finalization of the market size and numbers that we have collected from data integration step. With data interpolation, it is made sure that there is no gap in the market data. Successful trend analysis is done by our analysts using extrapolation techniques, which provide the best possible forecasts for the market.
Data Validation & Market Feedback: Validation is the most important step in the process. Validation & re-validation via an intricately designed process helps us finalize data-points to be used for final calculations.

The Brainy Insights interacts with leading companies and experts of the concerned domain to develop the analyst team’s market understanding and expertise. It improves and substantiates every single data presented in the market reports. The data validation interview and discussion panels are typically composed of the most experienced industry members. The participants include, however, are not limited to:
Moreover, we always validate our data and findings through primary respondents from all the major regions we are working on.


Free Customization
Fortune 500 Clients
Free Yearly Update On Purchase Of Multi/Corporate License
Companies Served Till Date