- +1-315-215-1633
- sales@thebrainyinsights.com

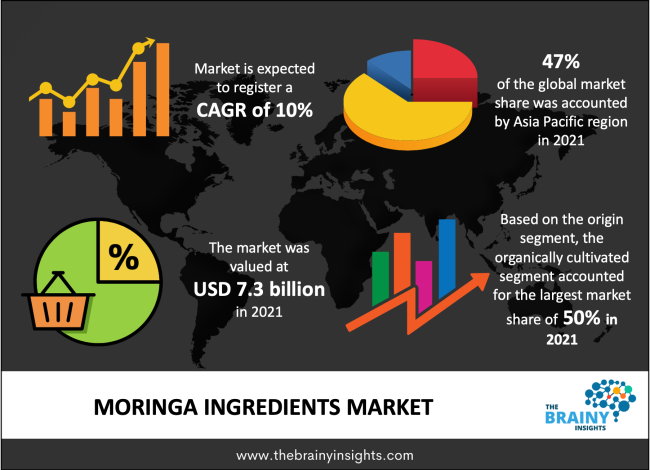
The moringa ingredients market was estimated at around 7.3 billion in 2021, growing at a CAGR of nearly 10% during 2022-2030. The market is projected to reach approximately USD 15 billion by 2030.
The edible elements of the moringa tree, including as its pods, flowers, leaves, bark, seeds, and other sections, are referred to as "moringa ingredients." These meals are rich in protein, beta-carotene, calcium, phosphorus, potassium, carbohydrates, iron, vitamins, and other bioactive elements. The food and beverage sector is rapidly growing, and the general public is becoming more aware of the nutritional advantages of moringa components, all of which are supporting the market expansion of this product. The traditional origin category dominated the Indian moringa ingredients market in 2021 as a result of the growers' excellent output. The favourable climate and top-notch land contribute significantly to the nation's market value.
Growing consumer awareness of the health benefits of moringa, which is utilised to manufacture a variety of goods, including tea, functional meals, and nutritional supplements, is another factor driving market growth. Farmers around the country are constantly enhancing their farming practises, which is aiding market expansion, as a result of expanding automobile reach and agricultural sector learnings. The farmers are improving the value of their income by substituting more modern farming practises for their outmoded ones. The market is significantly impacted by the availability of moringa plant leaves, pods, and other nutritious components. The major players are buying these raw materials from the indigenous peoples, but over time, moringa cultivation is spreading to non-native peoples in North America, South America, and Europe.
Get an overview of this study by requesting a free sample
Following COVID-19, consumers are more concerned with safeguarding their health, which is anticipated to drive global sales of dietary supplements. Additionally, the rise in demand for moringa products is being positively impacted by consumer demand for plant-based supplements, which is in turn boosting the sale of moringa ingredients. Maintaining sanitation, boosting immunity to new coronavirus strains, and adhering to all medical advice are now necessities in the current situation. In order to combat this epidemic, the World Health Organization (WHO) advises that the entire world's population consume immunity-boosting foods. As a result, customers have begun to purchase immunity-boosting supplements, which is encouraging for the sales of moringa ingredients.
Rising personal disposable income to accelerate the market’s growth
Because of growing populations and rising per capita incomes, which have changed consumer preferences for more organic, healthy, and environmentally friendly foods, the Moringa Ingredients industry has been expanding in a variety of ways across all market segments and geographical areas. This has created a market for Moringa Ingredients businesses. The primary drivers behind the expansion of the moringa ingredients market are increasing personal disposable income and an increase in the number of eateries, hotels, and other similar food and beverage establishments, particularly in developing economies. Changing lifestyles, westernization, increased research and development efforts made by major companies, particularly in developing economies, rising demand for food supplements among the population, soaring public awareness of the advantages of moringa ingredients, and ongoing changes in consumer dietary habits are driving the market for moringa ingredients.
Improved distribution channels, expanding health and fitness consciousness, increased knowledge of the medical benefits of moringa-based goods, growing use of plant-based cosmetics, rising interest in organic products, rising demand for plant-based protein, and growing adoption of urban lifestyle will further induce growth in the moringa ingredients market value.
For human consumption, ingredients with an organic origin are less hazardous than those with a conventional origin. Ingredients of normal and organic origin are also environmentally sociable because they don't significantly contribute to serious environmental contamination. Due to the growing customer demand for environmentally friendly products, producers in a variety of industry sectors, including cosmetics & personal care, pharmaceuticals, food & beverage, are stirring to the usage of organically derived chemicals.
Farmers can employ organic fertilisers to boost agricultural production by looking at changes in the end-use market. The growing public understanding of the health benefits of consuming organic food, particularly within the group of health nuts, is supporting the segmental market value further.
The food and beverage industry will generate 55% of total revenues in 2021. The area contains ready-to-eat moringa goods, which make up most of the market share, as well as ready-to-cook moringa product lines such moringa powder and moringa tea. The world's urban populations' growing desire for functional food is what drives the food and beverage industry's highest revenue share.
Asia Pacific dominated the market and generated 45.8% of the total revenue in 2020. India is the main country farming and supplying the plant on the international market because of its climate, which is ideal for growing moringa. Farmers' growing learning habits and technological developments in agricultural practises promote the regional market value.
The growing urbanisation of developing countries like India is driving up demand for functional foods. The growing awareness of the health benefits of moringa components among urban dwellers is promoting revenue growth and further development. The above-mentioned countries are ostensibly undergoing a variety of changes in their agricultural practises and associated technical advancements.
The enhanced agricultural techniques utilised for moringa growth improve the ability to supply and distribute ingredients in the local as well as regional market. This in turn ensures the maximum revenue share for the local market. The market is growing as a result of the steadily increasing demand in the emerging economies of the region and the growing purchasing power of the public. Additionally, the Asia Pacific area is home to high potential markets where the demand for new products is rising, such as India and China.
The global moringa ingredients market is segmented as follows:
By Origin
By Application
By Region/Geography
| Attribute | Description |
|---|---|
| Base Year | 2021 |
| Forecast period | 2022-2030 |
| Report Coverage | Revenue estimation and forecast, company profile, competitive landscape, growth factors, and recent trends |
| Regional scope | North America, Europe, Asia Pacific, Middle East & Africa, and Latin America |
| Market Size(unit) | USD Billion |
| CAGR (2022 to 2030) | 10% |
| Segments Covered |
By Origin |
1. Introduction
1.1. Objectives of the Study
1.2. Market Definition
1.3. Research Scope
2. Research Methodology and Assumptions
3. Executive Summary
4. Premium Insights
4.1. Porter’s Five Forces Analysis
4.2. Value Chain Analysis
4.3. Top Investment Pockets
4.3.1. Market Attractiveness Analysis By Origin
4.3.2. Market Attractiveness Analysis By Application
4.4. Industry Trends
5. Market Dynamics
5.1. Market Evaluation
5.2. Drivers
5.2.1. Increasing population to accelerate the market’s growth
5.2.2. Better yield than conventional ones
5.3. Restrains
5.3.1. Availability of substitute materials would hamper the market
5.4. Opportunities
5.4.1. Increasing Urbanization
6. Global Moringa Ingredients Market Analysis and Forecast, By Origin
6.1. Segment Overview
6.2. Organic
6.3. Conventional
7. Global Moringa Ingredients Market Analysis and Forecast, By Application
7.1. Segment Overview
7.2. Food & Beverages
7.3. Pharmaceuticals
7.4. Others
8. Global Moringa Ingredients Market Analysis and Forecast, By Regional Analysis
8.1. Segment Overview
8.2. North America
8.2.1. U.S.
8.2.2. Canada
8.2.3. Mexico
8.3. Europe
8.3.1. Germany
8.3.2. France
8.3.3. U.K.
8.3.4. Italy
8.3.5. Spain
8.3.6. Rest of Europe
8.4. Asia-Pacific
8.4.1. Japan
8.4.2. China
8.4.3. India
8.4.4. Australia
8.4.5. South Korea
8.4.6. Rest of Asia-Pacific
8.5. South America
8.5.1. Brazil
8.5.2. Argentina
8.5.3. Rest of South America
8.6. Middle East and Africa
8.6.1. UAE
8.6.2. South Africa
8.6.3. Egypt
8.6.4. Kuwait
8.6.5. Saudi Arabia
8.6.6. Rest of Middle East & Africa
9. Global Moringa Ingredients Market-Competitive Landscape
9.1. Overview
9.2. Market Share of Key Players in the Moringa Ingredients market
9.2.1. Global Company Market Share
9.2.2. North America Company Market Share
9.2.3. Europe Company Market Share
9.2.4. APAC Company Market Share
9.3. Competitive Situations and Trends
9.3.1. Origin Launches and Developments
9.3.2. Partnerships, Collaborations, and Agreements
9.3.3. Mergers & Acquisitions
9.3.4. Expansions
10. Company Profiles
10.1. Organic India Pvt Ltd
10.1.1. Business Overview
10.1.2. Company Snapshot
10.1.3. Company Market Share Analysis
10.1.4. Company Application Portfolio
10.1.5. Recent Developments
10.1.6. SWOT Analysis
10.2. Earth Expo Company
10.2.1. Business Overview
10.2.2. Company Snapshot
10.2.3. Company Market Share Analysis
10.2.4. Company Application Portfolio
10.2.5. Recent Developments
10.2.6. SWOT Analysis
10.3. Kulikuli Inc.
10.3.1. Business Overview
10.3.2. Company Snapshot
10.3.3. Company Market Share Analysis
10.3.4. Company Application Portfolio
10.3.5. Recent Developments
10.3.6. SWOT Analysis
10.4. Grenera Nutrients Pvt
10.4.1. Business Overview
10.4.2. Company Snapshot
10.4.3. Company Market Share Analysis
10.4.4. Company Application Portfolio
10.4.5. Recent Developments
10.4.6. SWOT Analysis
10.5. Botanica Natural Products
10.5.1. Business Overview
10.5.2. Company Snapshot
10.5.3. Company Market Share Analysis
10.5.4. Company Application Portfolio
10.5.5. Recent Developments
10.5.6. SWOT Analysis
10.6. Aayuritz Phytonutrients Pvt Ltd.
10.6.1. Business Overview
10.6.2. Company Snapshot
10.6.3. Company Market Share Analysis
10.6.4. Company Application Portfolio
10.6.5. Recent Developments
10.6.6. SWOT Analysis
10.7. Herbs & Crops Overseas
10.7.1. Business Overview
10.7.2. Company Snapshot
10.7.3. Company Market Share Analysis
10.7.4. Company Application Portfolio
10.7.5. Recent Developments
10.7.6. SWOT Analysis
10.8. Dominate Industries
10.8.1. Business Overview
10.8.2. Company Snapshot
10.8.3. Company Market Share Analysis
10.8.4. Company Application Portfolio
10.8.5. Recent Developments
10.8.6. SWOT Analysis
10.9. Moringa Initiative Ltd.
10.9.1. Business Overview
10.9.2. Company Snapshot
10.9.3. Company Market Share Analysis
10.9.4. Company Application Portfolio
10.9.5. Recent Developments
10.9.6. SWOT Analysis
10.10. Green Virgin Products LLC
10.10.1. Business Overview
10.10.2. Company Snapshot
10.10.3. Company Market Share Analysis
10.10.4. Company Application Portfolio
10.10.5. Recent Developments
10.10.6. SWOT Analysis
List of Table
1. Global Moringa Ingredients Market, By Origin, 2022-2030(USD Billion)
2. Global Organic Moringa Ingredients Market, By Region, 2022-2030(USD Billion)
3. Global Conventional Moringa Ingredients Market, By Region, 2022-2030(USD Billion)
4. Global Moringa Ingredients Market, By Application, 2022-2030(USD Billion)
5. Global Food & Beverages Moringa Ingredients Market, By Region, 2022-2030(USD Billion)
6. Global Pharmaceuticals Moringa Ingredients Market, By Region, 2022-2030(USD Billion)
7. Global Others Moringa Ingredients Market, By Region, 2022-2030(USD Billion)
8. Global Moringa Ingredients Market, By Region, 2022-2030(USD Billion)
9. Global Moringa Ingredients Market, By North America, 2022-2030(USD Billion)
10. North America Moringa Ingredients Market, By Origin, 2022-2030(USD Billion)
11. North America Moringa Ingredients Market, By Application, 2022-2030(USD Billion)
12. U.S. Moringa Ingredients Market, By Origin, 2022-2030(USD Billion)
13. U.S. Moringa Ingredients Market, By Application, 2022-2030(USD Billion)
14. Canada Moringa Ingredients Market, By Origin, 2022-2030(USD Billion)
15. Canada Moringa Ingredients Market, By Application, 2022-2030(USD Billion)
16. Mexico Moringa Ingredients Market, By Origin, 2022-2030(USD Billion)
17. Mexico Moringa Ingredients Market, By Application, 2022-2030(USD Billion)
18. Europe Moringa Ingredients Market, By Origin, 2022-2030(USD Billion)
19. Europe Moringa Ingredients Market, By Application, 2022-2030(USD Billion)
20. Germany Moringa Ingredients Market, By Origin, 2022-2030(USD Billion)
21. Germany Moringa Ingredients Market, By Application, 2022-2030(USD Billion)
22. France Moringa Ingredients Market, By Origin, 2022-2030(USD Billion)
23. France Moringa Ingredients Market, By Application, 2022-2030(USD Billion)
24. U.K. Moringa Ingredients Market, By Origin, 2022-2030(USD Billion)
25. U.K. Moringa Ingredients Market, By Application, 2022-2030(USD Billion)
26. Italy Moringa Ingredients Market, By Origin, 2022-2030(USD Billion)
27. Italy Moringa Ingredients Market, By Application, 2022-2030(USD Billion)
28. Spain Moringa Ingredients Market, By Origin, 2022-2030(USD Billion)
29. Spain Moringa Ingredients Market, By Application, 2022-2030(USD Billion)
30. Rest of Europe Moringa Ingredients Market, By Origin, 2022-2030(USD Billion)
31. Rest of Europe Moringa Ingredients Market, By Application, 2022-2030(USD Billion)
32. Asia Pacific Moringa Ingredients Market, By Origin, 2022-2030(USD Billion)
33. Asia Pacific Moringa Ingredients Market, By Application, 2022-2030(USD Billion)
34. Japan Moringa Ingredients Market, By Origin, 2022-2030(USD Billion)
35. Japan Moringa Ingredients Market, By Application, 2022-2030(USD Billion)
36. China Moringa Ingredients Market, By Origin, 2022-2030(USD Billion)
37. China Moringa Ingredients Market, By Application, 2022-2030(USD Billion)
38. India Moringa Ingredients Market, By Origin, 2022-2030(USD Billion)
39. India Moringa Ingredients Market, By Application, 2022-2030(USD Billion)
40. Australia Moringa Ingredients Market, By Origin, 2022-2030(USD Billion)
41. Australia Moringa Ingredients Market, By Application, 2022-2030(USD Billion)
42. South Korea Moringa Ingredients Market, By Origin, 2022-2030(USD Billion)
43. South Korea Moringa Ingredients Market, By Application, 2022-2030(USD Billion)
44. Rest of Asia-Pacific Moringa Ingredients Market, By Origin, 2022-2030(USD Billion)
45. Rest of Asia-Pacific Moringa Ingredients Market, By Application, 2022-2030(USD Billion)
46. South America Moringa Ingredients Market, By Origin, 2022-2030(USD Billion)
47. South America Moringa Ingredients Market, By Application, 2022-2030(USD Billion)
48. Brazil Moringa Ingredients Market, By Origin, 2022-2030(USD Billion)
49. Brazil Moringa Ingredients Market, By Application, 2022-2030(USD Billion)
50. Argentina Moringa Ingredients Market, By Origin, 2022-2030(USD Billion)
51. Argentina Moringa Ingredients Market, By Application, 2022-2030(USD Billion)
52. Rest of Latin America Moringa Ingredients Market, By Origin, 2022-2030(USD Billion)
53. Rest of Latin America Moringa Ingredients Market, By Application, 2022-2030(USD Billion)
54. Middle East and Africa Moringa Ingredients Market, By Origin, 2022-2030(USD Billion)
55. Middle East and Africa Moringa Ingredients Market, By Application, 2022-2030(USD Billion)
56. UAE Moringa Ingredients Market, By Origin, 2022-2030(USD Billion)
57. UAE Moringa Ingredients Market, By Application, 2022-2030(USD Billion)
58. South Africa Moringa Ingredients Market, By Origin, 2022-2030(USD Billion)
59. South Africa Moringa Ingredients Market, By Application, 2022-2030(USD Billion)
60. Egypt Moringa Ingredients Market, By Origin, 2022-2030(USD Billion)
61. Egypt Moringa Ingredients Market, By Application, 2022-2030(USD Billion)
62. Kuwait Moringa Ingredients Market, By Origin, 2022-2030(USD Billion)
63. Kuwait Moringa Ingredients Market, By Application, 2022-2030(USD Billion)
64. Saudi Arabia Moringa Ingredients Market, By Origin, 2022-2030(USD Billion)
65. Saudi Arabia Moringa Ingredients Market, By Application, 2022-2030(USD Billion)
66. Rest of Middle East Moringa Ingredients Market, By Origin, 2022-2030(USD Billion)
67. Rest of Middle East Moringa Ingredients Market, By Application, 2022-2030(USD Billion)
List of Figures
1. Global Moringa Ingredients Market Segmentation
2. Moringa Ingredients Market: Research Methodology
3. Market Size Estimation Methodology: Bottom-Up Approach
4. Market Size Estimation Methodology: Top-Down Approach
5. Data Triangulation
6. Porter’s Five Forces Analysis
7. Value Chain Analysis
8. Global Moringa Ingredients Market Attractiveness Analysis By Origin
9. Global Moringa Ingredients Market Attractiveness Analysis By Application
10. Global Moringa Ingredients Market Attractiveness Analysis By Region
11. Global Moringa Ingredients Market: Dynamics
12. Global Moringa Ingredients Market Share By Origin(2022 & 2030)
13. Global Moringa Ingredients Market Share By Application(2022 & 2030)
14. Global Moringa Ingredients Market Share by Regions (2022 & 2030)
15. Global Moringa Ingredients Market Share by Company (2021)
By Origin
By Application
By Region/Geography
Research has its special purpose to undertake marketing efficiently. In this competitive scenario, businesses need information across all industry verticals; the information about customer wants, market demand, competition, industry trends, distribution channels etc. This information needs to be updated regularly because businesses operate in a dynamic environment. Our organization, The Brainy Insights incorporates scientific and systematic research procedures in order to get proper market insights and industry analysis for overall business success. The analysis consists of studying the market from a miniscule level wherein we implement statistical tools which helps us in examining the data with accuracy and precision.
Our research reports feature both; quantitative and qualitative aspects for any market. Qualitative information for any market research process are fundamental because they reveal the customer needs and wants, usage and consumption for any product/service related to a specific industry. This in turn aids the marketers/investors in knowing certain perceptions of the customers. Qualitative research can enlighten about the different product concepts and designs along with unique service offering that in turn, helps define marketing problems and generate opportunities. On the other hand, quantitative research engages with the data collection process through interviews, e-mail interactions, surveys and pilot studies. Quantitative aspects for the market research are useful to validate the hypotheses generated during qualitative research method, explore empirical patterns in the data with the help of statistical tools, and finally make the market estimations.
The Brainy Insights offers comprehensive research and analysis, based on a wide assortment of factual insights gained through interviews with CXOs and global experts and secondary data from reliable sources. Our analysts and industry specialist assume vital roles in building up statistical tools and analysis models, which are used to analyse the data and arrive at accurate insights with exceedingly informative research discoveries. The data provided by our organization have proven precious to a diverse range of companies, facilitating them to address issues such as determining which products/services are the most appealing, whether or not customers use the product in the manner anticipated, the purchasing intentions of the market and many others.
Our research methodology encompasses an idyllic combination of primary and secondary initiatives. Key phases involved in this process are listed below:

The phase involves the gathering and collecting of market data and its related information with the help of different sources & research procedures.

The data procurement stage involves in data gathering and collecting through various data sources.
This stage involves in extensive research. These data sources includes:
Purchased Database: Purchased databases play a crucial role in estimating the market sizes irrespective of the domain. Our purchased database includes:
Primary Research: The Brainy Insights interacts with leading companies and experts of the concerned domain to develop the analyst team’s market understanding and expertise. It improves and substantiates every single data presented in the market reports. Primary research mainly involves in telephonic interviews, E-mail interactions and face-to-face interviews with the raw material providers, manufacturers/producers, distributors, & independent consultants. The interviews that we conduct provides valuable data on market size and industry growth trends prevailing in the market. Our organization also conducts surveys with the various industry experts in order to gain overall insights of the industry/market. For instance, in healthcare industry we conduct surveys with the pharmacists, doctors, surgeons and nurses in order to gain insights and key information of a medical product/device/equipment which the customers are going to usage. Surveys are conducted in the form of questionnaire designed by our own analyst team. Surveys plays an important role in primary research because surveys helps us to identify the key target audiences of the market. Additionally, surveys helps to identify the key target audience engaged with the market. Our survey team conducts the survey by targeting the key audience, thus gaining insights from them. Based on the perspectives of the customers, this information is utilized to formulate market strategies. Moreover, market surveys helps us to understand the current competitive situation of the industry. To be precise, our survey process typically involve with the 360 analysis of the market. This analytical process begins by identifying the prospective customers for a product or service related to the market/industry to obtain data on how a product/service could fit into customers’ lives.

Secondary Research: The secondary data sources includes information published by the on-profit organizations such as World bank, WHO, company fillings, investor presentations, annual reports, national government documents, statistical databases, blogs, articles, white papers and others. From the annual report, we analyse a company’s revenue to understand the key segment and market share of that organization in a particular region. We analyse the company websites and adopt the product mapping technique which is important for deriving the segment revenue. In the product mapping method, we select and categorize the products offered by the companies catering to domain specific market, deduce the product revenue for each of the companies so as to get overall estimation of the market size. We also source data and analyses trends based on information received from supply side and demand side intermediaries in the value chain. The supply side denotes the data gathered from supplier, distributor, wholesaler and the demand side illustrates the data gathered from the end customers for respective market domain.

The supply side for a domain specific market is analysed by:
The demand side for the market is estimated through:
In-house Library: Apart from these third-party sources, we have our in-house library of qualitative and quantitative information. Our in-house database includes market data for various industry and domains. These data are updated on regular basis as per the changing market scenario. Our library includes, historic databases, internal audit reports and archives.
Sometimes there are instances where there is no metadata or raw data available for any domain specific market. For those cases, we use our expertise to forecast and estimate the market size in order to generate comprehensive data sets. Our analyst team adopt a robust research technique in order to produce the estimates:
Data Synthesis: This stage involves the analysis & mapping of all the information obtained from the previous step. It also involves in scrutinizing the data for any discrepancy observed while data gathering related to the market. The data is collected with consideration to the heterogeneity of sources. Robust scientific techniques are in place for synthesizing disparate data sets and provide the essential contextual information that can orient market strategies. The Brainy Insights has extensive experience in data synthesis where the data passes through various stages:


Market Deduction & Formulation: The final stage comprises of assigning data points at appropriate market spaces so as to deduce feasible conclusions. Analyst perspective & subject matter expert based holistic form of market sizing coupled with industry analysis also plays a crucial role in this stage.
This stage involves in finalization of the market size and numbers that we have collected from data integration step. With data interpolation, it is made sure that there is no gap in the market data. Successful trend analysis is done by our analysts using extrapolation techniques, which provide the best possible forecasts for the market.
Data Validation & Market Feedback: Validation is the most important step in the process. Validation & re-validation via an intricately designed process helps us finalize data-points to be used for final calculations.

The Brainy Insights interacts with leading companies and experts of the concerned domain to develop the analyst team’s market understanding and expertise. It improves and substantiates every single data presented in the market reports. The data validation interview and discussion panels are typically composed of the most experienced industry members. The participants include, however, are not limited to:
Moreover, we always validate our data and findings through primary respondents from all the major regions we are working on.


Free Customization
Fortune 500 Clients
Free Yearly Update On Purchase Of Multi/Corporate License
Companies Served Till Date