- +1-315-215-1633
- sales@thebrainyinsights.com

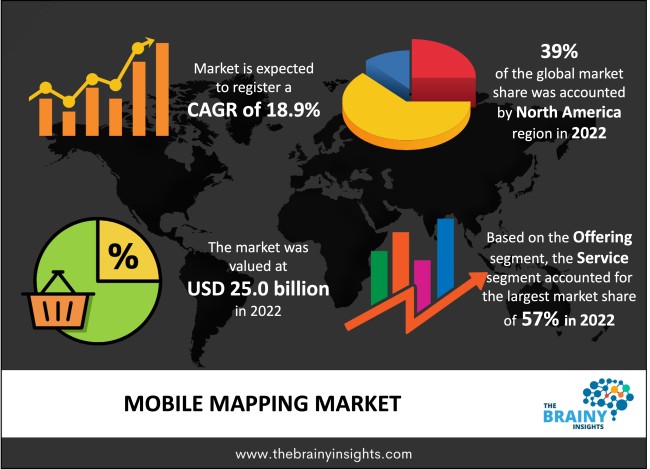
The global mobile mapping market is expected to reach USD 141.1 billion by 2032, at a CAGR of 18.9% during the forecast period 2023 to 2032. Asia Pacific is expected to grow the fastest during the forecast period.
Mobile mapping captures geospatial information utilizing mobile vehicles such as golf carts, cars, aeroplanes, and marine boats. Mobile mapping systems are outfitted with modern imagery systems, inertial measurement units (IMU), measuring tools, and inertial navigation systems (INS). It uses radars, laser scanners, cameras, and speed sensors to aid in viewing, recording, measuring, and analyzing the immediate surroundings. It also aids in swiftly and successfully charting inaccessible places. Aside from that, it provides several benefits, such as increased productivity, accuracy, and safety. Because aerial photogrammetry is time-consuming, numerous firms are transitioning to mobile mapping to obtain geospatial data for cable network installation, fleet management, asset management, and maintenance. It is also due to mobile mapping's faster delivery time and lower cost when compared to other conventional mappings technologies like traditional terrestrial surveying and point-wise GPS. Additionally, smartphone manufacturers outfit phones with motion sensors and low-cost GPS receivers to determine users' positions within a few meters. As a result, integration into smartphones, rapid advancements in satellite mapping technology, and increased smartphone sales are propelling the global mobile mapping market forward.
Get an overview of this study by requesting a free sample
Digitalization- Smart cities are built on digitizing urban infrastructure, resource planning and optimization, and digital methods are the key to successful transformation. Several smart city projects are currently ongoing, broadening the urban development environment through urban digitalization and information and communication technologies. Spatial data is the foundation for urban development planning in smart city projects. It includes detailed terrain data in mixed-reality 3D maps and models. Organizations require a trustworthy and accurate spatial database to construct and operate smart cities and generate revenue for city administrators. The city of Amsterdam, for example, used the Trimble MX7 mobile mapping system for smart city deployment.
Privacy Concerns- The mobile mapping market faces problems due to privacy concerns. People need to use mobile mapping more quickly because of privacy concerns. Furthermore, the high cost of manufacturing also hinders market growth.
Technological Advancements- Rising consumer expectations and technology breakthroughs are driving the growth of the autonomous vehicle infrastructure. The mobile mapping system assists vehicle planning and provides sensors to make autonomous driving safer in poor visibility and situations. Automation can substantially increase the driver's comfort by considering the driving obstacles. Automated driving necessitates top-tier mobile mapping solutions. As a result, introducing autonomous driving and its technological implementation creates lucrative market growth opportunities.
Highly Competitive- The global mobile mapping market is highly competitive as several players want to be at the top, so they introduced several technologies to be at the top. Furthermore, it becomes challenging for the consumer to choose one mobile mapping technology.
The regions analysed for the market include North America, South America, Asia Pacific, Europe, the Middle East, and Africa. North America emerged as the most significant global mobile mapping market, with a 39% market revenue share in 2022.
North America dominates the mobile mapping market with a 39% market revenue share in 2022. The regional market growth is attributed to various variables, including the widespread use of mobile mapping in manufacturing and real estate industries and regional digitalization. Furthermore, the presence of an increasing number of mobile mapping vendors across the United States and Canada will likely give profitable prospects for the industry.
Asia Pacific is expected to witness the fastest growth during the forecast period. Growing government initiatives for satellite imaging attract investment from domestic and foreign firms, and product releases propel the region's market growth. The latest Hovermap ST autonomous drone LiDAR mapping and surveying payload will debut in March 2022, according to Emesent, an independent drone mapping firm with headquarters in Australia. Emesent's LiDAR payloads employ simultaneous localization and mapping (SLAM), a technology in which a drone creates a map while simultaneously localizing itself within that map.
North America Region Mobile Mapping Market Share in 2022 - 39%
www.thebrainyinsights.com
Check the geographical analysis of this market by requesting a free sample
The offering segment is divided into a solution and service. The service segment dominated the market, with a share of around 57% in 2022. The services category grew at the fastest pace during the forecast period, owing to an increase in the usage of mobile mapping services among end users, as they ensure the smooth operation of solutions and platforms throughout the mapping process.
The application segment is divided into imaging services, facility management, aerial mobile mapping, internet application, emergency response planning, and satellite. The satellite segment dominated the market, with a market share of around 33.8% in 2022. Law and security enforcement agencies can use satellite imagery and GIS systems to identify hot spots and other patterns and trends for crime mapping. Reliable detection of spatial crime concentrations and timely mapping of crime sites assist law enforcement in identifying crime concentrations in space and time, providing critical information for crime reduction initiatives. This imagery contributes to this application's speed and efficiency analysis by allowing analysts to overlay other datasets, such as census demographics and retail, bank, and school locations. It assists security department administrators in understanding the root causes of crime and developing strategies. These tactics involve allocating and dispatching police officers to emergencies.
| Attribute | Description |
|---|---|
| Market Size | Revenue (USD Billion) |
| Market size value in 2022 | USD 25.0 billion |
| Market size value in 2032 | USD 141.1 billion |
| CAGR (2023 to 2032) | |
| Historical data | 2019-2021 |
| Base Year | 2022 |
| Forecast | 2023-2032 |
| Regional Segments | North America, Asia Pacific, Europe, Latin America, Middle East and Africa |
| Segments | Offering, Application |
As per The Brainy Insights, the size of the mobile mapping market was valued at USD 25.0 billion in 2022 to USD 141.1 billion by 2032.
The global mobile mapping market is growing at a CAGR of 18.9% during the forecast period 2023-2032.
North America emerged as the largest region within the global mobile mapping market.
1. Introduction
1.1. Objectives of the Study
1.2. Market Definition
1.3. Research Scope
1.4. Currency
1.5. Key Target Audience
2. Research Methodology and Assumptions
3. Executive Summary
4. Premium Insights
4.1. Porter’s Five Forces Analysis
4.2. Value Chain Analysis
4.3. Top Investment Pockets
4.3.1. Market Attractiveness Analysis by Offering
4.3.2. Market Attractiveness Analysis by Application
4.3.3. Market Attractiveness Analysis by Region
4.4. Industry Trends
5. Market Dynamics
5.1. Market Evaluation
5.2. Drivers
5.2.1. Digitalization
5.3. Restraints
5.3.1. Privacy Concerns
5.4. Opportunities
5.4.1. Technological Advancements
5.5. Challenges
5.5.1. Highly Competitive
6. Global Mobile Mapping Market Analysis and Forecast, By Offering
6.1. Segment Overview
6.2. Solution
6.3. Service
7. Global Mobile Mapping Market Analysis and Forecast, By Application
7.1. Segment Overview
7.2. Imaging Services
7.3. Facility Management
7.4. Aerial Mobile Mapping
7.5. Internet Application
7.6. Emergency Response Planning
7.7. Satellite
8. Global Mobile Mapping Market Analysis and Forecast, By Regional Analysis
8.1. Segment Overview
8.2. North America
8.2.1. U.S.
8.2.2. Canada
8.2.3. Mexico
8.3. Europe
8.3.1. Germany
8.3.2. France
8.3.3. U.K.
8.3.4. Italy
8.3.5. Spain
8.4. Asia-Pacific
8.4.1. Japan
8.4.2. China
8.4.3. India
8.5. South America
8.5.1. Brazil
8.6. Middle East and Africa
8.6.1. UAE
8.6.2. South Africa
9. Global Mobile Mapping Market-Competitive Landscape
9.1. Overview
9.2. Market Share of Key Players in Global Mobile Mapping Market
9.2.1. Global Company Market Share
9.2.2. North America Company Market Share
9.2.3. Europe Company Market Share
9.2.4. APAC Company Market Share
9.3. Competitive Situations and Trends
9.3.1. Product Launches and Developments
9.3.2. Partnerships, Collaborations, and Agreements
9.3.3. Mergers & Acquisitions
9.3.4. Expansions
10. Company Profiles
10.1. Microsoft Corporation
10.1.1. Business Overview
10.1.2. Company Snapshot
10.1.3. Company Market Share Analysis
10.1.4. Company Product Portfolio
10.1.5. Recent Developments
10.1.6. SWOT Analysis
10.2. Pasco Corporation
10.2.1. Business Overview
10.2.2. Company Snapshot
10.2.3. Company Market Share Analysis
10.2.4. Company Product Portfolio
10.2.5. Recent Developments
10.2.6. SWOT Analysis
10.3. Qualcomm Inc.
10.3.1. Business Overview
10.3.2. Company Snapshot
10.3.3. Company Market Share Analysis
10.3.4. Company Product Portfolio
10.3.5. Recent Developments
10.3.6. SWOT Analysis
10.4. EveryScape Inc.
10.4.1. Business Overview
10.4.2. Company Snapshot
10.4.3. Company Market Share Analysis
10.4.4. Company Product Portfolio
10.4.5. Recent Developments
10.4.6. SWOT Analysis
10.5. Mitsubishi Electric Corporation
10.5.1. Business Overview
10.5.2. Company Snapshot
10.5.3. Company Market Share Analysis
10.5.4. Company Product Portfolio
10.5.5. Recent Developments
10.5.6. SWOT Analysis
10.6. Trimble Inc.
10.6.1. Business Overview
10.6.2. Company Snapshot
10.6.3. Company Market Share Analysis
10.6.4. Company Product Portfolio
10.6.5. Recent Developments
10.6.6. SWOT Analysis
10.7. Google LLC
10.7.1. Business Overview
10.7.2. Company Snapshot
10.7.3. Company Market Share Analysis
10.7.4. Company Product Portfolio
10.7.5. Recent Developments
10.7.6. SWOT Analysis
10.8. Black & Veatch
10.8.1. Business Overview
10.8.2. Company Snapshot
10.8.3. Company Market Share Analysis
10.8.4. Company Product Portfolio
10.8.5. Recent Developments
10.8.6. SWOT Analysis
10.9. Apple Inc.
10.9.1. Business Overview
10.9.2. Company Snapshot
10.9.3. Company Market Share Analysis
10.9.4. Company Product Portfolio
10.9.5. Recent Developments
10.9.6. SWOT Analysis
10.10. GeoSLAM
10.10.1. Business Overview
10.10.2. Company Snapshot
10.10.3. Company Market Share Analysis
10.10.4. Company Product Portfolio
10.10.5. Recent Developments
10.10.6. SWOT Analysis
10.11. Leica Geosystems
10.11.1. Business Overview
10.11.2. Company Snapshot
10.11.3. Company Market Share Analysis
10.11.4. Company Product Portfolio
10.11.5. Recent Developments
10.11.6. SWOT Analysis
10.12. Hexagon AB
10.12.1. Business Overview
10.12.2. Company Snapshot
10.12.3. Company Market Share Analysis
10.12.4. Company Product Portfolio
10.12.5. Recent Developments
10.12.6. SWOT Analysis
10.13. Novatel Inc
10.13.1. Business Overview
10.13.2. Company Snapshot
10.13.3. Company Market Share Analysis
10.13.4. Company Product Portfolio
10.13.5. Recent Developments
10.13.6. SWOT Analysis
10.14. Foursquare Labs
10.14.1. Business Overview
10.14.2. Company Snapshot
10.14.3. Company Market Share Analysis
10.14.4. Company Product Portfolio
10.14.5. Recent Developments
10.14.6. SWOT Analysis
10.15. Javad GNSS Inc.
10.15.1. Business Overview
10.15.2. Company Snapshot
10.15.3. Company Market Share Analysis
10.15.4. Company Product Portfolio
10.15.5. Recent Developments
10.15.6. SWOT Analysis
10.16. Teledyne Optech LLC
10.16.1. Business Overview
10.16.2. Company Snapshot
10.16.3. Company Market Share Analysis
10.16.4. Company Product Portfolio
10.16.5. Recent Developments
10.16.6. SWOT Analysis
10.17. MapJack
10.17.1. Business Overview
10.17.2. Company Snapshot
10.17.3. Company Market Share Analysis
10.17.4. Company Product Portfolio
10.17.5. Recent Developments
10.17.6. SWOT Analysis
List of Table
1. Global Mobile Mapping Market, By Offering, 2019-2032 (USD Billion)
2. Global Solution, Mobile Mapping Market, By Region, 2019-2032 (USD Billion)
3. Global Service, Mobile Mapping Market, By Region, 2019-2032 (USD Billion)
4. Global Mobile Mapping Market, By Application, 2019-2032 (USD Billion)
5. Global Imaging Services, Mobile Mapping Market, By Region, 2019-2032 (USD Billion)
6. Global Facility Management, Mobile Mapping Market, By Region, 2019-2032 (USD Billion)
7. Global Aerial Mobile Mapping, Mobile Mapping Market, By Region, 2019-2032 (USD Billion)
8. Global Internet Application, Mobile Mapping Market, By Region, 2019-2032 (USD Billion)
9. Global Emergency Response Planning, Mobile Mapping Market, By Region, 2019-2032 (USD Billion)
10. Global Satellite, Mobile Mapping Market, By Region, 2019-2032 (USD Billion)
11. North America Mobile Mapping Market, By Offering, 2019-2032 (USD Billion)
12. North America Mobile Mapping Market, By Application, 2019-2032 (USD Billion)
13. U.S. Mobile Mapping Market, By Offering, 2019-2032 (USD Billion)
14. U.S. Mobile Mapping Market, By Application, 2019-2032 (USD Billion)
15. Canada Mobile Mapping Market, By Offering, 2019-2032 (USD Billion)
16. Canada Mobile Mapping Market, By Application, 2019-2032 (USD Billion)
17. Mexico Mobile Mapping Market, By Offering, 2019-2032 (USD Billion)
18. Mexico Mobile Mapping Market, By Application, 2019-2032 (USD Billion)
19. Europe Mobile Mapping Market, By Offering, 2019-2032 (USD Billion)
20. Europe Mobile Mapping Market, By Application, 2019-2032 (USD Billion)
21. Germany Mobile Mapping Market, By Offering, 2019-2032 (USD Billion)
22. Germany Mobile Mapping Market, By Application, 2019-2032 (USD Billion)
23. France Mobile Mapping Market, By Offering, 2019-2032 (USD Billion)
24. France Mobile Mapping Market, By Application, 2019-2032 (USD Billion)
25. U.K. Mobile Mapping Market, By Offering, 2019-2032 (USD Billion)
26. U.K. Mobile Mapping Market, By Application, 2019-2032 (USD Billion)
27. Italy Mobile Mapping Market, By Offering, 2019-2032 (USD Billion)
28. Italy Mobile Mapping Market, By Application, 2019-2032 (USD Billion)
29. Spain Mobile Mapping Market, By Offering, 2019-2032 (USD Billion)
30. Spain Mobile Mapping Market, By Application, 2019-2032 (USD Billion)
31. Asia Pacific Mobile Mapping Market, By Offering, 2019-2032 (USD Billion)
32. Asia Pacific Mobile Mapping Market, By Application, 2019-2032 (USD Billion)
33. Japan Mobile Mapping Market, By Offering, 2019-2032 (USD Billion)
34. Japan Mobile Mapping Market, By Application, 2019-2032 (USD Billion)
35. China Mobile Mapping Market, By Offering, 2019-2032 (USD Billion)
36. China Mobile Mapping Market, By Application, 2019-2032 (USD Billion)
37. India Mobile Mapping Market, By Offering, 2019-2032 (USD Billion)
38. India Mobile Mapping Market, By Application, 2019-2032 (USD Billion)
39. South America Mobile Mapping Market, By Offering, 2019-2032 (USD Billion)
40. South America Mobile Mapping Market, By Application, 2019-2032 (USD Billion)
41. Brazil Mobile Mapping Market, By Offering, 2019-2032 (USD Billion)
42. Brazil Mobile Mapping Market, By Application, 2019-2032 (USD Billion)
43. Middle East and Africa Mobile Mapping Market, By Offering, 2019-2032 (USD Billion)
44. Middle East and Africa Mobile Mapping Market, By Application, 2019-2032 (USD Billion)
45. UAE Mobile Mapping Market, By Offering, 2019-2032 (USD Billion)
46. UAE Mobile Mapping Market, By Application, 2019-2032 (USD Billion)
47. South Africa Mobile Mapping Market, By Offering, 2019-2032 (USD Billion)
48. South Africa Mobile Mapping Market, By Application, 2019-2032 (USD Billion)
List of Figures
1. Global Mobile Mapping Market Segmentation
2. Global Mobile Mapping Market: Research Methodology
3. Market Size Estimation Methodology: Bottom-Up Approach
4. Market Size Estimation Methodology: Top-Down Approach
5. Data Triangulation
6. Porter’s Five Forces Analysis
7. Value Chain Analysis
8. Global Mobile Mapping Market Attractiveness Analysis by Offering
9. Global Mobile Mapping Market Attractiveness Analysis by Application
10. Global Mobile Mapping Market Attractiveness Analysis by Region
11. Global Mobile Mapping Market: Dynamics
12. Global Mobile Mapping Market Share by Offering (2023 & 2032)
13. Global Mobile Mapping Market Share by Application (2023 & 2032)
14. Global Mobile Mapping Market Share by Regions (2023 & 2032)
15. Global Mobile Mapping Market Share by Company (2022)
This study forecasts global, regional, and country revenue from 2019 to 2032. The Brainy Insights has segmented the global mobile mapping market based on the below-mentioned segments:
Global Mobile Mapping Market By Offering:
Global Mobile Mapping Market By Application:
Global Mobile Mapping Market By Region:
Research has its special purpose to undertake marketing efficiently. In this competitive scenario, businesses need information across all industry verticals; the information about customer wants, market demand, competition, industry trends, distribution channels etc. This information needs to be updated regularly because businesses operate in a dynamic environment. Our organization, The Brainy Insights incorporates scientific and systematic research procedures in order to get proper market insights and industry analysis for overall business success. The analysis consists of studying the market from a miniscule level wherein we implement statistical tools which helps us in examining the data with accuracy and precision.
Our research reports feature both; quantitative and qualitative aspects for any market. Qualitative information for any market research process are fundamental because they reveal the customer needs and wants, usage and consumption for any product/service related to a specific industry. This in turn aids the marketers/investors in knowing certain perceptions of the customers. Qualitative research can enlighten about the different product concepts and designs along with unique service offering that in turn, helps define marketing problems and generate opportunities. On the other hand, quantitative research engages with the data collection process through interviews, e-mail interactions, surveys and pilot studies. Quantitative aspects for the market research are useful to validate the hypotheses generated during qualitative research method, explore empirical patterns in the data with the help of statistical tools, and finally make the market estimations.
The Brainy Insights offers comprehensive research and analysis, based on a wide assortment of factual insights gained through interviews with CXOs and global experts and secondary data from reliable sources. Our analysts and industry specialist assume vital roles in building up statistical tools and analysis models, which are used to analyse the data and arrive at accurate insights with exceedingly informative research discoveries. The data provided by our organization have proven precious to a diverse range of companies, facilitating them to address issues such as determining which products/services are the most appealing, whether or not customers use the product in the manner anticipated, the purchasing intentions of the market and many others.
Our research methodology encompasses an idyllic combination of primary and secondary initiatives. Key phases involved in this process are listed below:

The phase involves the gathering and collecting of market data and its related information with the help of different sources & research procedures.

The data procurement stage involves in data gathering and collecting through various data sources.
This stage involves in extensive research. These data sources includes:
Purchased Database: Purchased databases play a crucial role in estimating the market sizes irrespective of the domain. Our purchased database includes:
Primary Research: The Brainy Insights interacts with leading companies and experts of the concerned domain to develop the analyst team’s market understanding and expertise. It improves and substantiates every single data presented in the market reports. Primary research mainly involves in telephonic interviews, E-mail interactions and face-to-face interviews with the raw material providers, manufacturers/producers, distributors, & independent consultants. The interviews that we conduct provides valuable data on market size and industry growth trends prevailing in the market. Our organization also conducts surveys with the various industry experts in order to gain overall insights of the industry/market. For instance, in healthcare industry we conduct surveys with the pharmacists, doctors, surgeons and nurses in order to gain insights and key information of a medical product/device/equipment which the customers are going to usage. Surveys are conducted in the form of questionnaire designed by our own analyst team. Surveys plays an important role in primary research because surveys helps us to identify the key target audiences of the market. Additionally, surveys helps to identify the key target audience engaged with the market. Our survey team conducts the survey by targeting the key audience, thus gaining insights from them. Based on the perspectives of the customers, this information is utilized to formulate market strategies. Moreover, market surveys helps us to understand the current competitive situation of the industry. To be precise, our survey process typically involve with the 360 analysis of the market. This analytical process begins by identifying the prospective customers for a product or service related to the market/industry to obtain data on how a product/service could fit into customers’ lives.

Secondary Research: The secondary data sources includes information published by the on-profit organizations such as World bank, WHO, company fillings, investor presentations, annual reports, national government documents, statistical databases, blogs, articles, white papers and others. From the annual report, we analyse a company’s revenue to understand the key segment and market share of that organization in a particular region. We analyse the company websites and adopt the product mapping technique which is important for deriving the segment revenue. In the product mapping method, we select and categorize the products offered by the companies catering to domain specific market, deduce the product revenue for each of the companies so as to get overall estimation of the market size. We also source data and analyses trends based on information received from supply side and demand side intermediaries in the value chain. The supply side denotes the data gathered from supplier, distributor, wholesaler and the demand side illustrates the data gathered from the end customers for respective market domain.

The supply side for a domain specific market is analysed by:
The demand side for the market is estimated through:
In-house Library: Apart from these third-party sources, we have our in-house library of qualitative and quantitative information. Our in-house database includes market data for various industry and domains. These data are updated on regular basis as per the changing market scenario. Our library includes, historic databases, internal audit reports and archives.
Sometimes there are instances where there is no metadata or raw data available for any domain specific market. For those cases, we use our expertise to forecast and estimate the market size in order to generate comprehensive data sets. Our analyst team adopt a robust research technique in order to produce the estimates:
Data Synthesis: This stage involves the analysis & mapping of all the information obtained from the previous step. It also involves in scrutinizing the data for any discrepancy observed while data gathering related to the market. The data is collected with consideration to the heterogeneity of sources. Robust scientific techniques are in place for synthesizing disparate data sets and provide the essential contextual information that can orient market strategies. The Brainy Insights has extensive experience in data synthesis where the data passes through various stages:


Market Deduction & Formulation: The final stage comprises of assigning data points at appropriate market spaces so as to deduce feasible conclusions. Analyst perspective & subject matter expert based holistic form of market sizing coupled with industry analysis also plays a crucial role in this stage.
This stage involves in finalization of the market size and numbers that we have collected from data integration step. With data interpolation, it is made sure that there is no gap in the market data. Successful trend analysis is done by our analysts using extrapolation techniques, which provide the best possible forecasts for the market.
Data Validation & Market Feedback: Validation is the most important step in the process. Validation & re-validation via an intricately designed process helps us finalize data-points to be used for final calculations.

The Brainy Insights interacts with leading companies and experts of the concerned domain to develop the analyst team’s market understanding and expertise. It improves and substantiates every single data presented in the market reports. The data validation interview and discussion panels are typically composed of the most experienced industry members. The participants include, however, are not limited to:
Moreover, we always validate our data and findings through primary respondents from all the major regions we are working on.


Free Customization
Fortune 500 Clients
Free Yearly Update On Purchase Of Multi/Corporate License
Companies Served Till Date