- +1-315-215-1633
- sales@thebrainyinsights.com

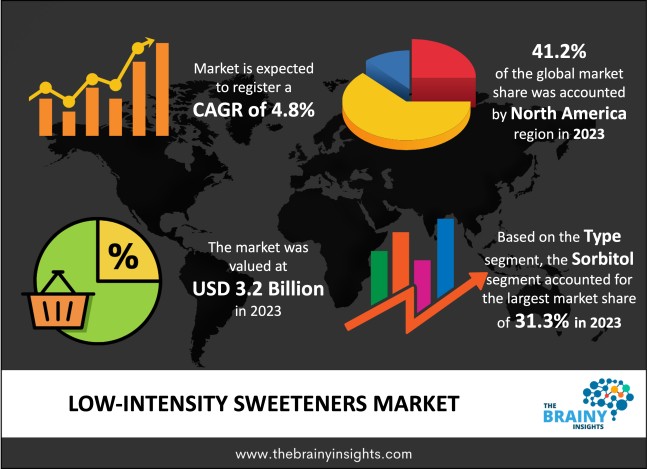
The Low-Intensity Sweeteners Market was valued at USD 3.2 billion in 2023 and grew at a CAGR of 4.8% from 2024 to 2033 The market for low-calorie and low-glycemic sweeteners is referred to as low-intensity sweeteners. These sweeteners are frequently used in food and beverage items as substitutes for conventional sugar-based sweeteners because they provide a sweet flavor without having the detrimental consequences on health that come with consuming large amounts of sugar. Low-intensity sweeteners can be chemically produced or obtained from natural sources including stevia, monk fruit, and honey.
Since low-intensity sweeteners are usually sweeter than sucrose (table sugar), less of them are needed to get the required level of sweetness. Low-intensity sweeteners that are frequently used include stevia, aspartame, saccharin, sucralose, and monk fruit extract. To provide dishes and beverages the right flavor profile, these sweeteners can be used alone, in conjunction with one another, or with regular sugars. The area of the food and beverage industry that concentrates on substitute sweeteners with fewer calories than conventional sugars is known as the low-intensity sweeteners market. Due to their ability to increase sweetness while lowering calorie intake, these sweeteners are well-liked by people who are concerned about their health as well as those who are trying to control their blood sugar or weight.
Get an overview of this study by requesting a free sample
Products with lower sugar and calorie content are in greater demand as customers grow more health-conscious. For people who want to control their blood sugar, lose weight, or cut back on sugar altogether, low-intensity sweeteners provide an option. Additionally, there is a greater awareness of the health concerns connected with excessive sugar consumption due to the growth in diabetes prevalence and obesity rates worldwide. Sweet-tasting meals and beverages can be enjoyed without the harmful health effects of traditional sugars thanks to low-intensity sweeteners.
Some customers may believe that artificial sweeteners pose health hazards and are dubious about their safety. Customers may be discouraged from buying items using low-intensity sweeteners due to worries about the long-term health impacts or negative reactions to certain sweeteners. Moreover, low-intensity sweeteners might not always mimic the flavor and texture of sugar in food and drink, even though they nevertheless impart sweetness without adding extra calories. When compared to products sweetened with conventional sugars, some consumers can notice a change in flavor or mouthfeel, which could affect their acceptance and uptake.
Goods with less sugar are in greater demand as consumers become more conscious of their health and wellbeing. In order to appeal to consumers who are concerned about their health, businesses can create healthier substitutes for conventional sugar-sweetened items by using low-intensity sweeteners. Furthermore, there's a lot of space for creativity when it comes to creating brand-new low-intensity sweeteners or enhancing the ones that already exist. Manufacturers have the opportunity to investigate innovative natural sweetening options and technological advancements that improve flavor, consistency, and texture. Products with improved flavor profiles and sensory qualities can be produced through innovative formulation procedures.
North America led the market in 2023 with the largest market share of 41.2%. North American consumers' growing concerns about their health and well-being are driving up demand for products with lower sugar content. Low-intensity sweeteners are in high demand as alternatives because of increased knowledge of the health dangers connected with excessive sugar consumption and the rising obesity rates and related health concerns in the region. Additionally, the market for low-intensity sweeteners is significantly shaped by the regulatory environment in North America. Regulatory agencies that oversee the approval, labelling, and safety of sweeteners used in food and beverage products include Health Canada and the Food and Drug Administration (FDA) in the United States. It is imperative for manufacturers operating in the North American market to adhere to regulatory regulations.
North America Region Low-Intensity Sweeteners Market Share in 2023 - 41.2%
www.thebrainyinsights.com
Check the geographical analysis of this market by requesting a free sample
The Sorbitol segment dominated the global market in 2023 with a market share of 31.3%. Hardware is a term used to describe a variety of items used in the food value chain, including voice assistants, culinary robots, self-ordering kiosks at restaurants, and delivery drones and robots. Furthermore, by keeping an eye on temperature, IoT sensors can save waste. Segment growth is being driven by the need to comply with regulations, enhance customer experience, and increase supply chain efficiency.
The beverage segment dominated the global market in 2023 with a market share of 38.7%. A growing number of customers are actively looking for healthier beverage options as they become more aware of the health dangers linked to excessive sugar consumption. Low-intensity sweeteners are a popular option for producers trying to appeal to health-conscious consumers because they offer a means to cut calories without compromising sweetness. Additionally, there has been a noticeable shift in the beverage industry toward the creation of sugar-free or low-sugar substitutes in a number of categories, such as fruit juices, carbonated soft drinks, energy drinks, sports drinks, and ready-to-drink teas and coffees. These products' major components are low-intensity sweeteners, which enable producers to make beverages with less sugar while still having a pleasing flavor.
The dry segment dominated the global market in 2023 with a market share of 58.7%. In the dry segment, low-intensity sweeteners are usually offered in granulated or powdered form. This qualifies them for use in dry food products such powdered drinks, morning cereals, baking mixes, and snack bars. In the baking and confectionery industries, low-intensity sweeteners are also widely used to lower the sugar content of goods including cakes, cookies, pastries, and candies. Erythritol, stevia, and monk fruit extract are common dry sweeteners used to make baked products and confections with low or no sugar content.
| Attribute | Description |
|---|---|
| Market Size | Revenue (USD Billion) |
| Market size value in 2023 | USD 3.2 Billion |
| Market size value in 2033 | USD 5.1 Billion |
| CAGR (2024 to 2033) | 4.8% |
| Historical data | 2020-2022 |
| Base Year | 2023 |
| Forecast | 2024-2033 |
| Region | The regions analyzed for the market are Asia Pacific, Europe, South America, North America, and Middle East & Africa. Furthermore, the regions are further analyzed at the country level. |
| Segments | Type, Application, Form |
As per The Brainy Insights, the size of the low-intensity sweeteners market was valued at USD 3.2 billion in 2023 to USD 5.1 billion by 2033.
The global low-intensity sweeteners market is growing at a CAGR of 4.8% during the forecast period 2024-2033.
The North America region emerged as the largest market for the low-intensity sweeteners.
The increasing health consciousness will influence the market's growth.
1. Introduction
1.1. Objectives of the Study
1.2. Market Definition
1.3. Research Scope
1.4. Currency
1.5. Key Target Audience
2. Research Methodology and Assumptions
3. Executive Summary
4. Premium Insights
4.1. Porter’s Five Forces Analysis
4.2. Value Chain Analysis
4.3. Top Investment Pockets
4.3.1. Market Attractiveness Analysis by Type
4.3.2. Market Attractiveness Analysis by Application
4.3.3. Market Attractiveness Analysis by Form
4.3.4. Market Attractiveness Analysis by Region
4.4. Industry Trends
5. Market Dynamics
5.1. Market Evaluation
5.2. Drivers
5.2.1. Increasing Health Consciousness
5.3. Restraints
5.3.1. Perception and Taste
5.4. Opportunities
5.4.1. Growing Demand for Functional Foods and Beverages
5.5. Challenges
5.5.1. Intense competition
6. Global Low-Intensity Sweeteners Market Analysis and Forecast, By Type
6.1. Segment Overview
6.2. D-Tagatose
6.3. Sorbitol
6.4. Maltitol
6.5. Xylitol
6.6. Mannitol
6.7. Erythritol
6.8. Allulose
7. Global Low-Intensity Sweeteners Market Analysis and Forecast, By Application
7.1. Segment Overview
7.2. Food
7.3. Beverages
7.4. Pharmaceutical
7.5. Personal Care Products
8. Global Low-Intensity Sweeteners Market Analysis and Forecast, By Form
8.1. Segment Overview
8.2. Dry
8.3. Liquid
9. Global Low-Intensity Sweeteners Market Analysis and Forecast, By Regional Analysis
9.1. Segment Overview
9.2. North America
9.2.1. U.S.
9.2.2. Canada
9.2.3. Mexico
9.3. Europe
9.3.1. Germany
9.3.2. France
9.3.3. U.K.
9.3.4. Italy
9.3.5. Spain
9.4. Asia-Pacific
9.4.1. Japan
9.4.2. China
9.4.3. India
9.5. South America
9.5.1. Brazil
9.6. Middle East and Africa
9.6.1. UAE
9.6.2. South Africa
10. Global Low-Intensity Sweeteners Market-Competitive Landscape
10.1. Overview
10.2. Market Share of Key Players in the Low-Intensity Sweeteners Market
10.2.1. Global Company Market Share
10.2.2. North America Company Market Share
10.2.3. Europe Company Market Share
10.2.4. APAC Company Market Share
10.3. Competitive Situations and Trends
10.3.1. Product Launches and Developments
10.3.2. Partnerships, Collaborations, and Agreements
10.3.3. Mergers & Acquisitions
10.3.4. Expansions
11. Company Profiles
11.1. Cargill
11.1.1. Business Overview
11.1.2. Company Snapshot
11.1.3. Company Market Share Analysis
11.1.4. Company Product Portfolio
11.1.5. Recent Developments
11.1.6. SWOT Analysis
11.2. Ingredion Incorporated
11.2.1. Business Overview
11.2.2. Company Snapshot
11.2.3. Company Market Share Analysis
11.2.4. Company Product Portfolio
11.2.5. Recent Developments
11.2.6. SWOT Analysis
11.3. Tate & Lyle PLC
11.3.1. Business Overview
11.3.2. Company Snapshot
11.3.3. Company Market Share Analysis
11.3.4. Company Product Portfolio
11.3.5. Recent Developments
11.3.6. SWOT Analysis
11.4. Archer Daniels Midland Company (ADM)
11.4.1. Business Overview
11.4.2. Company Snapshot
11.4.3. Company Market Share Analysis
11.4.4. Company Product Portfolio
11.4.5. Recent Developments
11.4.6. SWOT Analysis
11.5. PureCircle
11.5.1. Business Overview
11.5.2. Company Snapshot
11.5.3. Company Market Share Analysis
11.5.4. Company Product Portfolio
11.5.5. Recent Developments
11.5.6. SWOT Analysis
11.6. Roquette Fréres
11.6.1. Business Overview
11.6.2. Company Snapshot
11.6.3. Company Market Share Analysis
11.6.4. Company Product Portfolio
11.6.5. Recent Developments
11.6.6. SWOT Analysis
11.7. Merisant
11.7.1. Business Overview
11.7.2. Company Snapshot
11.7.3. Company Market Share Analysis
11.7.4. Company Product Portfolio
11.7.5. Recent Developments
11.7.6. SWOT Analysis
11.8. Pyure Brands LLC
11.8.1. Business Overview
11.8.2. Company Snapshot
11.8.3. Company Market Share Analysis
11.8.4. Company Product Portfolio
11.8.5. Recent Developments
11.8.6. SWOT Analysis
11.9. GLG Life Tech Corp.
11.9.1. Business Overview
11.9.2. Company Snapshot
11.9.3. Company Market Share Analysis
11.9.4. Company Product Portfolio
11.9.5. Recent Developments
11.9.6. SWOT Analysis
11.10. Monk Fruit Corp.
11.10.1. Business Overview
11.10.2. Company Snapshot
11.10.3. Company Market Share Analysis
11.10.4. Company Product Portfolio
11.10.5. Recent Developments
11.10.6. SWOT Analysis
11.11. Madhava Natural Sweeteners
11.11.1. Business Overview
11.11.2. Company Snapshot
11.11.3. Company Market Share Analysis
11.11.4. Company Product Portfolio
11.11.5. Recent Developments
11.11.6. SWOT Analysis
11.12. Stevia Corp.
11.12.1. Business Overview
11.12.2. Company Snapshot
11.12.3. Company Market Share Analysis
11.12.4. Company Product Portfolio
11.12.5. Recent Developments
11.12.6. SWOT Analysis
11.13. Sunwin Stevia International Inc.
11.13.1. Business Overview
11.13.2. Company Snapshot
11.13.3. Company Market Share Analysis
11.13.4. Company Product Portfolio
11.13.5. Recent Developments
11.13.6. SWOT Analysis
11.14. S&W Seed Company
11.14.1. Business Overview
11.14.2. Company Snapshot
11.14.3. Company Market Share Analysis
11.14.4. Company Product Portfolio
11.14.5. Recent Developments
11.14.6. SWOT Analysis
11.15. Hill Pharmaceutical Co., Ltd.
11.15.1. Business Overview
11.15.2. Company Snapshot
11.15.3. Company Market Share Analysis
11.15.4. Company Product Portfolio
11.15.5. Recent Developments
11.15.6. SWOT Analysis
List of Table
1. Global Low-Intensity Sweeteners Market, By Type, 2020-2033 (USD Billion)
2. Global D-Tagatose Low-Intensity Sweeteners Market, By Region, 2020-2033 (USD Billion)
3. Global Sorbitol Low-Intensity Sweeteners Market, By Region, 2020-2033 (USD Billion)
4. Global Maltitol Low-Intensity Sweeteners Market, By Region, 2020-2033 (USD Billion)
5. Global Xylitol Low-Intensity Sweeteners Market, By Region, 2020-2033 (USD Billion)
6. Global Mannitol Low-Intensity Sweeteners Market, By Region, 2020-2033 (USD Billion)
7. Global Erythritol Low-Intensity Sweeteners Market, By Region, 2020-2033 (USD Billion)
8. Global Allulose Low-Intensity Sweeteners Market, By Region, 2020-2033 (USD Billion)
9. Global Low-Intensity Sweeteners Market, By Application, 2020-2033 (USD Billion)
10. Global Food Low-Intensity Sweeteners Market, By Region, 2020-2033 (USD Billion)
11. Global Beverages Low-Intensity Sweeteners Market, By Region, 2020-2033 (USD Billion)
12. Global Pharmaceutical Low-Intensity Sweeteners Market, By Region, 2020-2033 (USD Billion)
13. Global Personal Care Products Low-Intensity Sweeteners Market, By Region, 2020-2033 (USD Billion)
14. Global Low-Intensity Sweeteners Market, By Form, 2020-2033 (USD Billion)
15. Global Dry Low-Intensity Sweeteners Market, By Region, 2020-2033 (USD Billion)
16. Global Liquid Low-Intensity Sweeteners Market, By Region, 2020-2033 (USD Billion)
17. Global Low-Intensity Sweeteners Market, By Region, 2020-2033 (USD Billion)
18. North America Low-Intensity Sweeteners Market, By Type, 2020-2033 (USD Billion)
19. North America Low-Intensity Sweeteners Market, By Application, 2020-2033 (USD Billion)
20. North America Low-Intensity Sweeteners Market, By Form, 2020-2033 (USD Billion)
21. U.S. Low-Intensity Sweeteners Market, By Type, 2020-2033 (USD Billion)
22. U.S. Low-Intensity Sweeteners Market, By Application, 2020-2033 (USD Billion)
23. U.S. Low-Intensity Sweeteners Market, By Form, 2020-2033 (USD Billion)
24. Canada Low-Intensity Sweeteners Market, By Type, 2020-2033 (USD Billion)
25. Canada Low-Intensity Sweeteners Market, By Application, 2020-2033 (USD Billion)
26. Canada Low-Intensity Sweeteners Market, By Form, 2020-2033 (USD Billion)
27. Mexico Low-Intensity Sweeteners Market, By Type, 2020-2033 (USD Billion)
28. Mexico Low-Intensity Sweeteners Market, By Application, 2020-2033 (USD Billion)
29. Mexico Low-Intensity Sweeteners Market, By Form, 2020-2033 (USD Billion)
30. Europe Low-Intensity Sweeteners Market, By Type, 2020-2033 (USD Billion)
31. Europe Low-Intensity Sweeteners Market, By Application, 2020-2033 (USD Billion)
32. Europe Low-Intensity Sweeteners Market, By Form, 2020-2033 (USD Billion)
33. Germany Low-Intensity Sweeteners Market, By Type, 2020-2033 (USD Billion)
34. Germany Low-Intensity Sweeteners Market, By Application, 2020-2033 (USD Billion)
35. Germany Low-Intensity Sweeteners Market, By Form, 2020-2033 (USD Billion)
36. France Low-Intensity Sweeteners Market, By Type, 2020-2033 (USD Billion)
37. France Low-Intensity Sweeteners Market, By Application, 2020-2033 (USD Billion)
38. France Low-Intensity Sweeteners Market, By Form, 2020-2033 (USD Billion)
39. U.K. Low-Intensity Sweeteners Market, By Type, 2020-2033 (USD Billion)
40. U.K. Low-Intensity Sweeteners Market, By Application, 2020-2033 (USD Billion)
41. U.K. Low-Intensity Sweeteners Market, By Form, 2020-2033 (USD Billion)
42. Italy Low-Intensity Sweeteners Market, By Type, 2020-2033 (USD Billion)
43. Italy Low-Intensity Sweeteners Market, By Application, 2020-2033 (USD Billion)
44. Italy Low-Intensity Sweeteners Market, By Form, 2020-2033 (USD Billion)
45. Spain Low-Intensity Sweeteners Market, By Type, 2020-2033 (USD Billion)
46. Spain Low-Intensity Sweeteners Market, By Application, 2020-2033 (USD Billion)
47. Spain Low-Intensity Sweeteners Market, By Form, 2020-2033 (USD Billion)
48. Asia Pacific Low-Intensity Sweeteners Market, By Type, 2020-2033 (USD Billion)
49. Asia Pacific Low-Intensity Sweeteners Market, By Application, 2020-2033 (USD Billion)
50. Asia Pacific Low-Intensity Sweeteners Market, By Form, 2020-2033 (USD Billion)
51. Japan Low-Intensity Sweeteners Market, By Type, 2020-2033 (USD Billion)
52. Japan Low-Intensity Sweeteners Market, By Application, 2020-2033 (USD Billion)
53. Japan Low-Intensity Sweeteners Market, By Form, 2020-2033 (USD Billion)
54. China Low-Intensity Sweeteners Market, By Type, 2020-2033 (USD Billion)
55. China Low-Intensity Sweeteners Market, By Application, 2020-2033 (USD Billion)
56. China Low-Intensity Sweeteners Market, By Form, 2020-2033 (USD Billion)
57. India Low-Intensity Sweeteners Market, By Type, 2020-2033 (USD Billion)
58. India Low-Intensity Sweeteners Market, By Application, 2020-2033 (USD Billion)
59. India Low-Intensity Sweeteners Market, By Form, 2020-2033 (USD Billion)
60. South America Low-Intensity Sweeteners Market, By Type, 2020-2033 (USD Billion)
61. South America Low-Intensity Sweeteners Market, By Application, 2020-2033 (USD Billion)
62. South America Low-Intensity Sweeteners Market, By Form, 2020-2033 (USD Billion)
63. Brazil Low-Intensity Sweeteners Market, By Type, 2020-2033 (USD Billion)
64. Brazil Low-Intensity Sweeteners Market, By Application, 2020-2033 (USD Billion)
65. Brazil Low-Intensity Sweeteners Market, By Form, 2020-2033 (USD Billion)
66. Middle East and Africa Low-Intensity Sweeteners Market, By Type, 2020-2033 (USD Billion)
67. Middle East and Africa Low-Intensity Sweeteners Market, By Application, 2020-2033 (USD Billion)
68. Middle East and Africa Low-Intensity Sweeteners Market, By Form, 2020-2033 (USD Billion)
69. UAE Low-Intensity Sweeteners Market, By Type, 2020-2033 (USD Billion)
70. UAE Low-Intensity Sweeteners Market, By Application, 2020-2033 (USD Billion)
71. UAE Low-Intensity Sweeteners Market, By Form, 2020-2033 (USD Billion)
72. South Africa Low-Intensity Sweeteners Market, By Type, 2020-2033 (USD Billion)
73. South Africa Low-Intensity Sweeteners Market, By Application, 2020-2033 (USD Billion)
74. South Africa Low-Intensity Sweeteners Market, By Form, 2020-2033 (USD Billion)
List of Figures
1. Global Low-Intensity Sweeteners Market Segmentation
2. Low-Intensity Sweeteners Market: Research Methodology
3. Market Size Estimation Methodology: Bottom-Up Approach
4. Market Size Estimation Methodology: Top-Down Approach
5. Data Triangulation
6. Porter’s Five Forces Analysis
7. Value Chain Analysis
8. Global Low-Intensity Sweeteners Market Attractiveness Analysis by Type
9. Global Low-Intensity Sweeteners Market Attractiveness Analysis by Application
10. Global Low-Intensity Sweeteners Market Attractiveness Analysis by Form
11. Global Low-Intensity Sweeteners Market Attractiveness Analysis by Region
12. Global Low-Intensity Sweeteners Market: Dynamics
13. Global Low-Intensity Sweeteners Market Share by Type (2023 & 2033)
14. Global Low-Intensity Sweeteners Market Share by Application (2023 & 2033)
15. Global Low-Intensity Sweeteners Market Share by Form (2023 & 2033)
16. Global Low-Intensity Sweeteners Market Share by Regions (2023 & 2033)
17. Global Low-Intensity Sweeteners Market Share by Company (2023)
This study forecasts revenue at global, regional, and country levels from 2020 to 2033. The Brainy Insights has segmented the global low-intensity sweeteners market based on below-mentioned segments:
Global Low-Intensity Sweeteners Market by Type:
Global Low-Intensity Sweeteners Market by Application:
Global Low-Intensity Sweeteners Market by Form:
Global Low-Intensity Sweeteners Market by Region:
Research has its special purpose to undertake marketing efficiently. In this competitive scenario, businesses need information across all industry verticals; the information about customer wants, market demand, competition, industry trends, distribution channels etc. This information needs to be updated regularly because businesses operate in a dynamic environment. Our organization, The Brainy Insights incorporates scientific and systematic research procedures in order to get proper market insights and industry analysis for overall business success. The analysis consists of studying the market from a miniscule level wherein we implement statistical tools which helps us in examining the data with accuracy and precision.
Our research reports feature both; quantitative and qualitative aspects for any market. Qualitative information for any market research process are fundamental because they reveal the customer needs and wants, usage and consumption for any product/service related to a specific industry. This in turn aids the marketers/investors in knowing certain perceptions of the customers. Qualitative research can enlighten about the different product concepts and designs along with unique service offering that in turn, helps define marketing problems and generate opportunities. On the other hand, quantitative research engages with the data collection process through interviews, e-mail interactions, surveys and pilot studies. Quantitative aspects for the market research are useful to validate the hypotheses generated during qualitative research method, explore empirical patterns in the data with the help of statistical tools, and finally make the market estimations.
The Brainy Insights offers comprehensive research and analysis, based on a wide assortment of factual insights gained through interviews with CXOs and global experts and secondary data from reliable sources. Our analysts and industry specialist assume vital roles in building up statistical tools and analysis models, which are used to analyse the data and arrive at accurate insights with exceedingly informative research discoveries. The data provided by our organization have proven precious to a diverse range of companies, facilitating them to address issues such as determining which products/services are the most appealing, whether or not customers use the product in the manner anticipated, the purchasing intentions of the market and many others.
Our research methodology encompasses an idyllic combination of primary and secondary initiatives. Key phases involved in this process are listed below:

The phase involves the gathering and collecting of market data and its related information with the help of different sources & research procedures.

The data procurement stage involves in data gathering and collecting through various data sources.
This stage involves in extensive research. These data sources includes:
Purchased Database: Purchased databases play a crucial role in estimating the market sizes irrespective of the domain. Our purchased database includes:
Primary Research: The Brainy Insights interacts with leading companies and experts of the concerned domain to develop the analyst team’s market understanding and expertise. It improves and substantiates every single data presented in the market reports. Primary research mainly involves in telephonic interviews, E-mail interactions and face-to-face interviews with the raw material providers, manufacturers/producers, distributors, & independent consultants. The interviews that we conduct provides valuable data on market size and industry growth trends prevailing in the market. Our organization also conducts surveys with the various industry experts in order to gain overall insights of the industry/market. For instance, in healthcare industry we conduct surveys with the pharmacists, doctors, surgeons and nurses in order to gain insights and key information of a medical product/device/equipment which the customers are going to usage. Surveys are conducted in the form of questionnaire designed by our own analyst team. Surveys plays an important role in primary research because surveys helps us to identify the key target audiences of the market. Additionally, surveys helps to identify the key target audience engaged with the market. Our survey team conducts the survey by targeting the key audience, thus gaining insights from them. Based on the perspectives of the customers, this information is utilized to formulate market strategies. Moreover, market surveys helps us to understand the current competitive situation of the industry. To be precise, our survey process typically involve with the 360 analysis of the market. This analytical process begins by identifying the prospective customers for a product or service related to the market/industry to obtain data on how a product/service could fit into customers’ lives.

Secondary Research: The secondary data sources includes information published by the on-profit organizations such as World bank, WHO, company fillings, investor presentations, annual reports, national government documents, statistical databases, blogs, articles, white papers and others. From the annual report, we analyse a company’s revenue to understand the key segment and market share of that organization in a particular region. We analyse the company websites and adopt the product mapping technique which is important for deriving the segment revenue. In the product mapping method, we select and categorize the products offered by the companies catering to domain specific market, deduce the product revenue for each of the companies so as to get overall estimation of the market size. We also source data and analyses trends based on information received from supply side and demand side intermediaries in the value chain. The supply side denotes the data gathered from supplier, distributor, wholesaler and the demand side illustrates the data gathered from the end customers for respective market domain.

The supply side for a domain specific market is analysed by:
The demand side for the market is estimated through:
In-house Library: Apart from these third-party sources, we have our in-house library of qualitative and quantitative information. Our in-house database includes market data for various industry and domains. These data are updated on regular basis as per the changing market scenario. Our library includes, historic databases, internal audit reports and archives.
Sometimes there are instances where there is no metadata or raw data available for any domain specific market. For those cases, we use our expertise to forecast and estimate the market size in order to generate comprehensive data sets. Our analyst team adopt a robust research technique in order to produce the estimates:
Data Synthesis: This stage involves the analysis & mapping of all the information obtained from the previous step. It also involves in scrutinizing the data for any discrepancy observed while data gathering related to the market. The data is collected with consideration to the heterogeneity of sources. Robust scientific techniques are in place for synthesizing disparate data sets and provide the essential contextual information that can orient market strategies. The Brainy Insights has extensive experience in data synthesis where the data passes through various stages:


Market Deduction & Formulation: The final stage comprises of assigning data points at appropriate market spaces so as to deduce feasible conclusions. Analyst perspective & subject matter expert based holistic form of market sizing coupled with industry analysis also plays a crucial role in this stage.
This stage involves in finalization of the market size and numbers that we have collected from data integration step. With data interpolation, it is made sure that there is no gap in the market data. Successful trend analysis is done by our analysts using extrapolation techniques, which provide the best possible forecasts for the market.
Data Validation & Market Feedback: Validation is the most important step in the process. Validation & re-validation via an intricately designed process helps us finalize data-points to be used for final calculations.

The Brainy Insights interacts with leading companies and experts of the concerned domain to develop the analyst team’s market understanding and expertise. It improves and substantiates every single data presented in the market reports. The data validation interview and discussion panels are typically composed of the most experienced industry members. The participants include, however, are not limited to:
Moreover, we always validate our data and findings through primary respondents from all the major regions we are working on.


Free Customization
Fortune 500 Clients
Free Yearly Update On Purchase Of Multi/Corporate License
Companies Served Till Date