- +1-315-215-1633
- sales@thebrainyinsights.com

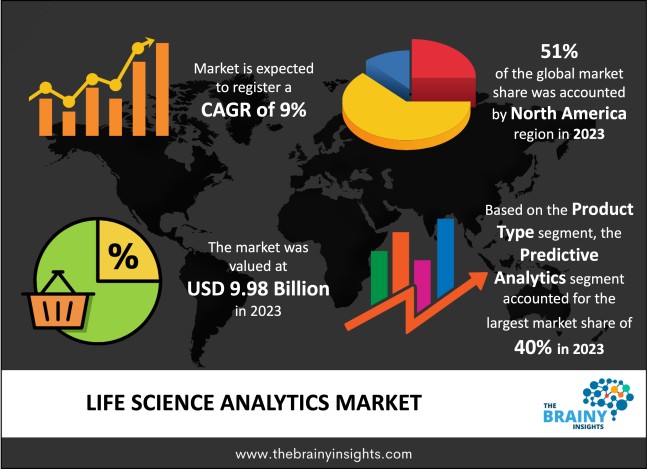
The global life science analytics market was valued at USD 9.98 billion in 2023, growing at a CAGR of 9% from 2024 to 2033. The market is expected to reach USD 23.61 billion by 2033. Analytics has developed as a useful tool for various pharmaceutical, biotechnological, and medical device companies, as these alternatives help overcome data integration issues and improve operational efficiency. As technology develops, the health care industry is also developing itself by adopting such technologies. These technologies enable the industry to deliver value-based care and efficient and cost-effective outcomes. Also, rising collaborations and partnerships among healthcare providers and analytics service providers will help both to innovate and increase areas of application in life science.
Life science analytics is the systematic computational analysis of biological data to generate insights about live organisms. It entails descriptive, predictive, and prescriptive analytics that use artificial intelligence (AI), big data, machine learning (ML) solutions, and modern gadgets. These technologies aid clinical research, medical trials, disease diagnosis, drug discovery and development, sales and marketing, supply chain management, and pharmacovigilance. Life science analytics can also help with pathology detection and the creation of viable treatment options. Significant expansion in the life science industry, combined with an increasing demand for analytical insights for clinical trials, is one of the primary reasons driving the market's favourable outlook. Furthermore, the increased implementation of life science analytics solutions for data standardization in managing chronic diseases propels market expansion. Other growth-inducing elements include technology improvements such as the creation of new telemedicine, mhealth, and e-prescribing systems. These analytics solutions are also frequently employed in developing precision and personalized medications, which use specific genomic data from patients with specific medical needs. Other factors, such as improvements in existing healthcare infrastructure and intensive research and development (R&D), are expected to propel the market even more. By using life science analytics, healthcare providers can plan treatment according to patient requirements. They can also predict the outcomes of that treatment and change it according to the outcomes, which benefits the patient. It also helps in risk management, which helps the manufacturing companies assess the risks related to product recalls, clinical trials, and unavoidable events to ensure patient safety and increase product reliability.
Get an overview of this study by requesting a free sample
In July 2022, Charles River Associates debuted their new data analytics package, the Healthcare Claims Analytics Platform (HCAP), during the World Orphan Drug Congress USA 2022 in Boston. HCAP harnesses the power of machine learning and patient analytics to provide market insight and help informed decision-making.
In March 2022, Databricks unveiled the Databricks Lakehouse for Healthcare and Life Sciences. It is a unified platform for data management, analytics, and sophisticated artificial intelligence use cases such as disease prediction, medical image classification, and biomarker discovery.
Rising Mergers- Mergers, acquisitions, and partnership tactics are used by market participants to expand their corporate presence and product ranges. Accenture, for example, has agreed to buy AppsPro, an Oracle Cloud implementation service provider based in Saudi Arabia, in 2020. Through this transaction, Accenture will strengthen its footprint and develop its capabilities in the Middle East markets. As a result, this aspect increases market growth.
Privacy Issues- Life science analytics are in high demand, yet there is still a significant problem with data invasion. Data scientists assist businesses in making data-driven decisions. However, the data used in the process may infringe on customers' privacy. Client data is available to the parent company, frequently leading to data leaks. As a result, this is a significant market impediment.
Increase Prevalence of Chronic Illness- Approximately one in every three worldwide suffers from several chronic illnesses. Six in ten persons in the United States have a chronic disease, and four in ten have two or more. According to the National Health Council, more than 157 million Americans will suffer from chronic diseases by 2020. The growing burden of chronic diseases increases the workloads of the FDA and other corporations involved in drug approval to sustain market growth. These processes necessitate the extensive use of advanced analytics. As a result, this aspect increases market growth.
The regions analyzed for the market include North America, Europe, South America, Asia Pacific, the Middle East, and Africa. North America emerged as the largest global life science analytics market, with a 51% market revenue share in 2023.
Because the region is well-established in healthcare R&D, North America represents a substantial proportion of the life science analytics market. In addition, the government's increased healthcare spending and the growing importance of life science analytics in drug development are driving market expansion in the region. Analytics is required to track such trials and manage the data collected by the companies, which aids in understanding the components required for new medication discovery or drug development. For example, in March 2022, the SDG Group announced a collaboration with Snowflake as the company unveiled the Healthcare and Life Sciences Data Cloud to improve patient care and business outcomes.
R&D and regulatory changes pose challenges to the life sciences and pharmaceutical businesses. The Affordable Care Act (ACA) is transforming the regulatory environment in the United States, boosting inspection and reimbursement based on health results. To address these problems, most businesses in the United States deploy analytics independently or rely on third-party analytics firms for assistance.
North America Region Life Science Analytics Market Share in 2023 - 51%
www.thebrainyinsights.com
Check the geographical analysis of this market by requesting a free sample
The product type segment is divided into descriptive analytics, predictive analytics, and prescriptive analytics. The predictive analytics segment dominated the market, with a market share of around 40% in 2023, because of the fast-increasing acceptance rate of advanced analytical solutions in predicting future trends and assisting stakeholders in developing appropriate plans and tactics to improve market performance. For example, in March 2021, Cleveland Clinic signed a 10-year partnership agreement with IBM to launch the Discovery Accelerator initiative, focusing on healthcare and life sciences discoveries using artificial intelligence, big data analytics, quantum computing, and cloud computing.
The application segment is divided into research and development, supply chain analytics, sales and marketing, and others. The sales and marketing segment dominated the market, with a market share of around 39% in 2023, because of the increasing acceptance of analytical solutions in organizations' sales and marketing functions to enhance sales productivity and build successful and impactful marketing campaigns. For example, in February 2021, Nemours Children's Health System obtained analytical support from Oracle to embrace cloud business apps for deployment throughout the organization's business departments.
The end-user segment is divided into clinical research institutions, pharmaceutical and biotechnology companies, medical device companies, and others. The pharmaceutical and biotechnology companies segment dominated the market, with a market share of around 42% in 2023. Analytics in clinical research assists pharmaceutical companies in analyzing data to compare current studies at various sites and demographics, preparing reports for submission to regulatory authorities, and obtaining clearances. Pharmaceutical companies' roles are to invest in new compound research and development, commit to bringing new drugs to market to improve patients' health and quality of life, maintain strict governance when conducting clinical trials, and conduct product development activities for patients and healthcare professionals while adhering to ethical and legal principles.
| Attribute | Description |
|---|---|
| Market Size | Revenue (USD Billion) |
| Market size value in 2023 | USD 9.98 Billion |
| Market size value in 2033 | USD 23.61 Billion |
| CAGR (2024 to 2033) | 9% |
| Historical data | 2020-2022 |
| Base Year | 2023 |
| Forecast | 2024-2033 |
| Region | The regions analyzed for the market are Asia Pacific, Europe, South America, North America, and Middle East & Africa. Furthermore, the regions are further analyzed at the country level. |
| Segments | Product Type, Application, End-User |
As per The Brainy Insights, the size of the life science analytics market was valued at USD 9.98 billion in 2023 to USD 23.61 billion by 2033.
The global life science analytics market is growing at a CAGR of 9% during the forecast period 2024-2033.
North America emerged as the largest life science analytics market.
Key players in the life science analytics market are Oracle, IQVIA, SAS Institute Inc., Cognizant, IBM, Accenture, Take Solutions Limited, and Wipro Limited.
1. Introduction
1.1. Objectives of the Study
1.2. Market Definition
1.3. Research Scope
1.4. Currency
1.5. Key Target Audience
2. Research Methodology and Assumptions
3. Executive Summary
4. Premium Insights
4.1. Porter’s Five Forces Analysis
4.2. Value Chain Analysis
4.3. Top Investment Pockets
4.3.1. Market Attractiveness Analysis by Product Type
4.3.2. Market Attractiveness Analysis by Application
4.3.3. Market Attractiveness Analysis by End-User
4.3.4. Market Attractiveness Analysis by Region
4.4. Industry Trends
5. Market Dynamics
5.1. Market Evaluation
5.2. Drivers
5.2.1. Rising mergers
5.3. Restraints
5.3.1. Privacy issues
5.4. Opportunities
5.4.1. Increase prevalence of chronic illness
5.5. Challenges
5.5.1. High cost
6. Global Life Science Analytics Market Analysis and Forecast, By Product Type
6.1. Segment Overview
6.2. Descriptive Analytics
6.3. Predictive Analytics
6.4. Prescriptive Analytics
7. Global Life Science Analytics Market Analysis and Forecast, By Application
7.1. Segment Overview
7.2. Research and Development
7.3. Supply Chain Analytics
7.4. Sales and Marketing
7.5. Others
8. Global Life Science Analytics Market Analysis and Forecast, By End-User
8.1. Segment Overview
8.2. Clinical Research Institutions
8.3. Pharmaceutical and Biotechnology Companies
8.4. Medical Device Companies
8.5. Others
9. Global Life Science Analytics Market Analysis and Forecast, By Regional Analysis
9.1. Segment Overview
9.2. North America
9.2.1. U.S.
9.2.2. Canada
9.2.3. Mexico
9.3. Europe
9.3.1. Germany
9.3.2. France
9.3.3. U.K.
9.3.4. Italy
9.3.5. Spain
9.4. Asia-Pacific
9.4.1. Japan
9.4.2. China
9.4.3. India
9.5. South America
9.5.1. Brazil
9.6. Middle East and Africa
9.6.1. UAE
9.6.2. South Africa
10. Global Life Science Analytics Market-Competitive Landscape
10.1. Overview
10.2. Market Share of Key Players in Global Life Science Analytics Market
10.2.1. Global Company Market Share
10.2.2. North America Company Market Share
10.2.3. Europe Company Market Share
10.2.4. APAC Company Market Share
10.3. Competitive Situations and Trends
10.3.1. Product Launches and Developments
10.3.2. Partnerships, Collaborations, and Agreements
10.3.3. Mergers & Acquisitions
10.3.4. Expansions
11. Company Profiles
11.1. Oracle
11.1.1. Business Overview
11.1.2. Company Snapshot
11.1.3. Company Market Share Analysis
11.1.4. Company Product Portfolio
11.1.5. Recent Developments
11.1.6. SWOT Analysis
11.2. IQVIA
11.2.1. Business Overview
11.2.2. Company Snapshot
11.2.3. Company Market Share Analysis
11.2.4. Company Product Portfolio
11.2.5. Recent Developments
11.2.6. SWOT Analysis
11.3. SAS Institute Inc.
11.3.1. Business Overview
11.3.2. Company Snapshot
11.3.3. Company Market Share Analysis
11.3.4. Company Product Portfolio
11.3.5. Recent Developments
11.3.6. SWOT Analysis
11.4. Cognizant
11.4.1. Business Overview
11.4.2. Company Snapshot
11.4.3. Company Market Share Analysis
11.4.4. Company Product Portfolio
11.4.5. Recent Developments
11.4.6. SWOT Analysis
11.5. IBM
11.5.1. Business Overview
11.5.2. Company Snapshot
11.5.3. Company Market Share Analysis
11.5.4. Company Product Portfolio
11.5.5. Recent Developments
11.5.6. SWOT Analysis
11.6. Accenture
11.6.1. Business Overview
11.6.2. Company Snapshot
11.6.3. Company Market Share Analysis
11.6.4. Company Product Portfolio
11.6.5. Recent Developments
11.6.6. SWOT Analysis
11.7. Take Solutions Limited
11.7.1. Business Overview
11.7.2. Company Snapshot
11.7.3. Company Market Share Analysis
11.7.4. Company Product Portfolio
11.7.5. Recent Developments
11.7.6. SWOT Analysis
11.8. Wipro Limited
11.8.1. Business Overview
11.8.2. Company Snapshot
11.8.3. Company Market Share Analysis
11.8.4. Company Product Portfolio
11.8.5. Recent Developments
11.8.6. SWOT Analysis
List of Table
1. Global Life Science Analytics Market, By Product Type, 2020-2033 (USD Billion)
2. Global Descriptive Analytics, Life Science Analytics Market, By Region, 2020-2033 (USD Billion)
3. Global Predictive Analytics, Life Science Analytics Market, By Region, 2020-2033 (USD Billion)
4. Global Prescriptive Analytics, Life Science Analytics Market, By Region, 2020-2033 (USD Billion)
5. Global Life Science Analytics Market, By Application, 2020-2033 (USD Billion)
6. Global Research and Development, Life Science Analytics Market, By Region, 2020-2033 (USD Billion)
7. Global Supply Chain Analytics, Life Science Analytics Market, By Region, 2020-2033 (USD Billion)
8. Global Sales and Marketing, Life Science Analytics Market, By Region, 2020-2033 (USD Billion)
9. Global Others, Life Science Analytics Market, By Region, 2020-2033 (USD Billion)
10. Global Life Science Analytics Market, By End-User, 2020-2033 (USD Billion)
11. Global Clinical Research Institutions, Life Science Analytics Market, By Region, 2020-2033 (USD Billion)
12. Global Pharmaceutical and Biotechnology Companies, Life Science Analytics Market, By Region, 2020-2033 (USD Billion)
13. Global Medical Device Companies, Life Science Analytics Market, By Region, 2020-2033 (USD Billion)
14. Global Others, Life Science Analytics Market, By Region, 2020-2033 (USD Billion)
15. North America Life Science Analytics Market, By Product Type, 2020-2033 (USD Billion)
16. North America Life Science Analytics Market, By Application, 2020-2033 (USD Billion)
17. North America Life Science Analytics Market, By End-User, 2020-2033 (USD Billion)
18. U.S. Life Science Analytics Market, By Product Type, 2020-2033 (USD Billion)
19. U.S. Life Science Analytics Market, By Application, 2020-2033 (USD Billion)
20. U.S. Life Science Analytics Market, By End-User, 2020-2033 (USD Billion)
21. Canada Life Science Analytics Market, By Product Type, 2020-2033 (USD Billion)
22. Canada Life Science Analytics Market, By Application, 2020-2033 (USD Billion)
23. Canada Life Science Analytics Market, By End-User, 2020-2033 (USD Billion)
24. Mexico Life Science Analytics Market, By Product Type, 2020-2033 (USD Billion)
25. Mexico Life Science Analytics Market, By Application, 2020-2033 (USD Billion)
26. Mexico Life Science Analytics Market, By End-User, 2020-2033 (USD Billion)
27. Europe Life Science Analytics Market, By Product Type, 2020-2033 (USD Billion)
28. Europe Life Science Analytics Market, By Application, 2020-2033 (USD Billion)
29. Europe Life Science Analytics Market, By End-User, 2020-2033 (USD Billion)
30. Germany Life Science Analytics Market, By Product Type, 2020-2033 (USD Billion)
31. Germany Life Science Analytics Market, By Application, 2020-2033 (USD Billion)
32. Germany Life Science Analytics Market, By End-User, 2020-2033 (USD Billion)
33. France Life Science Analytics Market, By Product Type, 2020-2033 (USD Billion)
34. France Life Science Analytics Market, By Application, 2020-2033 (USD Billion)
35. France Life Science Analytics Market, By End-User, 2020-2033 (USD Billion)
36. U.K. Life Science Analytics Market, By Product Type, 2020-2033 (USD Billion)
37. U.K. Life Science Analytics Market, By Application, 2020-2033 (USD Billion)
38. U.K. Life Science Analytics Market, By End-User, 2020-2033 (USD Billion)
39. Italy Life Science Analytics Market, By Product Type, 2020-2033 (USD Billion)
40. Italy Life Science Analytics Market, By Application, 2020-2033 (USD Billion)
41. Italy Life Science Analytics Market, By End-User, 2020-2033 (USD Billion)
42. Spain Life Science Analytics Market, By Product Type, 2020-2033 (USD Billion)
43. Spain Life Science Analytics Market, By Application, 2020-2033 (USD Billion)
44. Spain Life Science Analytics Market, By End-User, 2020-2033 (USD Billion)
45. Asia Pacific Life Science Analytics Market, By Product Type, 2020-2033 (USD Billion)
46. Asia Pacific Life Science Analytics Market, By Application, 2020-2033 (USD Billion)
47. Asia Pacific Life Science Analytics Market, By End-User, 2020-2033 (USD Billion)
48. Japan Life Science Analytics Market, By Product Type, 2020-2033 (USD Billion)
49. Japan Life Science Analytics Market, By Application, 2020-2033 (USD Billion)
50. Japan Life Science Analytics Market, By End-User, 2020-2033 (USD Billion)
51. China Life Science Analytics Market, By Product Type, 2020-2033 (USD Billion)
52. China Life Science Analytics Market, By Application, 2020-2033 (USD Billion)
53. China Life Science Analytics Market, By End-User, 2020-2033 (USD Billion)
54. India Life Science Analytics Market, By Product Type, 2020-2033 (USD Billion)
55. India Life Science Analytics Market, By Application, 2020-2033 (USD Billion)
56. India Life Science Analytics Market, By End-User, 2020-2033 (USD Billion)
57. South America Life Science Analytics Market, By Product Type, 2020-2033 (USD Billion)
58. South America Life Science Analytics Market, By Application, 2020-2033 (USD Billion)
59. South America Life Science Analytics Market, By End-User, 2020-2033 (USD Billion)
60. Brazil Life Science Analytics Market, By Product Type, 2020-2033 (USD Billion)
61. Brazil Life Science Analytics Market, By Application, 2020-2033 (USD Billion)
62. Brazil Life Science Analytics Market, By End-User, 2020-2033 (USD Billion)
63. Middle East and Africa Life Science Analytics Market, By Product Type, 2020-2033 (USD Billion)
64. Middle East and Africa Life Science Analytics Market, By Application, 2020-2033 (USD Billion)
65. Middle East and Africa Life Science Analytics Market, By End-User, 2020-2033 (USD Billion)
66. UAE Life Science Analytics Market, By Product Type, 2020-2033 (USD Billion)
67. UAE Life Science Analytics Market, By Application, 2020-2033 (USD Billion)
68. UAE Life Science Analytics Market, By End-User, 2020-2033 (USD Billion)
69. South Africa Life Science Analytics Market, By Product Type, 2020-2033 (USD Billion)
70. South Africa Life Science Analytics Market, By Application, 2020-2033 (USD Billion)
71. South Africa Life Science Analytics Market, By End-User, 2020-2033 (USD Billion)
List of Figures
1. Global Life Science Analytics Market Segmentation
2. Global Life Science Analytics Market: Research Methodology
3. Market Size Estimation Methodology: Bottom-Up Approach
4. Market Size Estimation Methodology: Top-Down Approach
5. Data Triangulation
6. Porter’s Five Forces Analysis
7. Value Chain Analysis
8. Global Life Science Analytics Market Attractiveness Analysis by Product Type
9. Global Life Science Analytics Market Attractiveness Analysis by Application
10. Global Life Science Analytics Market Attractiveness Analysis by End-User
11. Global Life Science Analytics Market Attractiveness Analysis by Region
12. Global Life Science Analytics Market: Dynamics
13. Global Life Science Analytics Market Share by Product Type (2023 & 2033)
14. Global Life Science Analytics Market Share by Application (2023 & 2033)
15. Global Life Science Analytics Market Share by End-User (2023 & 2033)
16. Global Life Science Analytics Market Share by Regions (2023 & 2033)
17. Global Life Science Analytics Market Share by Company (2023)
This study forecasts global, regional, and country revenue from 2019 to 2032. The Brainy Insights has segmented the global life science analytics market based on the below-mentioned segments:
Global Life Science Analytics Market By Product Type:
Global Life Science Analytics Market By Application:
Global Life Science Analytics Market By End-User:
Global Life Science Analytics Market By Region:
Research has its special purpose to undertake marketing efficiently. In this competitive scenario, businesses need information across all industry verticals; the information about customer wants, market demand, competition, industry trends, distribution channels etc. This information needs to be updated regularly because businesses operate in a dynamic environment. Our organization, The Brainy Insights incorporates scientific and systematic research procedures in order to get proper market insights and industry analysis for overall business success. The analysis consists of studying the market from a miniscule level wherein we implement statistical tools which helps us in examining the data with accuracy and precision.
Our research reports feature both; quantitative and qualitative aspects for any market. Qualitative information for any market research process are fundamental because they reveal the customer needs and wants, usage and consumption for any product/service related to a specific industry. This in turn aids the marketers/investors in knowing certain perceptions of the customers. Qualitative research can enlighten about the different product concepts and designs along with unique service offering that in turn, helps define marketing problems and generate opportunities. On the other hand, quantitative research engages with the data collection process through interviews, e-mail interactions, surveys and pilot studies. Quantitative aspects for the market research are useful to validate the hypotheses generated during qualitative research method, explore empirical patterns in the data with the help of statistical tools, and finally make the market estimations.
The Brainy Insights offers comprehensive research and analysis, based on a wide assortment of factual insights gained through interviews with CXOs and global experts and secondary data from reliable sources. Our analysts and industry specialist assume vital roles in building up statistical tools and analysis models, which are used to analyse the data and arrive at accurate insights with exceedingly informative research discoveries. The data provided by our organization have proven precious to a diverse range of companies, facilitating them to address issues such as determining which products/services are the most appealing, whether or not customers use the product in the manner anticipated, the purchasing intentions of the market and many others.
Our research methodology encompasses an idyllic combination of primary and secondary initiatives. Key phases involved in this process are listed below:

The phase involves the gathering and collecting of market data and its related information with the help of different sources & research procedures.

The data procurement stage involves in data gathering and collecting through various data sources.
This stage involves in extensive research. These data sources includes:
Purchased Database: Purchased databases play a crucial role in estimating the market sizes irrespective of the domain. Our purchased database includes:
Primary Research: The Brainy Insights interacts with leading companies and experts of the concerned domain to develop the analyst team’s market understanding and expertise. It improves and substantiates every single data presented in the market reports. Primary research mainly involves in telephonic interviews, E-mail interactions and face-to-face interviews with the raw material providers, manufacturers/producers, distributors, & independent consultants. The interviews that we conduct provides valuable data on market size and industry growth trends prevailing in the market. Our organization also conducts surveys with the various industry experts in order to gain overall insights of the industry/market. For instance, in healthcare industry we conduct surveys with the pharmacists, doctors, surgeons and nurses in order to gain insights and key information of a medical product/device/equipment which the customers are going to usage. Surveys are conducted in the form of questionnaire designed by our own analyst team. Surveys plays an important role in primary research because surveys helps us to identify the key target audiences of the market. Additionally, surveys helps to identify the key target audience engaged with the market. Our survey team conducts the survey by targeting the key audience, thus gaining insights from them. Based on the perspectives of the customers, this information is utilized to formulate market strategies. Moreover, market surveys helps us to understand the current competitive situation of the industry. To be precise, our survey process typically involve with the 360 analysis of the market. This analytical process begins by identifying the prospective customers for a product or service related to the market/industry to obtain data on how a product/service could fit into customers’ lives.

Secondary Research: The secondary data sources includes information published by the on-profit organizations such as World bank, WHO, company fillings, investor presentations, annual reports, national government documents, statistical databases, blogs, articles, white papers and others. From the annual report, we analyse a company’s revenue to understand the key segment and market share of that organization in a particular region. We analyse the company websites and adopt the product mapping technique which is important for deriving the segment revenue. In the product mapping method, we select and categorize the products offered by the companies catering to domain specific market, deduce the product revenue for each of the companies so as to get overall estimation of the market size. We also source data and analyses trends based on information received from supply side and demand side intermediaries in the value chain. The supply side denotes the data gathered from supplier, distributor, wholesaler and the demand side illustrates the data gathered from the end customers for respective market domain.

The supply side for a domain specific market is analysed by:
The demand side for the market is estimated through:
In-house Library: Apart from these third-party sources, we have our in-house library of qualitative and quantitative information. Our in-house database includes market data for various industry and domains. These data are updated on regular basis as per the changing market scenario. Our library includes, historic databases, internal audit reports and archives.
Sometimes there are instances where there is no metadata or raw data available for any domain specific market. For those cases, we use our expertise to forecast and estimate the market size in order to generate comprehensive data sets. Our analyst team adopt a robust research technique in order to produce the estimates:
Data Synthesis: This stage involves the analysis & mapping of all the information obtained from the previous step. It also involves in scrutinizing the data for any discrepancy observed while data gathering related to the market. The data is collected with consideration to the heterogeneity of sources. Robust scientific techniques are in place for synthesizing disparate data sets and provide the essential contextual information that can orient market strategies. The Brainy Insights has extensive experience in data synthesis where the data passes through various stages:


Market Deduction & Formulation: The final stage comprises of assigning data points at appropriate market spaces so as to deduce feasible conclusions. Analyst perspective & subject matter expert based holistic form of market sizing coupled with industry analysis also plays a crucial role in this stage.
This stage involves in finalization of the market size and numbers that we have collected from data integration step. With data interpolation, it is made sure that there is no gap in the market data. Successful trend analysis is done by our analysts using extrapolation techniques, which provide the best possible forecasts for the market.
Data Validation & Market Feedback: Validation is the most important step in the process. Validation & re-validation via an intricately designed process helps us finalize data-points to be used for final calculations.

The Brainy Insights interacts with leading companies and experts of the concerned domain to develop the analyst team’s market understanding and expertise. It improves and substantiates every single data presented in the market reports. The data validation interview and discussion panels are typically composed of the most experienced industry members. The participants include, however, are not limited to:
Moreover, we always validate our data and findings through primary respondents from all the major regions we are working on.


Free Customization
Fortune 500 Clients
Free Yearly Update On Purchase Of Multi/Corporate License
Companies Served Till Date