- +1-315-215-1633
- sales@thebrainyinsights.com

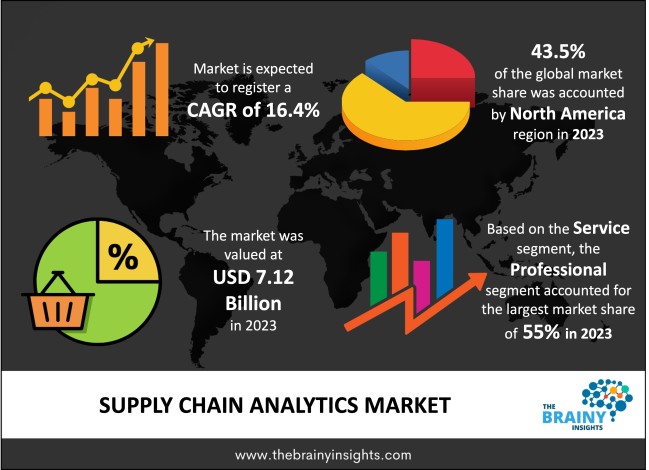
The global supply chain analytics market was valued at USD 7.12 billion in 2023, growing at a CAGR of 16.4% from 2024 to 2033. The market is expected to reach USD 32.53 billion by 2033. The increasing need for real-time visibility into the supply chain and the rising adoption of big data and advanced analytics technologies are expected to propel market growth. The demand for the supply chain analytics (SCA) market is increasing due to greater awareness among more organizations these days about the advantages of SCA solutions, such as precision in forecasting, optimization of supply chains, minimization of wastage, and meaningful synthesis of business data. The high growth of small & medium enterprises and their high expenditure on the implementation of analytics to hold a dominant position in the market and increase their position in comparison with other players in the market are expected to boost the market growth over the foreseeable years.
Supply chain analytics refers to the processes & tools utilized to combine and analyze data from numerous systems to gain insights into the processing, procurement, and distribution of goods. Supply chain analytics combines data from various Services, infrastructure, third-party sources, and emerging technologies like IoT to improve tactical, strategic, and operational decision-making, including supply chain management. It also delivers precise future & forecasting market trends and promotes better leadership in fortifying their industry position and utilizing the required knowledge, and it has gained a significant demand. Prescriptive supply chain analytics helps automate or prescribe the best action utilizing optimization or embedded decision logic. This can assist in improving decisions about when to launch a product, whether or not to build a factory or the best shipment approach for each retail location. Supply chain analytics gives associations a broader view of supply chain activities, permitting them to more effectively manage any issues that may impact the business’s sustainability or profitability. Mobile-based solutions help businesses track inadequate supplier networks, raised warehousing costs, and incorrect predictions, among other things. Supply Chain Analytics uses methods and tools to gain insights from supply chain data. This technology helps companies improve their supply chain efficiency and overall performance. As the amount, types, and speed of data in supply chain processes grow, traditional methods of collecting and analyzing data are no longer enough. On the other hand, big data technologies like Hadoop, Spark, and NoSQL can manage these extensive and varied data sets. This aspect allows business enterprises to handle both structured and unstructured data effectively.
Get an overview of this study by requesting a free sample
The rapidly increasing adoption in manufacturing enterprises: The high adoption of the service in various manufacturing industries & associations for better decision-making processes drives market growth. Further, supply chain analytics deliver better & more efficient supply chain management by providing real-time data of the organization according to the current requirement of the consumer organization. It reduced the product’s manufacturing cost and production time. As supply chain analytics deals with planning product material, sourcing, production, and distribution, it helps plan these factors and raise the manufacturer’s profitability.
The high implementation costs: The high implementation costs, along with the data privacy concerns & increased cyber threats, are expected to drive the market growth.
The deployment of artificial intelligence in supply chain analytics: The growing corporate knowledge regarding the advantages of analytics solutions is an opportunity factor for market growth. Additionally, the rapid penetration of digital technologies and the internet are helping to boost market growth. Artificial intelligence can provide firms with the instruments they require to manage & optimize their logistics web operations. Artificial intelligence can help companies to forecast demand, optimize routes, predict outcomes, automate tasks, manage inventory, and monitor security and compliance. Moreover, the ever-growing small and medium-sized businesses and their more significant expenditure on installing cutting-edge technology to develop their operations are expected to drive market growth.
The regions analyzed for the market include North America, Europe, South America, Asia Pacific, the Middle East, and Africa. North America emerged as the largest global supply chain analytics market, with a 43.5% market revenue share in 2023. The rising adoption of quick and effective supply chain operations is expected to propel market growth in this region. Moreover, the rising organizational development in automation, e-commerce, transportation, healthcare, food, and beverage enterprises are expected to drive market growth in this region. However, the increasing expenditure on Artificial intelligence across the region and the rising of cutting-edge technologies are also helping to stimulate market growth. The Asia Pacific region will account for the largest market share with revenue growth. This growth is attributed to the constantly expanding number of small and medium-sized businesses (SMBs) and their increasing expenditure on deploying cutting-edge technology to expand their enterprises. Further, the rising awareness of the benefits of analytics solutions among businesses and the rising acceptance of automation and digitalization are expected to drive market growth in this region.
North America Region Supply Chain Analytics Market Share in 2023 - 43.5%
www.thebrainyinsights.com
Check the geographical analysis of this market by requesting a free sample
The service segment is divided into support & maintenance and professional. The professional segment dominated the market, with a market share of around 55% in 2023. This growth is attributed to the rising desire for improved mobility among service consultants.
The solution segment is divided into manufacturing analytics, logistics analytics, visualization & reporting, sales & operations analytics, and planning & procurement. The sales & operations analytics segment dominated the market, with a market share of around 32% in 2023. This growth is attributed to the rising use of operations & sales analytics to give businesses data insights, which enhance their sales & operational efficiency.
The deployment segment is divided into on-premise and cloud. The cloud segment dominated the market, with a share of around 57% in 2023. This growth is attributed to their inherent attributes of scalability, flexibility, and cost-effectiveness.
The enterprise size segment is divided into small & medium enterprises and large enterprises. The large enterprises segment dominated the market, with a share of around 58% in 2023. This growth is attributed to the increasing demand from manufacturing, retail, and healthcare industries.
| Attribute | Description |
|---|---|
| Market Size | Revenue (USD Billion) |
| Market size value in 2023 | USD 7.12 Billion |
| Market size value in 2033 | USD 32.53 Billion |
| CAGR (2024 to 2033) | 16.4% |
| Historical data | 2020-2022 |
| Base Year | 2023 |
| Forecast | 2024-2033 |
| Region | The regions analyzed for the market are Asia Pacific, Europe, South America, North America, and Middle East & Africa. Furthermore, the regions are further analyzed at the country level. |
| Segments | Service, Solution, Deployment, Enterprise Size |
As per The Brainy Insights, the size of the supply chain analytics market was valued at USD 7.12 Billion in 2023 to USD 32.53 Billion by 2033.
The global supply chain analytics market is growing at a CAGR of 16.4% during the forecast period 2024-2033.
North America region emerged as the largest market for supply chain analytics.
1. Introduction
1.1. Objectives of the Study
1.2. Market Definition
1.3. Research Scope
1.4. Currency
1.5. Key Target Audience
2. Research Methodology and Assumptions
3. Executive Summary
4. Premium Insights
4.1. Porter’s Five Forces Analysis
4.2. Value Chain Analysis
4.3. Top Investment Pockets
4.3.1. Market Attractiveness Analysis By Service
4.3.2. Market Attractiveness Analysis By Solution
4.3.3. Market Attractiveness Analysis By Deployment
4.3.4. Market Attractiveness Analysis By Enterprise Size
4.3.5. Market Attractiveness Analysis By Region
4.4. Industry Trends
5. Market Dynamics
5.1. Market Evaluation
5.2. Drivers
5.2.1. The increasing need for real-time visibility into the supply chain
5.2.2. The rising adoption of big data and advanced analytics technologies
5.2.3. The rising penetration of the cloud-based supply chain
5.2.4. The rapidly growing adoption in manufacturing industries
5.3. Restraints
5.3.1. The high implementation costs
5.3.2. The lack of standards
5.4. Opportunities
5.4.1. The deployment of artificial intelligence in supply chain analytics
5.4.2. The growing data volume
6. Global Supply Chain Analytics Market Analysis and Forecast, By Service
6.1. Segment Overview
6.2. Support & Maintenance
6.3. Professional
7. Global Supply Chain Analytics Market Analysis and Forecast, By Solution
7.1. Segment Overview
7.2. Manufacturing Analytics
7.3. Logistics Analytics
7.4. Visualization & Reporting
7.5. Sales & Operations Analytics
7.6. Planning & Procurement
8. Global Supply Chain Analytics Market Analysis and Forecast, By Deployment
8.1. Segment Overview
8.2. On-premise
8.3. Cloud
9. Global Supply Chain Analytics Market Analysis and Forecast, By Enterprise Size
9.1. Segment Overview
9.2. Small & Medium Enterprises
9.3. Large Enterprise
10. Global Supply Chain Analytics Market Analysis and Forecast, By Regional Analysis
10.1. Segment Overview
10.2. North America
10.2.1. U.S.
10.2.2. Canada
10.2.3. Mexico
10.3. Europe
10.3.1. Germany
10.3.2. France
10.3.3. U.K.
10.3.4. Italy
10.3.5. Spain
10.4. Asia-Pacific
10.4.1. Japan
10.4.2. China
10.4.3. India
10.5. South America
10.5.1. Brazil
10.6. Middle East and Africa
10.6.1. UAE
10.6.2. South Africa
11. Global Supply Chain Analytics Market-Competitive Landscape
11.1. Overview
11.2. Market Share of Key Players in Global Supply Chain Analytics Market
11.2.1. Global Company Market Share
11.2.2. North America Company Market Share
11.2.3. Europe Company Market Share
11.2.4. APAC Company Market Share
11.3. Competitive Situations and Trends
11.3.1. Product Launches and Developments
11.3.2. Partnerships, Collaborations, and Agreements
11.3.3. Mergers & Acquisitions
11.3.4. Expansions
12. Company Profiles
12.1. IBM
12.1.1. Business Overview
12.1.2. Company Snapshot
12.1.3. Company Market Share Analysis
12.1.4. Company Product Portfolio
12.1.5. Recent Developments
12.1.6. SWOT Analysis
12.2. Oracle
12.2.1. Business Overview
12.2.2. Company Snapshot
12.2.3. Company Market Share Analysis
12.2.4. Company Product Portfolio
12.2.5. Recent Developments
12.2.6. SWOT Analysis
12.3. Software AG
12.3.1. Business Overview
12.3.2. Company Snapshot
12.3.3. Company Market Share Analysis
12.3.4. Company Product Portfolio
12.3.5. Recent Developments
12.3.6. SWOT Analysis
12.4. SAS Institute Inc.
12.4.1. Business Overview
12.4.2. Company Snapshot
12.4.3. Company Market Share Analysis
12.4.4. Company Product Portfolio
12.4.5. Recent Developments
12.4.6. SWOT Analysis
12.5. Micro Strategy Incorporated
12.5.1. Business Overview
12.5.2. Company Snapshot
12.5.3. Company Market Share Analysis
12.5.4. Company Product Portfolio
12.5.5. Recent Developments
12.5.6. SWOT Analysis
12.6. Qlik
12.6.1. Business Overview
12.6.2. Company Snapshot
12.6.3. Company Market Share Analysis
12.6.4. Company Product Portfolio
12.6.5. Recent Developments
12.6.6. SWOT Analysis
12.7. TABLEU SOFTWARE,LLC.
12.7.1. Business Overview
12.7.2. Company Snapshot
12.7.3. Company Market Share Analysis
12.7.4. Company Product Portfolio
12.7.5. Recent Developments
12.7.6. SWOT Analysis
12.8. Cloudera, Inc.
12.8.1. Business Overview
12.8.2. Company Snapshot
12.8.3. Company Market Share Analysis
12.8.4. Company Product Portfolio
12.8.5. Recent Developments
12.8.6. SWOT Analysis
12.9. TIBCO Software Inc.
12.9.1. Business Overview
12.9.2. Company Snapshot
12.9.3. Company Market Share Analysis
12.9.4. Company Product Portfolio
12.9.5. Recent Developments
12.9.6. SWOT Analysis
12.10. American Software,Inc.
12.10.1. Business Overview
12.10.2. Company Snapshot
12.10.3. Company Market Share Analysis
12.10.4. Company Product Portfolio
12.10.5. Recent Developments
12.10.6. SWOT Analysis
12.11. Birst, Inc.
12.11.1. Business Overview
12.11.2. Company Snapshot
12.11.3. Company Market Share Analysis
12.11.4. Company Product Portfolio
12.11.5. Recent Developments
12.11.6. SWOT Analysis
12.12. Aera Technology
12.12.1. Business Overview
12.12.2. Company Snapshot
12.12.3. Company Market Share Analysis
12.12.4. Company Product Portfolio
12.12.5. Recent Developments
12.12.6. SWOT Analysis
12.13. Accenture
12.13.1. Business Overview
12.13.2. Company Snapshot
12.13.3. Company Market Share Analysis
12.13.4. Company Product Portfolio
12.13.5. Recent Developments
12.13.6. SWOT Analysis
12.14. Genpact
12.14.1. Business Overview
12.14.2. Company Snapshot
12.14.3. Company Market Share Analysis
12.14.4. Company Product Portfolio
12.14.5. Recent Developments
12.14.6. SWOT Analysis
12.15. Capgemini
12.15.1. Business Overview
12.15.2. Company Snapshot
12.15.3. Company Market Share Analysis
12.15.4. Company Product Portfolio
12.15.5. Recent Developments
12.15.6. SWOT Analysis
12.16. JDA Software Inc.
12.16.1. Business Overview
12.16.2. Company Snapshot
12.16.3. Company Market Share Analysis
12.16.4. Company Product Portfolio
12.16.5. Recent Developments
12.16.6. SWOT Analysis
12.17. A.P. Moller – Maersk
12.17.1. Business Overview
12.17.2. Company Snapshot
12.17.3. Company Market Share Analysis
12.17.4. Company Product Portfolio
12.17.5. Recent Developments
12.17.6. SWOT Analysis
12.18. Kinaxis
12.18.1. Business Overview
12.18.2. Company Snapshot
12.18.3. Company Market Share Analysis
12.18.4. Company Product Portfolio
12.18.5. Recent Developments
12.18.6. SWOT Analysis
12.19. Lockheed Martin Corporation
12.19.1. Business Overview
12.19.2. Company Snapshot
12.19.3. Company Market Share Analysis
12.19.4. Company Product Portfolio
12.19.5. Recent Developments
12.19.6. SWOT Analysis
List of Table
1. Global Supply Chain Analytics Market, By Service, 2020-2033 (USD Billion)
2. Global Support & Maintenance, Supply Chain Analytics Market, By Region, 2020-2033 (USD Billion)
3. Global Professional, Supply Chain Analytics Market, By Region, 2020-2033 (USD Billion)
4. Global Supply Chain Analytics Market, By Solution, 2020-2033 (USD Billion)
5. Global Manufacturing Analytics, Supply Chain Analytics Market, By Region, 2020-2033 (USD Billion)
6. Global Logistics Analytics, Supply Chain Analytics Market, By Region, 2020-2033 (USD Billion)
7. Global Visualization & Reporting, Supply Chain Analytics Market, By Region, 2020-2033 (USD Billion)
8. Global Sales & Operations Analytics, Supply Chain Analytics Market, By Region, 2020-2033 (USD Billion)
9. Global Planning & Procurement, Supply Chain Analytics Market, By Region, 2020-2033 (USD Billion)
10. Global Supply Chain Analytics Market, By Deployment, 2020-2033 (USD Billion)
11. Global On-premise, Supply Chain Analytics Market, By Region, 2020-2033 (USD Billion)
12. Global Cloud, Supply Chain Analytics Market, By Region, 2020-2033 (USD Billion)
13. Global Supply Chain Analytics Market, By Enterprise Size, 2020-2033 (USD Billion)
14. Global Small & Medium Enterprises, Supply Chain Analytics Market, By Region, 2020-2033 (USD Billion)
15. Global Large Enterprise, Supply Chain Analytics Market, By Region, 2020-2033 (USD Billion)
16. North America Supply Chain Analytics Market, By Service, 2020-2033 (USD Billion)
17. North America Supply Chain Analytics Market, By Solution, 2020-2033 (USD Billion)
18. North America Supply Chain Analytics Market, By Deployment, 2020-2033 (USD Billion)
19. North America Supply Chain Analytics Market, By Enterprise Size, 2020-2033 (USD Billion)
20. U.S. Supply Chain Analytics Market, By Service, 2020-2033 (USD Billion)
21. U.S. Supply Chain Analytics Market, By Solution, 2020-2033 (USD Billion)
22. U.S. Supply Chain Analytics Market, By Deployment, 2020-2033 (USD Billion)
23. U.S. Supply Chain Analytics Market, By Enterprise Size, 2020-2033 (USD Billion)
24. Canada Supply Chain Analytics Market, By Service, 2020-2033 (USD Billion)
25. Canada Supply Chain Analytics Market, By Solution, 2020-2033 (USD Billion)
26. Canada Supply Chain Analytics Market, By Deployment, 2020-2033 (USD Billion)
27. Canada Supply Chain Analytics Market, By Enterprise Size, 2020-2033 (USD Billion)
28. Mexico Supply Chain Analytics Market, By Service, 2020-2033 (USD Billion)
29. Mexico Supply Chain Analytics Market, By Solution, 2020-2033 (USD Billion)
30. Mexico Supply Chain Analytics Market, By Deployment, 2020-2033 (USD Billion)
31. Mexico Supply Chain Analytics Market, By Enterprise Size, 2020-2033 (USD Billion)
32. Europe Supply Chain Analytics Market, By Service, 2020-2033 (USD Billion)
33. Europe Supply Chain Analytics Market, By Solution, 2020-2033 (USD Billion)
34. Europe Supply Chain Analytics Market, By Deployment, 2020-2033 (USD Billion)
35. Europe Supply Chain Analytics Market, By Enterprise Size, 2020-2033 (USD Billion)
36. Germany Supply Chain Analytics Market, By Service, 2020-2033 (USD Billion)
37. Germany Supply Chain Analytics Market, By Solution, 2020-2033 (USD Billion)
38. Germany Supply Chain Analytics Market, By Deployment, 2020-2033 (USD Billion)
39. Germany Supply Chain Analytics Market, By Enterprise Size, 2020-2033 (USD Billion)
40. France Supply Chain Analytics Market, By Service, 2020-2033 (USD Billion)
41. France Supply Chain Analytics Market, By Solution, 2020-2033 (USD Billion)
42. France Supply Chain Analytics Market, By Deployment, 2020-2033 (USD Billion)
43. France Supply Chain Analytics Market, By Enterprise Size, 2020-2033 (USD Billion)
44. U.K. Supply Chain Analytics Market, By Service, 2020-2033 (USD Billion)
45. U.K. Supply Chain Analytics Market, By Solution, 2020-2033 (USD Billion)
46. U.K. Supply Chain Analytics Market, By Deployment, 2020-2033 (USD Billion)
47. U.K. Supply Chain Analytics Market, By Enterprise Size, 2020-2033 (USD Billion)
48. Italy Supply Chain Analytics Market, By Service, 2020-2033 (USD Billion)
49. Italy Supply Chain Analytics Market, By Solution, 2020-2033 (USD Billion)
50. Italy Supply Chain Analytics Market, By Deployment, 2020-2033 (USD Billion)
51. Italy Supply Chain Analytics Market, By Enterprise Size, 2020-2033 (USD Billion)
52. Spain Supply Chain Analytics Market, By Service, 2020-2033 (USD Billion)
53. Spain Supply Chain Analytics Market, By Solution, 2020-2033 (USD Billion)
54. Spain Supply Chain Analytics Market, By Deployment, 2020-2033 (USD Billion)
55. Spain Supply Chain Analytics Market, By Enterprise Size, 2020-2033 (USD Billion)
56. Asia Pacific Supply Chain Analytics Market, By Service, 2020-2033 (USD Billion)
57. Asia Pacific Supply Chain Analytics Market, By Solution, 2020-2033 (USD Billion)
58. Asia Pacific Supply Chain Analytics Market, By Deployment, 2020-2033 (USD Billion)
59. Asia Pacific Supply Chain Analytics Market, By Enterprise Size, 2020-2033 (USD Billion)
60. Japan Supply Chain Analytics Market, By Service, 2020-2033 (USD Billion)
61. Japan Supply Chain Analytics Market, By Solution, 2020-2033 (USD Billion)
62. Japan Supply Chain Analytics Market, By Deployment, 2020-2033 (USD Billion)
63. Japan Supply Chain Analytics Market, By Enterprise Size, 2020-2033 (USD Billion)
64. China Supply Chain Analytics Market, By Service, 2020-2033 (USD Billion)
65. China Supply Chain Analytics Market, By Solution, 2020-2033 (USD Billion)
66. China Supply Chain Analytics Market, By Deployment, 2020-2033 (USD Billion)
67. China Supply Chain Analytics Market, By Enterprise Size, 2020-2033 (USD Billion)
68. India Supply Chain Analytics Market, By Service, 2020-2033 (USD Billion)
69. India Supply Chain Analytics Market, By Solution, 2020-2033 (USD Billion)
70. India Supply Chain Analytics Market, By Deployment, 2020-2033 (USD Billion)
71. India Supply Chain Analytics Market, By Enterprise Size, 2020-2033 (USD Billion)
72. South America Supply Chain Analytics Market, By Service, 2020-2033 (USD Billion)
73. South America Supply Chain Analytics Market, By Solution, 2020-2033 (USD Billion)
74. South America Supply Chain Analytics Market, By Deployment, 2020-2033 (USD Billion)
75. South America Supply Chain Analytics Market, By Enterprise Size, 2020-2033 (USD Billion)
76. Brazil Supply Chain Analytics Market, By Service, 2020-2033 (USD Billion)
77. Brazil Supply Chain Analytics Market, By Solution, 2020-2033 (USD Billion)
78. Brazil Supply Chain Analytics Market, By Deployment, 2020-2033 (USD Billion)
79. Brazil Supply Chain Analytics Market, By Enterprise Size, 2020-2033 (USD Billion)
80. Middle East and Africa Supply Chain Analytics Market, By Service, 2020-2033 (USD Billion)
81. Middle East and Africa Supply Chain Analytics Market, By Solution, 2020-2033 (USD Billion)
82. Middle East and Africa Supply Chain Analytics Market, By Deployment, 2020-2033 (USD Billion)
83. Middle East and Africa Supply Chain Analytics Market, By Enterprise Size, 2020-2033 (USD Billion)
84. UAE Supply Chain Analytics Market, By Service, 2020-2033 (USD Billion)
85. UAE Supply Chain Analytics Market, By Solution, 2020-2033 (USD Billion)
86. UAE Supply Chain Analytics Market, By Deployment, 2020-2033 (USD Billion)
87. UAE Supply Chain Analytics Market, By Enterprise Size, 2020-2033 (USD Billion)
88. South Africa Supply Chain Analytics Market, By Service, 2020-2033 (USD Billion)
89. South Africa Supply Chain Analytics Market, By Solution, 2020-2033 (USD Billion)
90. South Africa Supply Chain Analytics Market, By Deployment, 2020-2033 (USD Billion)
91. South Africa Supply Chain Analytics Market, By Enterprise Size, 2020-2033 (USD Billion)
List of Figures
1. Global Supply Chain Analytics Market Segmentation
2. Global Supply Chain Analytics Market: Research Methodology
3. Market Size Estimation Methodology: Bottom-Up Approach
4. Market Size Estimation Methodology: Top-Down Approach
5. Data Triangulation
6. Porter’s Five Forces Analysis
7. Value Chain Analysis
8. Global Supply Chain Analytics Market Attractiveness Analysis By Service
9. Global Supply Chain Analytics Market Attractiveness Analysis By Solution
10. Global Supply Chain Analytics Market Attractiveness Analysis By Deployment
11. Global Supply Chain Analytics Market Attractiveness Analysis By Enterprise Size
12. Global Supply Chain Analytics Market Attractiveness Analysis By Region
13. Global Supply Chain Analytics Market: Dynamics
14. Global Supply Chain Analytics Market Share By Service (2023 & 2033)
15. Global Supply Chain Analytics Market Share By Solution (2023 & 2033)
16. Global Supply Chain Analytics Market Share By Deployment (2023 & 2033)
17. Global Supply Chain Analytics Market Share By Enterprise Size (2023 & 2033)
18. Global Supply Chain Analytics Market Share By Regions (2023 & 2033)
19. Global Supply Chain Analytics Market Share By Company (2023)
This study forecasts revenue at global, regional, and country levels from 2020 to 2033. The Brainy Insights has segmented the global supply chain analytics based on below mentioned segments:
Global Supply Chain Analytics Market by Service:
Global Supply Chain Analytics Market by Solution:
Global Supply Chain Analytics Market by Deployment:
Global Supply Chain Analytics Market by Enterprise Size:
Global Supply Chain Analytics by Region:
Research has its special purpose to undertake marketing efficiently. In this competitive scenario, businesses need information across all industry verticals; the information about customer wants, market demand, competition, industry trends, distribution channels etc. This information needs to be updated regularly because businesses operate in a dynamic environment. Our organization, The Brainy Insights incorporates scientific and systematic research procedures in order to get proper market insights and industry analysis for overall business success. The analysis consists of studying the market from a miniscule level wherein we implement statistical tools which helps us in examining the data with accuracy and precision.
Our research reports feature both; quantitative and qualitative aspects for any market. Qualitative information for any market research process are fundamental because they reveal the customer needs and wants, usage and consumption for any product/service related to a specific industry. This in turn aids the marketers/investors in knowing certain perceptions of the customers. Qualitative research can enlighten about the different product concepts and designs along with unique service offering that in turn, helps define marketing problems and generate opportunities. On the other hand, quantitative research engages with the data collection process through interviews, e-mail interactions, surveys and pilot studies. Quantitative aspects for the market research are useful to validate the hypotheses generated during qualitative research method, explore empirical patterns in the data with the help of statistical tools, and finally make the market estimations.
The Brainy Insights offers comprehensive research and analysis, based on a wide assortment of factual insights gained through interviews with CXOs and global experts and secondary data from reliable sources. Our analysts and industry specialist assume vital roles in building up statistical tools and analysis models, which are used to analyse the data and arrive at accurate insights with exceedingly informative research discoveries. The data provided by our organization have proven precious to a diverse range of companies, facilitating them to address issues such as determining which products/services are the most appealing, whether or not customers use the product in the manner anticipated, the purchasing intentions of the market and many others.
Our research methodology encompasses an idyllic combination of primary and secondary initiatives. Key phases involved in this process are listed below:

The phase involves the gathering and collecting of market data and its related information with the help of different sources & research procedures.

The data procurement stage involves in data gathering and collecting through various data sources.
This stage involves in extensive research. These data sources includes:
Purchased Database: Purchased databases play a crucial role in estimating the market sizes irrespective of the domain. Our purchased database includes:
Primary Research: The Brainy Insights interacts with leading companies and experts of the concerned domain to develop the analyst team’s market understanding and expertise. It improves and substantiates every single data presented in the market reports. Primary research mainly involves in telephonic interviews, E-mail interactions and face-to-face interviews with the raw material providers, manufacturers/producers, distributors, & independent consultants. The interviews that we conduct provides valuable data on market size and industry growth trends prevailing in the market. Our organization also conducts surveys with the various industry experts in order to gain overall insights of the industry/market. For instance, in healthcare industry we conduct surveys with the pharmacists, doctors, surgeons and nurses in order to gain insights and key information of a medical product/device/equipment which the customers are going to usage. Surveys are conducted in the form of questionnaire designed by our own analyst team. Surveys plays an important role in primary research because surveys helps us to identify the key target audiences of the market. Additionally, surveys helps to identify the key target audience engaged with the market. Our survey team conducts the survey by targeting the key audience, thus gaining insights from them. Based on the perspectives of the customers, this information is utilized to formulate market strategies. Moreover, market surveys helps us to understand the current competitive situation of the industry. To be precise, our survey process typically involve with the 360 analysis of the market. This analytical process begins by identifying the prospective customers for a product or service related to the market/industry to obtain data on how a product/service could fit into customers’ lives.

Secondary Research: The secondary data sources includes information published by the on-profit organizations such as World bank, WHO, company fillings, investor presentations, annual reports, national government documents, statistical databases, blogs, articles, white papers and others. From the annual report, we analyse a company’s revenue to understand the key segment and market share of that organization in a particular region. We analyse the company websites and adopt the product mapping technique which is important for deriving the segment revenue. In the product mapping method, we select and categorize the products offered by the companies catering to domain specific market, deduce the product revenue for each of the companies so as to get overall estimation of the market size. We also source data and analyses trends based on information received from supply side and demand side intermediaries in the value chain. The supply side denotes the data gathered from supplier, distributor, wholesaler and the demand side illustrates the data gathered from the end customers for respective market domain.

The supply side for a domain specific market is analysed by:
The demand side for the market is estimated through:
In-house Library: Apart from these third-party sources, we have our in-house library of qualitative and quantitative information. Our in-house database includes market data for various industry and domains. These data are updated on regular basis as per the changing market scenario. Our library includes, historic databases, internal audit reports and archives.
Sometimes there are instances where there is no metadata or raw data available for any domain specific market. For those cases, we use our expertise to forecast and estimate the market size in order to generate comprehensive data sets. Our analyst team adopt a robust research technique in order to produce the estimates:
Data Synthesis: This stage involves the analysis & mapping of all the information obtained from the previous step. It also involves in scrutinizing the data for any discrepancy observed while data gathering related to the market. The data is collected with consideration to the heterogeneity of sources. Robust scientific techniques are in place for synthesizing disparate data sets and provide the essential contextual information that can orient market strategies. The Brainy Insights has extensive experience in data synthesis where the data passes through various stages:


Market Deduction & Formulation: The final stage comprises of assigning data points at appropriate market spaces so as to deduce feasible conclusions. Analyst perspective & subject matter expert based holistic form of market sizing coupled with industry analysis also plays a crucial role in this stage.
This stage involves in finalization of the market size and numbers that we have collected from data integration step. With data interpolation, it is made sure that there is no gap in the market data. Successful trend analysis is done by our analysts using extrapolation techniques, which provide the best possible forecasts for the market.
Data Validation & Market Feedback: Validation is the most important step in the process. Validation & re-validation via an intricately designed process helps us finalize data-points to be used for final calculations.

The Brainy Insights interacts with leading companies and experts of the concerned domain to develop the analyst team’s market understanding and expertise. It improves and substantiates every single data presented in the market reports. The data validation interview and discussion panels are typically composed of the most experienced industry members. The participants include, however, are not limited to:
Moreover, we always validate our data and findings through primary respondents from all the major regions we are working on.


Free Customization
Fortune 500 Clients
Free Yearly Update On Purchase Of Multi/Corporate License
Companies Served Till Date