- +1-315-215-1633
- sales@thebrainyinsights.com

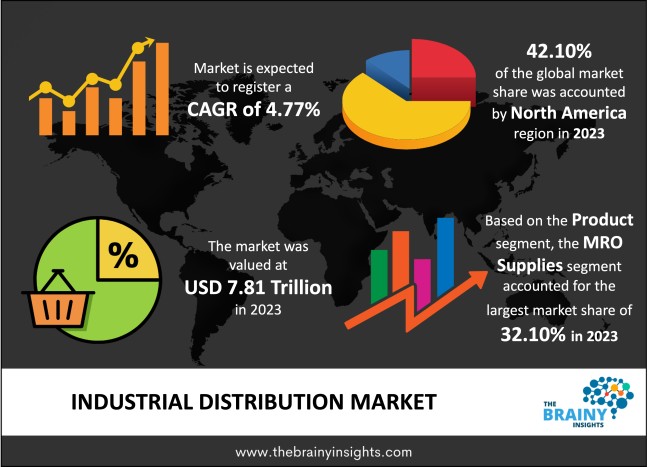
The global industrial distribution market is expected to grow from USD 7.81 Trillion in 2023 to USD 12.44 Trillion by 2033, at a CAGR of 4.77% during the forecast period 2024-2033. The North American region dominated the market in 2023. The rise in online sales will drive the market demand for industrial distribution. This is mainly because the growing demand will require a successful distribution network, as a faulty network will negatively impact the entire business cycle. This will lead to a rise in investment in the warehouse and logistics sector.
Industrial distribution is the transfer of industrial goods from their manufacturing hub to the end consumers through an industrial supply chain. Over the past 30 years, industrial distribution has rapidly expanded. It has been fueled by the pressure of constantly rising selling expenses and user demands quick service. Industrial businesses that once oversaw their direct salesforces now need to learn how to choose distributors and are discovering the challenges of developing and directing distributors' sales efforts. An industrial distributor is a sales firm that typically aids in moving the products to the end consumer via the supply chain, providing both corporate clients and suppliers with a helpful service. Industrial distributors are responsible for working alongside producers and accepting accountability for the goods they distribute. These businesses typically buy products in large quantities from producers and distribute them to businesses that use them for production or manufacturing. Industrial manufacturing has enabled ease of operations for various e-commerce and retail companies. Manufacturers can't open branches everywhere in the world. So, in such locations, manufacturers sell their products through local distributors. This saves money for manufacturers and also grows their business. Distributors have accurate information about the local market, such as customer requirements, market competition, and regulatory requirements, which makes it easier for manufacturers to estimate the market.
Get an overview of this study by requesting a free sample
Numerous benefits of industrial distribution: Companies not selling directly to customers can use alternate strategies provided by industrial distributors. Companies may reduce their carbon footprints, avoid offshore outsourcing, and reduce the cost of shipping with the help of industrial distribution. The industrial distribution sector is expanding in terms of technological innovation, and initiatives have been taken to satisfy consumer needs. Businesses can use industrial distribution centers to store their finished merchandise, parts, and manufacturing resources. Due to the system's homogeneity, the industrial distribution system has advantages when it comes to educating employees and administrators to manage and oversee the centers. The industrial distribution facilities are arranged to utilize software to track inventories and the flow of manufactured goods.
Mishandling of products- Industrial distribution facilities usually deal in large numbers of shipments of various organizations, which may sometimes lead to mishandling of the products. The product or the packaging can get damaged, which would ultimately increase the lead time. Therefore, the mishandling of products or their packaging is one of the critical factors that may hinder the market's growth over the forecast period.
Expansion of the e-commerce industry- Over the past ten years, the sales channel with the quickest growth has been e-commerce. According to many surveys, the digital transaction will account for 50 percent of the absolute value growth in the worldwide retail sector between 2020 and 2025. As more products are sold online, it translates to an increase in the total value of USD 1.4 trillion. As would be expected, given the two biggest e-commerce marketplaces in the world, China and the U.S. will account for 55% of the value growth in e-commerce potential. Latin America, a developing e-commerce market, saw a faster adoption of e-commerce due to the crisis as more people turned to online shopping for essentials.
Prone to cyberattacks – The advancements in the industrial distribution field are leading to machine learning and artificial intelligence adoption. Due to this, the software used in the maintenance and operation of industrial distribution is often prone to cyber security threats. Cyberattacks have increased in the recent decade, which is a challenge for market growth.
The regions analyzed for the market include North America, Europe, South America, Asia Pacific, the Middle East, and Africa. The North American region emerged as the most significant global industrial distribution market, with a revenue share of 42.10% in 2023. The region has a high market growth rate due to the presence of established end-user industries. The North American market will be driven by investment in the supply chain industry and transportation services. The presence of e-commerce players in the U.S. and Canada is providing lucrative growth opportunities for the market in the region. The Asia-Pacific region is anticipated to grow lucratively during the forecast period. The market is witnessing a lucrative growth rate due to the growth of local businesses in countries like India and China. Further, the increasing partnerships and mergers among major players will propel market growth.
North America region Industrial Distribution Market Share in 2023 - 42.10%
www.thebrainyinsights.com
Check the geographical analysis of this market by requesting a free sample
The product segment is divided into electrical supplies and equipment, OEM supplies, bearings, hand tools and power tools, MRO supplies, and others. The MRO supplies segment dominated the market with a revenue share of 32.10% in 2023. Maintenance repair and operations supplies are crucial for most commercial industries. Thus, it is essential to maintain the equipment to prevent losses to the company.
The application segment includes retail and e-commerce. The retail segment dominated the market with a revenue share of 67.93% in 2023. Retail channels account for most of the sales and thus majorly opt for industrial distribution. The retail manufacturers are focusing on providing competitive prices to the customers.
| Attribute | Description |
|---|---|
| Market Size | Revenue (USD Trillion) |
| Market size value in 2023 | USD 7.81 Trillion |
| Market size value in 2033 | USD 12.44 Trillion |
| CAGR (2024 to 2033) | 4.77% |
| Historical data | 2020-2022 |
| Base Year | 2023 |
| Forecast | 2024-2033 |
| Region | The regions examined for the market are Europe, Asia Pacific, North America, South America, and Middle East & Africa. |
| Segments | The research segment is based on product and application. |
As per The Brainy Insights, the size of the industrial distribution market was valued 7.81 Trillion in 2023 to USD 12.44 Trillion by 2033.
Global industrial distribution market is growing at a CAGR of 4.77% during the forecast period 2024-2033.
The global industrial distribution market has been segmented based on product, application and regions. The MRO supplies segment led the market in 2023 in the product segment. The retail segment led the market in 2023 in the application segment.
North America region emerged as the largest market for the industrial distribution.
The market's growth will be influenced by the growing use of industrial distribution in e-commerce and retail settings.
The mishandling of products could hamper the market growth.
The increasing investment in e-commerce is providing huge opportunities to the market.
1. Introduction
1.1. Objectives of the Study
1.2. Market Definition
1.3. Research Scope
1.4. Currency
1.5. Key Target Audience
2. Research Methodology and Assumptions
3. Executive Summary
4. Premium Insights
4.1. Porter’s Five Forces Analysis
4.2. Value Chain Analysis
4.3. Top Investment Pockets
4.3.1. Market Attractiveness Analysis by Product
4.3.2. Market Attractiveness Analysis by Application
4.3.3. Market Attractiveness Analysis by Region
4.4. Industry Trends
5. Market Dynamics
5.1. Market Evaluation
5.2. Drivers
5.2.1. Increasing use of industrial distribution in e-commerce applications
5.3. Restraints
5.3.1. Mishandling of products
5.4. Opportunities
5.4.1. Increasing penetration of e-commerce
5.5. Challenges
5.5.1. Less awareness in developing countries
6. Global Industrial Distribution Market Analysis and Forecast, By Product
6.1. Segment Overview
6.2. Electrical Supplies and Equipment
6.3. OEM Supplies
6.4. Bearings
6.5. Hand Tools and Power Tools
6.6. MRO Supplies
6.7. Others
7. Global Industrial Distribution Market Analysis and Forecast, By Application
7.1. Segment Overview
7.2. Retail
7.3. E-commerce
8. Global Industrial Distribution Market Analysis and Forecast, By Regional Analysis
8.1. Segment Overview
8.2. North America
8.2.1. U.S.
8.2.2. Canada
8.2.3. Mexico
8.3. Europe
8.3.1. Germany
8.3.2. France
8.3.3. U.K.
8.3.4. Italy
8.3.5. Spain
8.4. Asia-Pacific
8.4.1. Japan
8.4.2. China
8.4.3. India
8.5. South America
8.5.1. Brazil
8.6. Middle East and Africa
8.6.1. UAE
8.6.2. South Africa
9. Global Industrial Distribution Market-Competitive Landscape
9.1. Overview
9.2. Market Share of Key Players in the Industrial Distribution Market
9.2.1. Global Company Market Share
9.2.2. North America Company Market Share
9.2.3. Europe Company Market Share
9.2.4. APAC Company Market Share
9.3. Competitive Situations and Trends
9.3.1. Product Launches and Developments
9.3.2. Partnerships, Collaborations, and Agreements
9.3.3. Mergers & Acquisitions
9.3.4. Expansions
10. Company Profiles
10.1. W.W. Grainger
10.1.1. Business Overview
10.1.2. Company Snapshot
10.1.3. Company Market Share Analysis
10.1.4. Company Product Portfolio
10.1.5. Recent Developments
10.1.6. SWOT Analysis
10.2. WESCO International
10.2.1. Business Overview
10.2.2. Company Snapshot
10.2.3. Company Market Share Analysis
10.2.4. Company Product Portfolio
10.2.5. Recent Developments
10.2.6. SWOT Analysis
10.3. Sonepar USA
10.3.1. Business Overview
10.3.2. Company Snapshot
10.3.3. Company Market Share Analysis
10.3.4. Company Product Portfolio
10.3.5. Recent Developments
10.3.6. SWOT Analysis
10.4. Würth Industry
10.4.1. Business Overview
10.4.2. Company Snapshot
10.4.3. Company Market Share Analysis
10.4.4. Company Product Portfolio
10.4.5. Recent Developments
10.4.6. SWOT Analysis
10.5. Wolseley Industrial Group
10.5.1. Business Overview
10.5.2. Company Snapshot
10.5.3. Company Market Share Analysis
10.5.4. Company Product Portfolio
10.5.5. Recent Developments
10.5.6. SWOT Analysis
10.6. DXP Enterprises, Inc.
10.6.1. Business Overview
10.6.2. Company Snapshot
10.6.3. Company Market Share Analysis
10.6.4. Company Product Portfolio
10.6.5. Recent Developments
10.6.6. SWOT Analysis
10.7. Border States
10.7.1. Business Overview
10.7.2. Company Snapshot
10.7.3. Company Market Share Analysis
10.7.4. Company Product Portfolio
10.7.5. Recent Developments
10.7.6. SWOT Analysis
10.8. Kaman Distribution Group
1.1.1. Business Overview
1.1.2. Company Snapshot
1.1.3. Company Market Share Analysis
1.1.4. Company Product Portfolio
1.1.5. Recent Developments
1.1.6. SWOT Analysis
10.9. F.W. Webb
10.9.1. Business Overview
10.9.2. Company Snapshot
10.9.3. Company Market Share Analysis
10.9.4. Company Product Portfolio
10.9.5. Recent Developments
10.9.6. SWOT Analysis
10.10. Edgen Murray
10.10.1. Business Overview
10.10.2. Company Snapshot
10.10.3. Company Market Share Analysis
10.10.4. Company Product Portfolio
10.10.5. Recent Developments
10.10.6. SWOT Analysis
10.11. HD Supply
10.11.1. Business Overview
10.11.2. Company Snapshot
10.11.3. Company Market Share Analysis
10.11.4. Company Product Portfolio
10.11.5. Recent Developments
10.11.6. SWOT Analysis
10.12. Motion Industries
10.12.1. Business Overview
10.12.2. Company Snapshot
10.12.3. Company Market Share Analysis
10.12.4. Company Product Portfolio
10.12.5. Recent Developments
10.12.6. SWOT Analysis
10.13. Fastenal Company
10.13.1. Business Overview
10.13.2. Company Snapshot
10.13.3. Company Market Share Analysis
10.13.4. Company Product Portfolio
10.13.5. Recent Developments
10.13.6. SWOT Analysis
10.14. Rexel USA, Inc.
10.14.1. Business Overview
10.14.2. Company Snapshot
10.14.3. Company Market Share Analysis
10.14.4. Company Product Portfolio
10.14.5. Recent Developments
10.14.6. SWOT Analysis
10.15. Descours et Cabaud
10.15.1. Business Overview
10.15.2. Company Snapshot
10.15.3. Company Market Share Analysis
10.15.4. Company Product Portfolio
10.15.5. Recent Developments
10.15.6. SWOT Analysis
10.16. MRC Global
10.16.1. Business Overview
10.16.2. Company Snapshot
10.16.3. Company Market Share Analysis
10.16.4. Company Product Portfolio
10.16.5. Recent Developments
10.16.6. SWOT Analysis
10.17. Applied Industrial Technologies
10.17.1. Business Overview
10.17.2. Company Snapshot
10.17.3. Company Market Share Analysis
10.17.4. Company Product Portfolio
10.17.5. Recent Developments
10.17.6. SWOT Analysis
10.18. Winsupply Inc
10.18.1. Business Overview
10.18.2. Company Snapshot
10.18.3. Company Market Share Analysis
10.18.4. Company Product Portfolio
10.18.5. Recent Developments
10.18.6. SWOT Analysis
List of Table
1. Global Industrial Distribution Market, By Product, 2020-2033 (USD Trillion)
2. Global Electrical Supplies and Equipment, Industrial Distribution Market, By Region, 2020-2033 (USD Trillion)
3. Global OEM Supplies, Industrial Distribution Market, By Region, 2020-2033 (USD Trillion)
4. Global Bearings, Industrial Distribution Market, By Region, 2020-2033 (USD Trillion)
5. Global Hand Tools and Power Tools, Industrial Distribution Market, By Region, 2020-2033 (USD Trillion)
6. Global MRO Supplies, Industrial Distribution Market, By Region, 2020-2033 (USD Trillion)
7. Global Others, Industrial Distribution Market, By Region, 2020-2033 (USD Trillion)
8. Global Industrial Distribution Market, By Application, 2020-2033 (USD Trillion)
9. Global Retail, Industrial Distribution Market, By Region, 2020-2033 (USD Trillion)
10. Global E-commerce, Industrial Distribution Market, By Region, 2020-2033 (USD Trillion)
11. Global Industrial Distribution Market, By Region, 2020-2033 (USD Trillion)
12. North America Industrial Distribution Market, By Product, 2020-2033 (USD Trillion)
13. North America Industrial Distribution Market, By Application, 2020-2033 (USD Trillion)
14. U.S. Industrial Distribution Market, By Product, 2020-2033 (USD Trillion)
15. U.S. Industrial Distribution Market, By Application, 2020-2033 (USD Trillion)
16. Canada Industrial Distribution Market, By Product, 2020-2033 (USD Trillion)
17. Canada Industrial Distribution Market, By Application, 2020-2033 (USD Trillion)
18. Mexico Industrial Distribution Market, By Product, 2020-2033 (USD Trillion)
19. Mexico Industrial Distribution Market, By Application, 2020-2033 (USD Trillion)
20. Europe Industrial Distribution Market, By Product, 2020-2033 (USD Trillion)
21. Europe Industrial Distribution Market, By Application, 2020-2033 (USD Trillion)
22. Germany Industrial Distribution Market, By Product, 2020-2033 (USD Trillion)
23. Germany Industrial Distribution Market, By Application, 2020-2033 (USD Trillion)
24. France Industrial Distribution Market, By Product, 2020-2033 (USD Trillion)
25. France Industrial Distribution Market, By Application, 2020-2033 (USD Trillion)
26. U.K. Industrial Distribution Market, By Product, 2020-2033 (USD Trillion)
27. U.K. Industrial Distribution Market, By Application, 2020-2033 (USD Trillion)
28. Italy Industrial Distribution Market, By Product, 2020-2033 (USD Trillion)
29. Italy Industrial Distribution Market, By Application, 2020-2033 (USD Trillion)
30. Spain Industrial Distribution Market, By Product, 2020-2033 (USD Trillion)
31. Spain Industrial Distribution Market, By Application, 2020-2033 (USD Trillion)
32. Asia Pacific Industrial Distribution Market, By Product, 2020-2033 (USD Trillion)
33. Asia Pacific Industrial Distribution Market, By Application, 2020-2033 (USD Trillion)
34. Japan Industrial Distribution Market, By Product, 2020-2033 (USD Trillion)
35. Japan Industrial Distribution Market, By Application 2020-2033 (USD Trillion)
36. China Industrial Distribution Market, By Product, 2020-2033 (USD Trillion)
37. China Industrial Distribution Market, By Application, 2020-2033 (USD Trillion)
38. India Industrial Distribution Market, By Product, 2020-2033 (USD Trillion)
39. India Industrial Distribution Market, By Application, 2020-2033 (USD Trillion)
40. South America Industrial Distribution Market, By Product, 2020-2033 (USD Trillion)
41. South America Industrial Distribution Market, By Application, 2020-2033 (USD Trillion)
42. Brazil Industrial Distribution Market, By Product, 2020-2033 (USD Trillion)
43. Brazil Industrial Distribution Market, By Application, 2020-2033 (USD Trillion)
44. Middle East and Africa Industrial Distribution Market, By Product, 2020-2033 (USD Trillion)
45. Middle East and Africa Industrial Distribution Market, By Application, 2020-2033 (USD Trillion)
46. UAE Industrial Distribution Market, By Product, 2020-2033 (USD Trillion)
47. UAE Industrial Distribution Market, By Application, 2020-2033 (USD Trillion)
48. South Africa Industrial Distribution Market, By Product, 2020-2033 (USD Trillion)
49. South Africa Industrial Distribution Market, By Application, 2020-2033 (USD Trillion)
List of Figures
1. Global Industrial Distribution Market Segmentation
2. Industrial Distribution Market: Research Methodology
3. Market Size Estimation Methodology: Bottom-Up Approach
4. Market Size Estimation Methodology: Top-Down Approach
5. Data Triangulation
6. Porter’s Five Forces Analysis
7. Value Chain Analysis
8. Global Industrial Distribution Market Attractiveness Analysis by Product
9. Global Industrial Distribution Market Attractiveness Analysis by Application
10. Global Industrial Distribution Market Attractiveness Analysis by Region
11. Global Industrial Distribution Market: Dynamics
12. Global Industrial Distribution Market Share by Product (2023 & 2033)
13. Global Industrial Distribution Market Share by Application (2023 & 2033)
14. Global Industrial Distribution Market Share by Regions (2023 & 2033)
15. Global Industrial Distribution Market Share by Company (2023)
This study forecasts revenue at global, regional, and country levels from 2019 to 2032. The Brainy Insights has segmented the global industrial distribution market based on below mentioned segments:
Global Industrial Distribution Market by Product:
Global Industrial Distribution Market by Application:
Global Industrial distribution Market by Region:
Research has its special purpose to undertake marketing efficiently. In this competitive scenario, businesses need information across all industry verticals; the information about customer wants, market demand, competition, industry trends, distribution channels etc. This information needs to be updated regularly because businesses operate in a dynamic environment. Our organization, The Brainy Insights incorporates scientific and systematic research procedures in order to get proper market insights and industry analysis for overall business success. The analysis consists of studying the market from a miniscule level wherein we implement statistical tools which helps us in examining the data with accuracy and precision.
Our research reports feature both; quantitative and qualitative aspects for any market. Qualitative information for any market research process are fundamental because they reveal the customer needs and wants, usage and consumption for any product/service related to a specific industry. This in turn aids the marketers/investors in knowing certain perceptions of the customers. Qualitative research can enlighten about the different product concepts and designs along with unique service offering that in turn, helps define marketing problems and generate opportunities. On the other hand, quantitative research engages with the data collection process through interviews, e-mail interactions, surveys and pilot studies. Quantitative aspects for the market research are useful to validate the hypotheses generated during qualitative research method, explore empirical patterns in the data with the help of statistical tools, and finally make the market estimations.
The Brainy Insights offers comprehensive research and analysis, based on a wide assortment of factual insights gained through interviews with CXOs and global experts and secondary data from reliable sources. Our analysts and industry specialist assume vital roles in building up statistical tools and analysis models, which are used to analyse the data and arrive at accurate insights with exceedingly informative research discoveries. The data provided by our organization have proven precious to a diverse range of companies, facilitating them to address issues such as determining which products/services are the most appealing, whether or not customers use the product in the manner anticipated, the purchasing intentions of the market and many others.
Our research methodology encompasses an idyllic combination of primary and secondary initiatives. Key phases involved in this process are listed below:

The phase involves the gathering and collecting of market data and its related information with the help of different sources & research procedures.

The data procurement stage involves in data gathering and collecting through various data sources.
This stage involves in extensive research. These data sources includes:
Purchased Database: Purchased databases play a crucial role in estimating the market sizes irrespective of the domain. Our purchased database includes:
Primary Research: The Brainy Insights interacts with leading companies and experts of the concerned domain to develop the analyst team’s market understanding and expertise. It improves and substantiates every single data presented in the market reports. Primary research mainly involves in telephonic interviews, E-mail interactions and face-to-face interviews with the raw material providers, manufacturers/producers, distributors, & independent consultants. The interviews that we conduct provides valuable data on market size and industry growth trends prevailing in the market. Our organization also conducts surveys with the various industry experts in order to gain overall insights of the industry/market. For instance, in healthcare industry we conduct surveys with the pharmacists, doctors, surgeons and nurses in order to gain insights and key information of a medical product/device/equipment which the customers are going to usage. Surveys are conducted in the form of questionnaire designed by our own analyst team. Surveys plays an important role in primary research because surveys helps us to identify the key target audiences of the market. Additionally, surveys helps to identify the key target audience engaged with the market. Our survey team conducts the survey by targeting the key audience, thus gaining insights from them. Based on the perspectives of the customers, this information is utilized to formulate market strategies. Moreover, market surveys helps us to understand the current competitive situation of the industry. To be precise, our survey process typically involve with the 360 analysis of the market. This analytical process begins by identifying the prospective customers for a product or service related to the market/industry to obtain data on how a product/service could fit into customers’ lives.

Secondary Research: The secondary data sources includes information published by the on-profit organizations such as World bank, WHO, company fillings, investor presentations, annual reports, national government documents, statistical databases, blogs, articles, white papers and others. From the annual report, we analyse a company’s revenue to understand the key segment and market share of that organization in a particular region. We analyse the company websites and adopt the product mapping technique which is important for deriving the segment revenue. In the product mapping method, we select and categorize the products offered by the companies catering to domain specific market, deduce the product revenue for each of the companies so as to get overall estimation of the market size. We also source data and analyses trends based on information received from supply side and demand side intermediaries in the value chain. The supply side denotes the data gathered from supplier, distributor, wholesaler and the demand side illustrates the data gathered from the end customers for respective market domain.

The supply side for a domain specific market is analysed by:
The demand side for the market is estimated through:
In-house Library: Apart from these third-party sources, we have our in-house library of qualitative and quantitative information. Our in-house database includes market data for various industry and domains. These data are updated on regular basis as per the changing market scenario. Our library includes, historic databases, internal audit reports and archives.
Sometimes there are instances where there is no metadata or raw data available for any domain specific market. For those cases, we use our expertise to forecast and estimate the market size in order to generate comprehensive data sets. Our analyst team adopt a robust research technique in order to produce the estimates:
Data Synthesis: This stage involves the analysis & mapping of all the information obtained from the previous step. It also involves in scrutinizing the data for any discrepancy observed while data gathering related to the market. The data is collected with consideration to the heterogeneity of sources. Robust scientific techniques are in place for synthesizing disparate data sets and provide the essential contextual information that can orient market strategies. The Brainy Insights has extensive experience in data synthesis where the data passes through various stages:


Market Deduction & Formulation: The final stage comprises of assigning data points at appropriate market spaces so as to deduce feasible conclusions. Analyst perspective & subject matter expert based holistic form of market sizing coupled with industry analysis also plays a crucial role in this stage.
This stage involves in finalization of the market size and numbers that we have collected from data integration step. With data interpolation, it is made sure that there is no gap in the market data. Successful trend analysis is done by our analysts using extrapolation techniques, which provide the best possible forecasts for the market.
Data Validation & Market Feedback: Validation is the most important step in the process. Validation & re-validation via an intricately designed process helps us finalize data-points to be used for final calculations.

The Brainy Insights interacts with leading companies and experts of the concerned domain to develop the analyst team’s market understanding and expertise. It improves and substantiates every single data presented in the market reports. The data validation interview and discussion panels are typically composed of the most experienced industry members. The participants include, however, are not limited to:
Moreover, we always validate our data and findings through primary respondents from all the major regions we are working on.


Free Customization
Fortune 500 Clients
Free Yearly Update On Purchase Of Multi/Corporate License
Companies Served Till Date