- +1-315-215-1633
- sales@thebrainyinsights.com

Global Power Tools market seems to reach USD 51.02 billion by 2033, at a CAGR of 2.88% from 2024 to 2033. Global Power Tools market is witnessing a considerable growth owing to the growth in construction and automotive industries. Power tools are crucial industrial machines which help mass-produce goods with enhanced quality and speed.
Power tools are used in the field of construction, shipbuilding, automotive firms etc. It works using the mechanism and the power source, which is completely different from the hand tools used by the manual labour. Some of the mechanism and the power source used by the power tools are IC engines, electric motor etc. These power tools have many applications commercially and industrial such as cutting, grinding, sanding, drilling, shaping, polishing and many more. Power Tools are available in many forms and known for its ease of use, some of them are electric screwdriver, hammer drills etc. Power tools can be broadly divided into portable and handheld. Portable power tools are more in demand because of its mobility, but stationary power tools are used for its faster and its accurate precision. The stationary power tools which are related to metalworking is referred to as machine tools and is generally not used in woodworking. Following the recent trend, the cordless power tools are more in demand and will continue to grow in the forecasting period, so all the power tools manufacturing companies are investing a significant amount in R&D for it. All these factors are fuelling the Power tools market. With an increase in the application of power tools in the sector like construction, automobile, aerospace building and shipbuilding, etc., the demand for more mobile power tools providing the same degree of flexibility and compatibility. This is giving rise to the cordless power tools, which is, in turn, driving the power tools market. Also, with the advancement in technologies, came the advancement in battery technologies, Lithium batteries give longer operational life; this is pushing up the cordless power tools. On the basis of the report by the European Power Tool Association (EPTA) in 2018, the cordless power tools section held the account of around 50% market share in Power tools market. The rapid growth in construction and automotive section, especially in the developing countries are driving the power tools market. Also, the surging demand for automation in many industrial sector is also driving the market. But there is always a fluctuation in the price of raw materials and the high cost involved in maintenance are acting as the major restraint for the market. Also, in the developing countries, there is a surge in labour cost, and also the rise in the production in the automotive sector and growth in the construction industry is also propelling the power tools market.
Get an overview of this study by requesting a free sample
The surge in the per capita income of the people in the developed and developing countries have led to a change in the lifestyle of the people. People now have more access to the quality products. The need of the people have increased, they want ease of life; this has led to the increasing prices of the properties. Also, there is a rise in the demand of luxurious and comfortable cars. The growth in the infrastructure has also led to the demand of the commercial vehicle. All these factors have given a surge in the construction and automotive industries. This, in turn, has given rise to the demand of Power tools market, as it is broadly used in the construction industry and in the automotive industries where the expanding automation and rise in the production have increased the demand of power tools. There is a huge demand for power tools in the automotive industry as it is used in high-performance task and in the cutting of heavy metals.
The rise in the labour cost in the developing countries is driving the power tools market. The developing countries like China, India and Brazil, have cheap labour cost compared with the developed nation but gradually there is arise in the labour cost, which has made various industries in the developing region to start looking for the solutions, which has made them start using of power tools, and this has increased the growth of power tools market in various industry sectors in the emerging economies as it is easy to use and it increases the productivity of the industries, which is also helping the manufacturing firms in meeting the rising demand of the customers in the developing countries.
The fluctuation in the price of raw materials producing Power Tools are acting as a restraint for the market. The fluctuation in the price would cause the fluctuation in supply of Power Tools, which ultimately someday would not able to meet the demand. The price of the Power Tools will then rise, resulted in the less buying of power tools, and the end-user industries would start looking for some other source and would not buy the new advanced power tools, which will reduce the demand of the power tools market. So the fluctuations in the price of raw materials are the major restraint for the power tools market.
The more application of power tools in almost all types of industries like in the construction, shipbuilding, furniture, automotive firms etc. has created the demand for cordless power tools as it provides mobility along with the same degree of flexibility and compatibility as the other power tools. This has made the Power tools manufacturing companies to invest in R&D for the cordless power tools technology, as there is a huge opportunity for this market. According to the EPTA in the year, cordless power tools is accounted for the 50% market share of the power tool market in Europe. There is a huge requirement of cordless power tools in the automotive industries, where there is a requirement of high-performance task. The increasing use of power tools in the household task will also increase the demand for the wireless power tools in the forecasting period. The advancement in battery technologies like Lithium batteries gives long operational life; this is also pushing up the cordless power tools.
The global Power Tools market has been segmented based on mode of operation, tool type, application and regions.
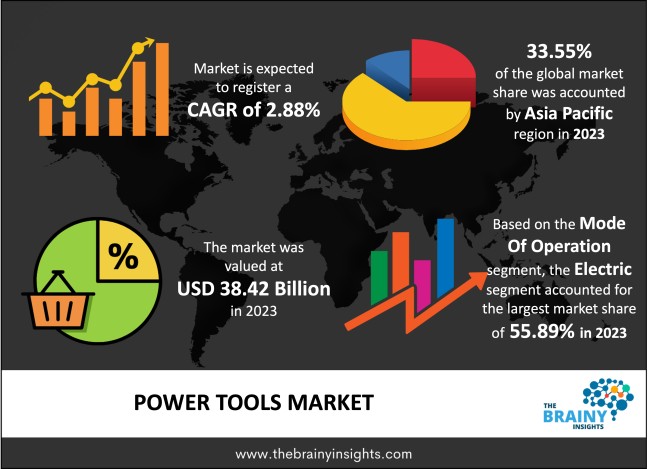
The regions analyzed for the market include North America, Europe, South America, Asia Pacific, and the Middle East and Africa. Asia Pacific is accounting for the highest marketing share in 2023.
Asia Pacific Power Tools Market Share in 2023 - 33.55%
www.thebrainyinsights.com
Check the geographical analysis of this market by requesting a free sample
The big players are now focused in the implementation of strategies like joint venture, product innovations, merger and acquisition and partnerships etc. to gain the market share and to strengthen its position in global Power Tools industry.
In November 2019, Atlas Copco acquired WestRon. This acquisition helps the supply chain network of the organization, which would help in the expansion of market share.
In February 2019, Emerson Electric co completed the acquisition of GE’s Intelligent Platform business. This acquisition will further expand the organization presence in hybrid and discrete end market as a complete automated solution provider.
As per The Brainy Insights, the size of the Power Tools market was valued at USD 38.42 billion in 2023 and is anticipated to reach USD 51.02 billion by 2033.
Global Power Tools market is growing at a CAGR of 2.88% during the forecast period 2024-2033.
The Asia Pacific region emerged as the largest market for the Power Tools.
The growth in construction and automotive industries is the key driving factors for the Power Tools market.
The fluctuations in the price of raw materials could hamper the market growth.
The surge in the demand of cordless power tools will provide huge opportunities to the market.
Key players are Atlas Copco AB, Emerson Electric Co., Hilti Corporation, Ingersoll-Rand plc, Koki Holdings Co., Ltd., Makita Corporation, Robert Bosch GmbH.
1. Introduction
1.1. Objectives of the Study
1.2. Market Definition
1.3. Research Scope
1.4. Currency
1.5. Key Target Audience
2. Research Methodology and Assumptions
3. Executive Summary
4. Premium Insights
4.1. Porter’s Five Forces Analysis
4.2. Value Chain Analysis
4.3. Top Investment Pockets
4.3.1. Market Attractiveness Analysis By Mode of Operation
4.3.2. Market Attractiveness Analysis By Tool Type
4.3.3. Market Attractiveness Analysis By Application
4.3.4. Market Attractiveness Analysis By Region
4.4. Industry Trends
5. Market Dynamics
5.1. Market Evaluation
5.2. Drivers
5.3. Restraints
5.4. Opportunities
5.5. Challenges
6. Global Power Tools Market Analysis and Forecast, By Mode of Operation
6.1. Segment Overview
6.2. Electric
6.2.1. Corded Power Tools
6.2.2. Cordless Power Tools
6.3. Pneumatic
6.4. Others
7. Global Power Tools Market Analysis and Forecast, By Tool Type
7.1. Segment Overview
7.2. Drills
7.3. Saws
7.4. Wrenches
7.5. Material Removal Tool
7.6. Others
8. Global Power Tools Market Analysis and Forecast, By Application
8.1. Segment Overview
8.2. Industrial
8.2.1. Construction
8.2.2. Automotive
8.2.3. Aerospace
8.2.4. Others
8.3. Do-It-Yourself (DIY)
9. Global Power Tools Market Analysis and Forecast, By Regional Analysis
9.1. Segment Overview
9.2. North America
9.2.1. U.S.
9.2.2. Canada
9.2.3. Mexico
9.3. Europe
9.3.1. Germany
9.3.2. France
9.3.3. U.K.
9.3.4. Italy
9.3.5. Spain
9.4. Asia-Pacific
9.4.1. Japan
9.4.2. China
9.4.3. India
9.5. South America
9.5.1. Brazil
9.6. Middle East and Africa
9.6.1. UAE
9.6.2. South Africa
10. Global Power Tools Market-Competitive Landscape
10.1. Overview
10.2. Market Share of Key Players in Global Power Tools Market
10.2.1. Global Company Market Share
10.2.2. North America Company Market Share
10.2.3. Europe Company Market Share
10.2.4. APAC Company Market Share
10.3. Competitive Situations and Trends
10.3.1. Product Launches and Developments
10.3.2. Partnerships, Collaborations, and Agreements
10.3.3. Mergers & Acquisitions
10.3.4. Expansions
11. Company Profiles
11.1. Atlas Copco AB
11.1.1. Business Overview
11.1.2. Company Snapshot
11.1.3. Company Market Share Analysis
11.1.4. Company Product Portfolio
11.1.5. Recent Developments
11.1.6. SWOT Analysis
11.2. Emerson Electric Co
11.2.1. Business Overview
11.2.2. Company Snapshot
11.2.3. Company Market Share Analysis
11.2.4. Company Product Portfolio
11.2.5. Recent Developments
11.2.6. SWOT Analysis
11.3. Hilti Corporation
11.3.1. Business Overview
11.3.2. Company Snapshot
11.3.3. Company Market Share Analysis
11.3.4. Company Product Portfolio
11.3.5. Recent Developments
11.3.6. SWOT Analysis
11.4. Ingersoll-Rand plc
11.4.1. Business Overview
11.4.2. Company Snapshot
11.4.3. Company Market Share Analysis
11.4.4. Company Product Portfolio
11.4.5. Recent Developments
11.4.6. SWOT Analysis
11.5. Koki Holdings Co., Ltd
11.5.1. Business Overview
11.5.2. Company Snapshot
11.5.3. Company Market Share Analysis
11.5.4. Company Product Portfolio
11.5.5. Recent Developments
11.5.6. SWOT Analysis
11.6. Makita Corporation
11.6.1. Business Overview
11.6.2. Company Snapshot
11.6.3. Company Market Share Analysis
11.6.4. Company Product Portfolio
11.6.5. Recent Developments
11.6.6. SWOT Analysis
11.7. Robert Bosch GmbH
11.7.1. Business Overview
11.7.2. Company Snapshot
11.7.3. Company Market Share Analysis
11.7.4. Company Product Portfolio
11.7.5. Recent Developments
11.7.6. SWOT Analysis
11.8. Snap-on Incorporated
11.8.1. Business Overview
11.8.2. Company Snapshot
11.8.3. Company Market Share Analysis
11.8.4. Company Product Portfolio
11.8.5. Recent Developments
11.8.6. SWOT Analysis
11.9. Stanley Black & Decker Inc
11.9.1. Business Overview
11.9.2. Company Snapshot
11.9.3. Company Market Share Analysis
11.9.4. Company Product Portfolio
11.9.5. Recent Developments
11.9.6. SWOT Analysis
11.10. Techtronic Industries Co. Ltd
11.10.1. Business Overview
11.10.2. Company Snapshot
11.10.3. Company Market Share Analysis
11.10.4. Company Product Portfolio
11.10.5. Recent Developments
11.10.6. SWOT Analysis
List of Table
1. Global Power Tools Market, By Mode of Operation , 2020-2033(USD Billion)
2. Global Electric Power Tools Market, By Region, 2020-2033(USD Billion)
3. Global Corded Power Tools Electric Market, By Region, 2020-2033(USD Billion)
4. Global Cordless Power Tools Electric Market, By Region, 2020-2033(USD Billion)
5. Global Pneumatic Power Tools Market, By Region, 2020-2033(USD Billion)
6. Global Others Power Tools Market, By Region, 2020-2033(USD Billion)
7. Global Power Tools Market, By Tool Type , 2020-2033(USD Billion)
8. Global Drills Power Tools Market, By Region, 2020-2033(USD Billion)
9. Global Saws Power Tools Electric Market, By Region, 2020-2033(USD Billion)
10. Global Wrenches Power Tools Electric Market, By Region, 2020-2033(USD Billion)
11. Global Material Removal Tool Power Tools Electric Market, By Region, 2020-2033(USD Billion)
12. Global Others Power Tools Electric Market, By Region, 2020-2033(USD Billion)
13. Global Power Tools Market, By Application , 2020-2033(USD Billion)
14. Global Industrial, Power Tools Market, By Region, 2020-2033(USD Billion)
15. Global Construction, Power Tools Market, By Region, 2020-2033(USD Billion)
16. Global Automotive, Power Tools Market, By Region, 2020-2033(USD Billion)
17. Global Aerospace, Power Tools Market, By Region, 2020-2033(USD Billion)
18. Global Others, Power Tools Market, By Region, 2020-2033(USD Billion)
19. Global Do-It-Yourself (DIY), Power Tools Market, By Region, 2020-2033(USD Billion)
20. Global Power Tools Market, By Region, 2020-2033(USD Billion)
21. Global Power Tools Market, By North America, 2020-2033(USD Billion)
22. North America Power Tools Market, By Mode of Operation, 2020-2033(USD Billion)
23. North America Power Tools Market, By Tool Type, 2020-2033(USD Billion)
24. North America Power Tools Market, By Application, 2020-2033(USD Billion)
25. U.S. Power Tools Market, By Mode of Operation, 2020-2033(USD Billion)
26. U.S. Power Tools Market, By Tool Type, 2020-2033(USD Billion)
27. U.S. Power Tools Market, By Application, 2020-2033(USD Billion)
28. Canada Power Tools Market, By Mode of Operation, 2020-2033(USD Billion)
29. Canada Power Tools Market, By Tool Type, 2020-2033(USD Billion)
30. Canada Power Tools Market, By Application, 2020-2033(USD Billion)
31. Mexico Power Tools Market, By Mode of Operation, 2020-2033(USD Billion)
32. Mexico Power Tools Market, By Tool Type, 2020-2033(USD Billion)
33. Mexico Power Tools Market, By Application, 2020-2033(USD Billion)
34. Europe Power Tools Market, By Mode of Operation, 2020-2033(USD Billion)
35. Europe Power Tools Market, By Tool Type, 2020-2033(USD Billion)
36. Europe Power Tools Market, By Application, 2020-2033(USD Billion)
37. Germany Power Tools Market, By Mode of Operation, 2020-2033(USD Billion)
38. Germany Power Tools Market, By Tool Type, 2020-2033(USD Billion)
39. Germany Power Tools Market, By Application, 2020-2033(USD Billion)
40. France Power Tools Market, By Mode of Operation, 2020-2033(USD Billion)
41. France Power Tools Market, By Tool Type, 2020-2033(USD Billion)
42. France Power Tools Market, By Application, 2020-2033(USD Billion)
43. U.K. Power Tools Market, By Mode of Operation, 2020-2033(USD Billion)
44. U.K. Power Tools Market, By Tool Type, 2020-2033(USD Billion)
45. U.K. Power Tools Market, By Application, 2020-2033(USD Billion)
46. Italy Power Tools Market, By Mode of Operation, 2020-2033(USD Billion)
47. Italy Power Tools Market, By Tool Type, 2020-2033(USD Billion)
48. Italy Power Tools Market, By Application, 2020-2033(USD Billion)
49. Spain Power Tools Market, By Mode of Operation, 2020-2033(USD Billion)
50. Spain Power Tools Market, By Tool Type, 2020-2033(USD Billion)
51. Spain Power Tools Market, By Application, 2020-2033(USD Billion)
52. Asia Pacific Power Tools Market, By Mode of Operation, 2020-2033(USD Billion)
53. Asia Pacific Power Tools Market, By Tool Type, 2020-2033(USD Billion)
54. Asia Pacific Power Tools Market, By Application, 2020-2033(USD Billion)
55. Japan Power Tools Market, By Mode of Operation, 2020-2033(USD Billion)
56. Japan Power Tools Market, By Tool Type, 2020-2033(USD Billion)
57. Japan Power Tools Market, By Application, 2020-2033(USD Billion)
58. China Power Tools Market, By Mode of Operation, 2020-2033(USD Billion)
59. China Power Tools Market, By Tool Type, 2020-2033(USD Billion)
60. China Power Tools Market, By Application, 2020-2033(USD Billion)
61. India Power Tools Market, By Mode of Operation, 2020-2033(USD Billion)
62. India Power Tools Market, By Tool Type, 2020-2033(USD Billion)
63. India Power Tools Market, By Application, 2020-2033(USD Billion)
64. South America Power Tools Market, By Mode of Operation, 2020-2033(USD Billion)
65. South America Power Tools Market, By Tool Type, 2020-2033(USD Billion)
66. South America Power Tools Market, By Application, 2020-2033(USD Billion)
67. Brazil Power Tools Market, By Mode of Operation, 2020-2033(USD Billion)
68. Brazil Power Tools Market, By Tool Type, 2020-2033(USD Billion)
69. Brazil Power Tools Market, By Application, 2020-2033(USD Billion)
70. Middle East and Africa Power Tools Market, By Mode of Operation, 2020-2033(USD Billion)
71. Middle East and Africa Power Tools Market, By Tool Type, 2020-2033(USD Billion)
72. Middle East and Africa Power Tools Market, By Application, 2020-2033(USD Billion)
73. UAE Power Tools Market, By Mode of Operation, 2020-2033(USD Billion)
74. UAE Power Tools Market, By Tool Type, 2020-2033(USD Billion)
75. UAE Power Tools Market, By Application, 2020-2033(USD Billion)
76. South Africa Power Tools Market, By Mode of Operation, 2020-2033(USD Billion)
77. South Africa Power Tools Market, By Tool Type, 2020-2033(USD Billion)
78. South Africa Power Tools Market, By Application, 2020-2033(USD Billion)
List of Figures
1. Global Power Tools Market Segmentation
2. Power Tools Market: Research Methodology
3. Market Size Estimation Methodology: Bottom-Up Approach
4. Market Size Estimation Methodology: Top-Down Approach
5. Data Triangulation
6. Porter’s Five Forces Analysis
7. Value Chain Analysis
8. Global Power Tools Market Attractiveness Analysis By Mode of Operation
9. Global Power Tools Market Attractiveness Analysis By Tool type
10. Global Power Tools Market Attractiveness Analysis By Application
11. Global Power Tools Market Attractiveness Analysis By Region
12. Global Power Tools Market: Dynamics
13. Global Power Tools Market Share By Mode of Operation (2023 & 2033)
14. Global Power Tools Market Share by Tool Type (2023 & 2033)
15. Global Power Tools Market Share by Application (2023 & 2033)
16. Global Power Tools Market Share by Regions (2023 & 2033)
17. Global Power Tools Market Share by Company (2023)
This study forecasts revenue at global, regional, and country levels from 2020 to 2033. The Brainy Insights has segmented the global Power Tools market on the basis of below mentioned segments:
Global Power Tools Market by Mode of Operation:
Global Power Tools Market by Tool Type:
Global Power Tools Market by Application:
Global Power Tools Market by Region:
Research has its special purpose to undertake marketing efficiently. In this competitive scenario, businesses need information across all industry verticals; the information about customer wants, market demand, competition, industry trends, distribution channels etc. This information needs to be updated regularly because businesses operate in a dynamic environment. Our organization, The Brainy Insights incorporates scientific and systematic research procedures in order to get proper market insights and industry analysis for overall business success. The analysis consists of studying the market from a miniscule level wherein we implement statistical tools which helps us in examining the data with accuracy and precision.
Our research reports feature both; quantitative and qualitative aspects for any market. Qualitative information for any market research process are fundamental because they reveal the customer needs and wants, usage and consumption for any product/service related to a specific industry. This in turn aids the marketers/investors in knowing certain perceptions of the customers. Qualitative research can enlighten about the different product concepts and designs along with unique service offering that in turn, helps define marketing problems and generate opportunities. On the other hand, quantitative research engages with the data collection process through interviews, e-mail interactions, surveys and pilot studies. Quantitative aspects for the market research are useful to validate the hypotheses generated during qualitative research method, explore empirical patterns in the data with the help of statistical tools, and finally make the market estimations.
The Brainy Insights offers comprehensive research and analysis, based on a wide assortment of factual insights gained through interviews with CXOs and global experts and secondary data from reliable sources. Our analysts and industry specialist assume vital roles in building up statistical tools and analysis models, which are used to analyse the data and arrive at accurate insights with exceedingly informative research discoveries. The data provided by our organization have proven precious to a diverse range of companies, facilitating them to address issues such as determining which products/services are the most appealing, whether or not customers use the product in the manner anticipated, the purchasing intentions of the market and many others.
Our research methodology encompasses an idyllic combination of primary and secondary initiatives. Key phases involved in this process are listed below:

The phase involves the gathering and collecting of market data and its related information with the help of different sources & research procedures.

The data procurement stage involves in data gathering and collecting through various data sources.
This stage involves in extensive research. These data sources includes:
Purchased Database: Purchased databases play a crucial role in estimating the market sizes irrespective of the domain. Our purchased database includes:
Primary Research: The Brainy Insights interacts with leading companies and experts of the concerned domain to develop the analyst team’s market understanding and expertise. It improves and substantiates every single data presented in the market reports. Primary research mainly involves in telephonic interviews, E-mail interactions and face-to-face interviews with the raw material providers, manufacturers/producers, distributors, & independent consultants. The interviews that we conduct provides valuable data on market size and industry growth trends prevailing in the market. Our organization also conducts surveys with the various industry experts in order to gain overall insights of the industry/market. For instance, in healthcare industry we conduct surveys with the pharmacists, doctors, surgeons and nurses in order to gain insights and key information of a medical product/device/equipment which the customers are going to usage. Surveys are conducted in the form of questionnaire designed by our own analyst team. Surveys plays an important role in primary research because surveys helps us to identify the key target audiences of the market. Additionally, surveys helps to identify the key target audience engaged with the market. Our survey team conducts the survey by targeting the key audience, thus gaining insights from them. Based on the perspectives of the customers, this information is utilized to formulate market strategies. Moreover, market surveys helps us to understand the current competitive situation of the industry. To be precise, our survey process typically involve with the 360 analysis of the market. This analytical process begins by identifying the prospective customers for a product or service related to the market/industry to obtain data on how a product/service could fit into customers’ lives.

Secondary Research: The secondary data sources includes information published by the on-profit organizations such as World bank, WHO, company fillings, investor presentations, annual reports, national government documents, statistical databases, blogs, articles, white papers and others. From the annual report, we analyse a company’s revenue to understand the key segment and market share of that organization in a particular region. We analyse the company websites and adopt the product mapping technique which is important for deriving the segment revenue. In the product mapping method, we select and categorize the products offered by the companies catering to domain specific market, deduce the product revenue for each of the companies so as to get overall estimation of the market size. We also source data and analyses trends based on information received from supply side and demand side intermediaries in the value chain. The supply side denotes the data gathered from supplier, distributor, wholesaler and the demand side illustrates the data gathered from the end customers for respective market domain.

The supply side for a domain specific market is analysed by:
The demand side for the market is estimated through:
In-house Library: Apart from these third-party sources, we have our in-house library of qualitative and quantitative information. Our in-house database includes market data for various industry and domains. These data are updated on regular basis as per the changing market scenario. Our library includes, historic databases, internal audit reports and archives.
Sometimes there are instances where there is no metadata or raw data available for any domain specific market. For those cases, we use our expertise to forecast and estimate the market size in order to generate comprehensive data sets. Our analyst team adopt a robust research technique in order to produce the estimates:
Data Synthesis: This stage involves the analysis & mapping of all the information obtained from the previous step. It also involves in scrutinizing the data for any discrepancy observed while data gathering related to the market. The data is collected with consideration to the heterogeneity of sources. Robust scientific techniques are in place for synthesizing disparate data sets and provide the essential contextual information that can orient market strategies. The Brainy Insights has extensive experience in data synthesis where the data passes through various stages:


Market Deduction & Formulation: The final stage comprises of assigning data points at appropriate market spaces so as to deduce feasible conclusions. Analyst perspective & subject matter expert based holistic form of market sizing coupled with industry analysis also plays a crucial role in this stage.
This stage involves in finalization of the market size and numbers that we have collected from data integration step. With data interpolation, it is made sure that there is no gap in the market data. Successful trend analysis is done by our analysts using extrapolation techniques, which provide the best possible forecasts for the market.
Data Validation & Market Feedback: Validation is the most important step in the process. Validation & re-validation via an intricately designed process helps us finalize data-points to be used for final calculations.

The Brainy Insights interacts with leading companies and experts of the concerned domain to develop the analyst team’s market understanding and expertise. It improves and substantiates every single data presented in the market reports. The data validation interview and discussion panels are typically composed of the most experienced industry members. The participants include, however, are not limited to:
Moreover, we always validate our data and findings through primary respondents from all the major regions we are working on.


Free Customization
Fortune 500 Clients
Free Yearly Update On Purchase Of Multi/Corporate License
Companies Served Till Date