- +1-315-215-1633
- sales@thebrainyinsights.com

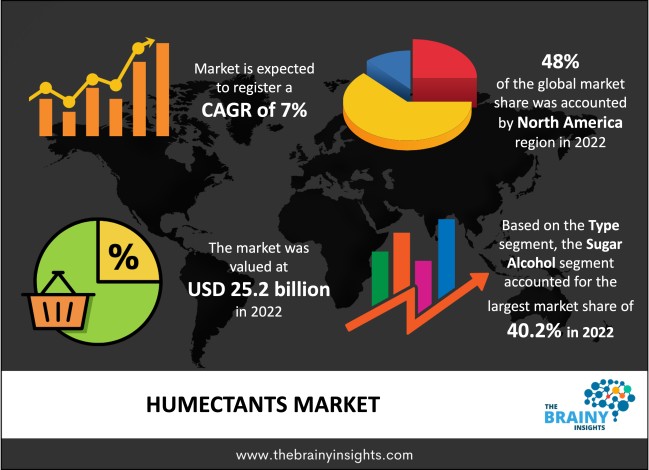
The global humectants market is expected to reach USD 49.5 billion by 2032, at a CAGR of 7% during the forecast period 2023 to 2032. Asia Pacific is expected to grow the fastest during the forecast period.
Humectants are hygroscopic organic substances that create hydrogen bonds with water molecules. They can be generated from natural sources such as aloe vera gel, glycerin, honey, and lactic acid. They help to collect moisture from the air and maintain it in the stratum corneum, the skin's upper layer. They are extensively used in the production of beauty and personal care products because they help to make the skin smooth, moisturized, supple, less flaky, and prone to cracking or chaffing. One of the essential drivers driving the market is an increase in the consumption of health supplements, functional beverages, bakery products, and confectionery products as people's spending power grows worldwide. Humectants aid in product stability, microbiological activity reduction, texture preservation, and shelf life extension. As a result, they are widely used in making shampoos, soaps, and conditioners worldwide. Aside from that, the increasing use of humectants in medication development to regulate the water content of pharmaceutical dosage and constituent solubility is fueling market expansion.
Get an overview of this study by requesting a free sample
Rising Usage of Humectants- The growing demand for humectants from the food & beverage and cosmetic industries is the primary driver of the humectants market. Humectants are commonly used to replenish the water content of items. The growing use of humectants in various medication development and medicines to regulate the water content of pharmaceutical dosage and the solubility of substances is propelling the growth of the humectants market. Furthermore, humectants are widely utilized in water-soluble paints. The rising use of humectants for extending the shelf life of cosmetics and other items is propelling the humectants market forward.
High Cost of Extraction- The availability of natural humectants, the high costs involved with the extraction and production of natural ingredients, and detrimental health impacts are anticipated to hinder the expansion of the humectants market.
Rise of Food Humectants- The rising usage of food humectants in the manufacturing of several food products around the globe is likely to drive the growth of the global food humectants market during the forecast period. Another factor predicted to assist the target market's growth throughout the forecast period is the rising usage of humectants as a food additive due to several benefits of food humectants, such as improved moisture content and tastes, cost-effectiveness, higher nutritional value, and convenience of use.
Fluctuation in Prices- Price changes in raw materials generated from petroleum are expected to limit the expansion of the humectants market.
The regions analyzed for the market include North America, Europe, South America, Asia Pacific, the Middle East, and Africa. North America emerged as the most significant global humectants market, with a 48% market revenue share in 2022.
North America dominates the humectants market with a 48% market revenue share in 2022. This can be ascribed to the health benefits of these items and the expansion of the region's beauty and pharmaceutical industries. In addition, the growing demand for ready-to-eat food in North America is a significant driver for humectants in the food and beverage industry. Humectants in cosmetics and personal care products can retain moisture, which can help maintain skin hydration and avoid dryness. Several health claims about humectants have been approved by the FDA, including the important fact that they can help treat eczema and psoriasis.
Asia Pacific is expected to witness the fastest growth during the forecast period. Increased demand for functional and nutritional food products, as well as changing lifestyles of consumers adopting a healthy lifestyle, rising disposable income and increased demand for functional and nutritional food support market growth, particularly in China and India. India is the region's fastest-growing market. Diabetes and obesity are commonly related to poor dietary habits in India. Sugar consumers' awareness of the health hazards associated with sugar has fuelled the emergence of low- or zero-calorie goods made using polyols such as sorbitol, maltitol, mannitol, and xylitol.
North America Region Humectants Market Share in 2022 - 48%
www.thebrainyinsights.com
Check the geographical analysis of this market by requesting a free sample
The type segment is divided into sugar alcohol, glycerol, phosphate, glycol, lactate, and others. The sugar alcohol segment dominated the market, with a market share of around 40.2% in 2022. The rising demand for sugar alcohol among people with diabetes will drive rapid revenue growth during the forecast period. People's growing health concern has increased demand for sugar alcohols for critical applications such as weight loss. Furthermore, sugar alcohols are commonly employed in the food business as sweeteners and thickeners. Consumers prefer sugar alcohol to lower carbohydrate intake and manage the glycemic index.
The application segment is divided into bakery & confectionery, beverages, functional & nutritional foods, ready-to-eat food, dairy products, and others. The ready-to-eat food segment dominated the market, with a market share of around 38.9% in 2022. They are easy to prepare, may be taken without cooking, and offer enormous convenience to users. Because humectants retain the moisture content of the product, ready-to-eat foods continue to be the primary use for food humectants.
The source segment is divided into natural and synthetic. The natural segment dominated the market, with a market share of around 61.0% in 2022. Natural humectants, such as hyaluronic acid, aloe Vera, seaweed, honey, and others, are often used in moisturizers to stimulate skin restoration. Natural humectants also include anti-acne and anti-inflammatory characteristics that aid healing.
| Attribute | Description |
|---|---|
| Market Size | Revenue (USD Billion) |
| Market size value in 2022 | USD 25.2 billion |
| Market size value in 2032 | USD 49.5 billion |
| CAGR (2023 to 2032) | 7% |
| Historical data | 2019-2021 |
| Base Year | 2022 |
| Forecast | 2023-2032 |
| Regional Segments | North America, Asia Pacific, Europe, Latin America, Middle East and Africa |
| Segments | Type, Application, Source |
As per The Brainy Insights, the size of the humectants market was valued at USD 25.2 billion in 2022 to USD 49.5 billion by 2032.
The global humectants market is growing at a CAGR of 7% during the forecast period 2023-2032.
North America emerged as the largest humectants market.
1. Introduction
1.1. Objectives of the Study
1.2. Market Definition
1.3. Research Scope
1.4. Currency
1.5. Key Target Audience
2. Research Methodology and Assumptions
3. Executive Summary
4. Premium Insights
4.1. Porter’s Five Forces Analysis
4.2. Value Chain Analysis
4.3. Top Investment Pockets
4.3.1. Market Attractiveness Analysis by Type
4.3.2. Market Attractiveness Analysis by Application
4.3.3. Market Attractiveness Analysis by Source
4.3.4. Market Attractiveness Analysis by Region
4.4. Industry Trends
5. Market Dynamics
5.1. Market Evaluation
5.2. Drivers
5.2.1. Rising Usage of Humectants
5.3. Restraints
5.3.1. High Cost of Extraction
5.4. Opportunities
5.4.1. Rise of Food Humectants
5.5. Challenges
5.5.1. Fluctuation in Prices
6. Global Humectants Market Analysis and Forecast, By Type
6.1. Segment Overview
6.2. Sugar Alcohol
6.3. Glycerol
6.4. Phosphate
6.5. Glycol
6.6. Lactate
6.7. Others
7. Global Humectants Market Analysis and Forecast, By Application
7.1. Segment Overview
7.2. Bakery & Confectionery
7.3. Beverages
7.4. Functional & Nutritional Foods
7.5. Ready-To-Eat Foods
7.6. Dairy Products
7.7. Others
8. Global Humectants Market Analysis and Forecast, By Source
8.1. Segment Overview
8.2. Natural
8.3. Synthetic
9. Global Humectants Market Analysis and Forecast, By Regional Analysis
9.1. Segment Overview
9.2. North America
9.2.1. U.S.
9.2.2. Canada
9.2.3. Mexico
9.3. Europe
9.3.1. Germany
9.3.2. France
9.3.3. U.K.
9.3.4. Italy
9.3.5. Spain
9.4. Asia-Pacific
9.4.1. Japan
9.4.2. China
9.4.3. India
9.5. South America
9.5.1. Brazil
9.6. Middle East and Africa
9.6.1. UAE
9.6.2. South Africa
10. Global Humectants Market-Competitive Landscape
10.1. Overview
10.2. Market Share of Key Players in Global Humectants Market
10.2.1. Global Company Market Share
10.2.2. North America Company Market Share
10.2.3. Europe Company Market Share
10.2.4. APAC Company Market Share
10.3. Competitive Situations and Trends
10.3.1. Product Launches and Developments
10.3.2. Partnerships, Collaborations, and Agreements
10.3.3. Mergers & Acquisitions
10.3.4. Expansions
11. Company Profiles
11.1. Archer Daniel Midland Company
11.1.1. Business Overview
11.1.2. Company Snapshot
11.1.3. Company Market Share Analysis
11.1.4. Company Product Portfolio
11.1.5. Recent Developments
11.1.6. SWOT Analysis
11.2. Barentz
11.2.1. Business Overview
11.2.2. Company Snapshot
11.2.3. Company Market Share Analysis
11.2.4. Company Product Portfolio
11.2.5. Recent Developments
11.2.6. SWOT Analysis
11.3. Ashland Global Holdings Inc.
11.3.1. Business Overview
11.3.2. Company Snapshot
11.3.3. Company Market Share Analysis
11.3.4. Company Product Portfolio
11.3.5. Recent Developments
11.3.6. SWOT Analysis
11.4. BASF SE
11.4.1. Business Overview
11.4.2. Company Snapshot
11.4.3. Company Market Share Analysis
11.4.4. Company Product Portfolio
11.4.5. Recent Developments
11.4.6. SWOT Analysis
11.5. Cargill Incorporated
11.5.1. Business Overview
11.5.2. Company Snapshot
11.5.3. Company Market Share Analysis
11.5.4. Company Product Portfolio
11.5.5. Recent Developments
11.5.6. SWOT Analysis
11.6. Brenntag AG
11.6.1. Business Overview
11.6.2. Company Snapshot
11.6.3. Company Market Share Analysis
11.6.4. Company Product Portfolio
11.6.5. Recent Developments
11.6.6. SWOT Analysis
11.7. Roquette Freres
11.7.1. Business Overview
11.7.2. Company Snapshot
11.7.3. Company Market Share Analysis
11.7.4. Company Product Portfolio
11.7.5. Recent Developments
11.7.6. SWOT Analysis
11.8. E.I. Du Pont De Nemours and Company
11.8.1. Business Overview
11.8.2. Company Snapshot
11.8.3. Company Market Share Analysis
11.8.4. Company Product Portfolio
11.8.5. Recent Developments
11.8.6. SWOT Analysis
11.9. Ingredion
11.9.1. Business Overview
11.9.2. Company Snapshot
11.9.3. Company Market Share Analysis
11.9.4. Company Product Portfolio
11.9.5. Recent Developments
11.9.6. SWOT Analysis
11.10. The DOW Chemical Company
11.10.1. Business Overview
11.10.2. Company Snapshot
11.10.3. Company Market Share Analysis
11.10.4. Company Product Portfolio
11.10.5. Recent Developments
11.10.6. SWOT Analysis
List of Table
1. Global Humectants Market, By Type, 2019-2032 (USD Billion)
2. Global Sugar Alcohol, Humectants Market, By Region, 2019-2032 (USD Billion)
3. Global Glycerol, Humectants Market, By Region, 2019-2032 (USD Billion)
4. Global Phosphate, Humectants Market, By Region, 2019-2032 (USD Billion)
5. Global Glycol, Humectants Market, By Region, 2019-2032 (USD Billion)
6. Global Lactate, Humectants Market, By Region, 2019-2032 (USD Billion)
7. Global Others, Humectants Market, By Region, 2019-2032 (USD Billion)
8. Global Humectants Market, By Application, 2019-2032 (USD Billion)
9. Global Bakery & Confectionery, Humectants Market, By Region, 2019-2032 (USD Billion)
10. Global Beverages, Humectants Market, By Region, 2019-2032 (USD Billion)
11. Global Functional & Nutritional Foods, Humectants Market, By Region, 2019-2032 (USD Billion)
12. Global Ready-To-Eat Foods, Humectants Market, By Region, 2019-2032 (USD Billion)
13. Global Dairy Products, Humectants Market, By Region, 2019-2032 (USD Billion)
14. Global Others, Humectants Market, By Region, 2019-2032 (USD Billion)
15. Global Humectants Market, By Source, 2019-2032 (USD Billion)
16. Global Natural, Humectants Market, By Region, 2019-2032 (USD Billion)
17. Global Synthetic, Humectants Market, By Region, 2019-2032 (USD Billion)
18. North America Humectants Market, By Type, 2019-2032 (USD Billion)
19. North America Humectants Market, By Application, 2019-2032 (USD Billion)
20. North America Humectants Market, By Source, 2019-2032 (USD Billion)
21. U.S. Humectants Market, By Type, 2019-2032 (USD Billion)
22. U.S. Humectants Market, By Application, 2019-2032 (USD Billion)
23. U.S. Humectants Market, By Source, 2019-2032 (USD Billion)
24. Canada Humectants Market, By Type, 2019-2032 (USD Billion)
25. Canada Humectants Market, By Application, 2019-2032 (USD Billion)
26. Canada Humectants Market, By Source, 2019-2032 (USD Billion)
27. Mexico Humectants Market, By Type, 2019-2032 (USD Billion)
28. Mexico Humectants Market, By Application, 2019-2032 (USD Billion)
29. Mexico Humectants Market, By Source, 2019-2032 (USD Billion)
30. Europe Humectants Market, By Type, 2019-2032 (USD Billion)
31. Europe Humectants Market, By Application, 2019-2032 (USD Billion)
32. Europe Humectants Market, By Source, 2019-2032 (USD Billion)
33. Germany Humectants Market, By Type, 2019-2032 (USD Billion)
34. Germany Humectants Market, By Application, 2019-2032 (USD Billion)
35. Germany Humectants Market, By Source, 2019-2032 (USD Billion)
36. France Humectants Market, By Type, 2019-2032 (USD Billion)
37. France Humectants Market, By Application, 2019-2032 (USD Billion)
38. France Humectants Market, By Source, 2019-2032 (USD Billion)
39. U.K. Humectants Market, By Type, 2019-2032 (USD Billion)
40. U.K. Humectants Market, By Application, 2019-2032 (USD Billion)
41. U.K. Humectants Market, By Source, 2019-2032 (USD Billion)
42. Italy Humectants Market, By Type, 2019-2032 (USD Billion)
43. Italy Humectants Market, By Application, 2019-2032 (USD Billion)
44. Italy Humectants Market, By Source, 2019-2032 (USD Billion)
45. Spain Humectants Market, By Type, 2019-2032 (USD Billion)
46. Spain Humectants Market, By Application, 2019-2032 (USD Billion)
47. Spain Humectants Market, By Source, 2019-2032 (USD Billion)
48. Asia Pacific Humectants Market, By Type, 2019-2032 (USD Billion)
49. Asia Pacific Humectants Market, By Application, 2019-2032 (USD Billion)
50. Asia Pacific Humectants Market, By Source, 2019-2032 (USD Billion)
51. Japan Humectants Market, By Type, 2019-2032 (USD Billion)
52. Japan Humectants Market, By Application, 2019-2032 (USD Billion)
53. Japan Humectants Market, By Source, 2019-2032 (USD Billion)
54. China Humectants Market, By Type, 2019-2032 (USD Billion)
55. China Humectants Market, By Application, 2019-2032 (USD Billion)
56. China Humectants Market, By Source, 2019-2032 (USD Billion)
57. India Humectants Market, By Type, 2019-2032 (USD Billion)
58. India Humectants Market, By Application, 2019-2032 (USD Billion)
59. India Humectants Market, By Source, 2019-2032 (USD Billion)
60. South America Humectants Market, By Type, 2019-2032 (USD Billion)
61. South America Humectants Market, By Application, 2019-2032 (USD Billion)
62. South America Humectants Market, By Source, 2019-2032 (USD Billion)
63. Brazil Humectants Market, By Type, 2019-2032 (USD Billion)
64. Brazil Humectants Market, By Application, 2019-2032 (USD Billion)
65. Brazil Humectants Market, By Source, 2019-2032 (USD Billion)
66. Middle East and Africa Humectants Market, By Type, 2019-2032 (USD Billion)
67. Middle East and Africa Humectants Market, By Application, 2019-2032 (USD Billion)
68. Middle East and Africa Humectants Market, By Source, 2019-2032 (USD Billion)
69. UAE Humectants Market, By Type, 2019-2032 (USD Billion)
70. UAE Humectants Market, By Application, 2019-2032 (USD Billion)
71. UAE Humectants Market, By Source, 2019-2032 (USD Billion)
72. South Africa Humectants Market, By Type, 2019-2032 (USD Billion)
73. South Africa Humectants Market, By Application, 2019-2032 (USD Billion)
74. South Africa Humectants Market, By Source, 2019-2032 (USD Billion)
List of Figures
1. Global Humectants Market Segmentation
2. Global Humectants Market: Research Methodology
3. Market Size Estimation Methodology: Bottom-Up Approach
4. Market Size Estimation Methodology: Top-Down Approach
5. Data Triangulation
6. Porter’s Five Forces Analysis
7. Value Chain Analysis
8. Global Humectants Market Attractiveness Analysis by Type
9. Global Humectants Market Attractiveness Analysis by Application
10. Global Humectants Market Attractiveness Analysis by Source
11. Global Humectants Market Attractiveness Analysis by Region
12. Global Humectants Market: Dynamics
13. Global Humectants Market Share by Type (2023 & 2032)
14. Global Humectants Market Share by Application (2023 & 2032)
15. Global Humectants Market Share by Source (2023 & 2032)
16. Global Humectants Market Share by Regions (2023 & 2032)
17. Global Humectants Market Share by Company (2022)
This study forecasts global, regional, and country revenue from 2019 to 2032. The Brainy Insights has segmented the global humectants market based on the below-mentioned segments:
Global Humectants Market By Type:
Global Humectants Market By Application:
Global Humectants Market By Source:
Global Humectants Market By Region:
Research has its special purpose to undertake marketing efficiently. In this competitive scenario, businesses need information across all industry verticals; the information about customer wants, market demand, competition, industry trends, distribution channels etc. This information needs to be updated regularly because businesses operate in a dynamic environment. Our organization, The Brainy Insights incorporates scientific and systematic research procedures in order to get proper market insights and industry analysis for overall business success. The analysis consists of studying the market from a miniscule level wherein we implement statistical tools which helps us in examining the data with accuracy and precision.
Our research reports feature both; quantitative and qualitative aspects for any market. Qualitative information for any market research process are fundamental because they reveal the customer needs and wants, usage and consumption for any product/service related to a specific industry. This in turn aids the marketers/investors in knowing certain perceptions of the customers. Qualitative research can enlighten about the different product concepts and designs along with unique service offering that in turn, helps define marketing problems and generate opportunities. On the other hand, quantitative research engages with the data collection process through interviews, e-mail interactions, surveys and pilot studies. Quantitative aspects for the market research are useful to validate the hypotheses generated during qualitative research method, explore empirical patterns in the data with the help of statistical tools, and finally make the market estimations.
The Brainy Insights offers comprehensive research and analysis, based on a wide assortment of factual insights gained through interviews with CXOs and global experts and secondary data from reliable sources. Our analysts and industry specialist assume vital roles in building up statistical tools and analysis models, which are used to analyse the data and arrive at accurate insights with exceedingly informative research discoveries. The data provided by our organization have proven precious to a diverse range of companies, facilitating them to address issues such as determining which products/services are the most appealing, whether or not customers use the product in the manner anticipated, the purchasing intentions of the market and many others.
Our research methodology encompasses an idyllic combination of primary and secondary initiatives. Key phases involved in this process are listed below:

The phase involves the gathering and collecting of market data and its related information with the help of different sources & research procedures.

The data procurement stage involves in data gathering and collecting through various data sources.
This stage involves in extensive research. These data sources includes:
Purchased Database: Purchased databases play a crucial role in estimating the market sizes irrespective of the domain. Our purchased database includes:
Primary Research: The Brainy Insights interacts with leading companies and experts of the concerned domain to develop the analyst team’s market understanding and expertise. It improves and substantiates every single data presented in the market reports. Primary research mainly involves in telephonic interviews, E-mail interactions and face-to-face interviews with the raw material providers, manufacturers/producers, distributors, & independent consultants. The interviews that we conduct provides valuable data on market size and industry growth trends prevailing in the market. Our organization also conducts surveys with the various industry experts in order to gain overall insights of the industry/market. For instance, in healthcare industry we conduct surveys with the pharmacists, doctors, surgeons and nurses in order to gain insights and key information of a medical product/device/equipment which the customers are going to usage. Surveys are conducted in the form of questionnaire designed by our own analyst team. Surveys plays an important role in primary research because surveys helps us to identify the key target audiences of the market. Additionally, surveys helps to identify the key target audience engaged with the market. Our survey team conducts the survey by targeting the key audience, thus gaining insights from them. Based on the perspectives of the customers, this information is utilized to formulate market strategies. Moreover, market surveys helps us to understand the current competitive situation of the industry. To be precise, our survey process typically involve with the 360 analysis of the market. This analytical process begins by identifying the prospective customers for a product or service related to the market/industry to obtain data on how a product/service could fit into customers’ lives.

Secondary Research: The secondary data sources includes information published by the on-profit organizations such as World bank, WHO, company fillings, investor presentations, annual reports, national government documents, statistical databases, blogs, articles, white papers and others. From the annual report, we analyse a company’s revenue to understand the key segment and market share of that organization in a particular region. We analyse the company websites and adopt the product mapping technique which is important for deriving the segment revenue. In the product mapping method, we select and categorize the products offered by the companies catering to domain specific market, deduce the product revenue for each of the companies so as to get overall estimation of the market size. We also source data and analyses trends based on information received from supply side and demand side intermediaries in the value chain. The supply side denotes the data gathered from supplier, distributor, wholesaler and the demand side illustrates the data gathered from the end customers for respective market domain.

The supply side for a domain specific market is analysed by:
The demand side for the market is estimated through:
In-house Library: Apart from these third-party sources, we have our in-house library of qualitative and quantitative information. Our in-house database includes market data for various industry and domains. These data are updated on regular basis as per the changing market scenario. Our library includes, historic databases, internal audit reports and archives.
Sometimes there are instances where there is no metadata or raw data available for any domain specific market. For those cases, we use our expertise to forecast and estimate the market size in order to generate comprehensive data sets. Our analyst team adopt a robust research technique in order to produce the estimates:
Data Synthesis: This stage involves the analysis & mapping of all the information obtained from the previous step. It also involves in scrutinizing the data for any discrepancy observed while data gathering related to the market. The data is collected with consideration to the heterogeneity of sources. Robust scientific techniques are in place for synthesizing disparate data sets and provide the essential contextual information that can orient market strategies. The Brainy Insights has extensive experience in data synthesis where the data passes through various stages:


Market Deduction & Formulation: The final stage comprises of assigning data points at appropriate market spaces so as to deduce feasible conclusions. Analyst perspective & subject matter expert based holistic form of market sizing coupled with industry analysis also plays a crucial role in this stage.
This stage involves in finalization of the market size and numbers that we have collected from data integration step. With data interpolation, it is made sure that there is no gap in the market data. Successful trend analysis is done by our analysts using extrapolation techniques, which provide the best possible forecasts for the market.
Data Validation & Market Feedback: Validation is the most important step in the process. Validation & re-validation via an intricately designed process helps us finalize data-points to be used for final calculations.

The Brainy Insights interacts with leading companies and experts of the concerned domain to develop the analyst team’s market understanding and expertise. It improves and substantiates every single data presented in the market reports. The data validation interview and discussion panels are typically composed of the most experienced industry members. The participants include, however, are not limited to:
Moreover, we always validate our data and findings through primary respondents from all the major regions we are working on.


Free Customization
Fortune 500 Clients
Free Yearly Update On Purchase Of Multi/Corporate License
Companies Served Till Date