- +1-315-215-1633
- sales@thebrainyinsights.com

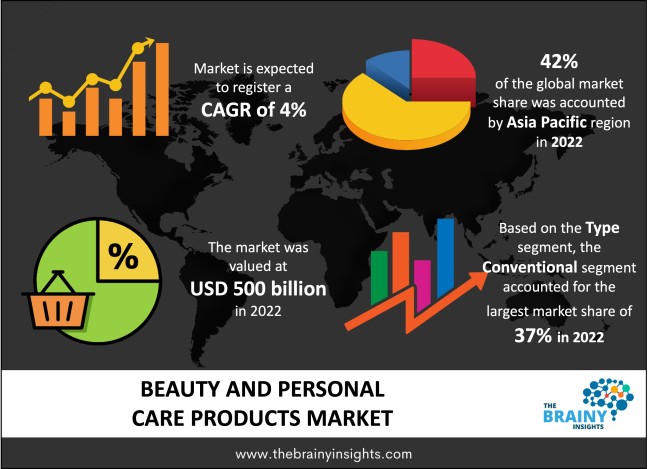
The global beauty and personal care products market was valued at USD 500 billion in 2022 and grew at a CAGR of 4% from 2023 to 2032. The market is expected to reach USD 740.12 billion by 2032. The growing emphasis on personal grooming with the rising social media influence will drive the growth of the global beauty and personal care products market.
Personal care includes maintaining skin, hair, and other bodily traits. Among many other things, it involves washing, shaving, waxing, brushing, moisturizing, exfoliating, and putting on makeup or coloured cosmetics. All of these activities aid people in improving their physical appearance, increasing self-esteem, confidence, and general improvement in mental and physical health. Products for beauty and personal care help people accomplish these objectives. They produce a variety of goods that are suitable for both men and women, including body washes, shampoos, conditioners, lipsticks, highlighters, and other colour cosmetics, in addition to face washes, cleansers, serums, toners, oils, and moisturizers. Given the expanding influence of social media and the increased emphasis on personal hygiene and appearance in the digital age, there is a higher demand for cosmetics and personal care items. The growing social media community of content producers, fashion influencers, and beauty bloggers has favourably impacted the personal care and beauty products market. Men's interest in new fashion trends has increased, which has helped to broaden the market for these products. The market is also being driven by consumers' increasing knowledge of these items, their advantages, and how to select goods that meet their needs.
Get an overview of this study by requesting a free sample
The growing emphasis on personal grooming – The age of social media has increased the importance of outer physical appearance in the modern world. Physical appearance is also important in real life besides social media. A well-groomed individual is appreciated and well-received in modern society. The young population is more inclined towards their physical appearance, fashion, beauty and life aesthetics. The growing emphasis on physical appearance, expanding social media, increasing disposable income and awareness about personal grooming has increased the demand for beauty and personal care products. The vast number of resources available on the internet has enabled individuals to understand their outer appearance and identify methods and products to improve it. The presence of a significant number of market players offering a wide variety of products combined with their growing sales and marketing advertisements is driving the demand for beauty and personal care products. The accessible network of retail chains or online sales channels also augments the market's growth. Therefore, the growing emphasis on personal grooming will drive the global beauty and personal care products market's growth.
The availability of cheap counterfeit goods – The growing presence of cheap counterfeit consumer goods of international brands in several economies, especially the developing and underdeveloped, hamper the market's growth. These products are low quality, cheaper and inconsistent, which can damage the user. They also damage brand reputation as consumers are often unaware of the authenticity of the products they are buying. In the age of social media, this can severely damage legitimate businesses. Therefore, the problem of counterfeit products will limit the market's growth.
The introduction of natural and organic products – The younger population is more climate-conscious, aware and responsible consumer buyers. They demand vegan, cruelty-free, organic and natural products that are produced sustainability and do not damage their health or the environment. The buyer consciousness about beauty and personal care products, their ingredients, manufacturing process and other nuances has led to the introduction of organic and natural products. These products support the local farming economy, reduce waste, and are eco-friendly and highly effective for skincare, haircare and beauty. The increasing demand for organic and natural products has also led to an increasing number of home-grown brands that drive employment, are more customer-centric and contribute positively to the economy. The customized, localized and sustainable approach has encouraged big international players to invest heavily in similar products, thereby driving the market's growth.
The regions analyzed for the market include North America, Europe, South America, Asia Pacific, the Middle East, and Africa. Asia Pacific emerged as the most significant global beauty and personal care products market, with a 42% market revenue share in 2022.
The consumer demand in the region is driven by the population of India and China, with a rising disposable income and a growing willingness to spend on skincare. Beauty and makeup trends influence the high number of social media users, thereby driving the regional market's growth. The growing presence of local brands offering localized, customized and effective products will drive the market's growth. The extensive and well-networked chain of retailers offers accessible distribution channels for the producers and consumers to drive the market's development. The introduction of organic and natural skincare products based on the local flora and Asian heritage is also garnering popularity in the market.
Asia Pacific Region Beauty and Personal Care Products Market Share in 2022 - 42%
www.thebrainyinsights.com
Check the geographical analysis of this market by requesting a free sample
The type segment is divided into conventional and organic. The conventional segment dominated the market, with a share of around 37% in 2022. Conventional beauty and personal care products are synthetic and mix different chemicals. These products are generally cheaper compared to organic or natural skincare products. They offer better short-term results and quicker effects than their counterparts. They are available at nearby drug stores, supermarkets, hypermarkets, and other retailers. Multiple brands offer a wide variety of products in the market, providing choice, accessibility and affordability to consumers. New products with different variations are introduced regularly in the market, as these products are easy to manufacture given the easy procurement of raw material, processing, extended shelf-life etc.
The product type segment is divided into skincare, colour cosmetics, haircare, fragrances, and others. The skincare segment dominated the market, with a market share of around 38% in 2022. The face is the most prominent part of one's physical appearance and plays an important role in boosting self-confidence and self-esteem. Given the growing influence of social media and its fashion, beauty and lifestyle influencers, the rising awareness about skincare is driving the segment's growth. The increasing emphasis on skincare, especially UV protection or sunblock gas, garnered pace in the recent past, given the growing social media influence and marketing campaigns of skincare producers. Similarly, the growing fad over active ingredients like vitamin C, salicylic acid, and retinol has increased its demand in the market, thereby driving the segment's growth. The presence of a significantly large number of international and local players with access to an extensive distribution network of offline and online retailers will bode well for the segment's growth. The introduction of customized skincare will also augment the market's growth.
The distribution channel segment is divided into e-commerce, departmental stores, convenience stores, supermarkets/hypermarkets, specialty stores, retail stores and others. The specialty stores segment dominated the market, with a market share of around 33% in 2022. Specialty stores deal in a narrow variety of goods but offer various choices. Speciality stores offer beauty and personal care products of all brands, types, sizes, volumes, and flavours. Sections are dedicated to different brands within the dedicated product aisles. There are professionals at every corner to assist the customer, answer their queries, and suggest products according to their needs and requirements. Consumers can try beauty and personal care products in the store at a dedicated counter for trials. Furthermore, the new technology has enabled digital counters that allow consumers to see what colour cosmetics suit them through a user interface at the store.
| Attribute | Description |
|---|---|
| Market Size | Revenue (USD Billion) |
| Market size value in 2022 | USD 500 Billion |
| Market size value in 2032 | USD 740.12 Billion |
| CAGR (2023 to 2032) | 4% |
| Historical data | 2019-2021 |
| Base Year | 2022 |
| Forecast | 2023-2032 |
| Region | The regions analyzed for the market are Asia Pacific, Europe, South America, North America, and Middle East & Africa. Furthermore, the regions are further analyzed at the country level. |
| Segments | Type, Product Type and Distribution Channel |
As per The Brainy Insights, the size of the global beauty and personal care products market was valued at USD 500 billion in 2022 to USD 740.12 billion by 2032.
Global beauty and personal care products market is growing at a CAGR of 4% during the forecast period 2023-2032.
The market's growth will be influenced by the growing emphasis on personal grooming.
The availability of cheap counterfeit goods could hamper the market growth.
1. Introduction
1.1. Objectives of the Study
1.2. Market Definition
1.3. Research Scope
1.4. Currency
1.5. Key Target Audience
2. Research Methodology and Assumptions
3. Executive Summary
4. Premium Insights
4.1. Porter’s Five Forces Analysis
4.2. Value Chain Analysis
4.3. Top Investment Pockets
4.3.1. Market Attractiveness Analysis by Type
4.3.2. Market Attractiveness Analysis by Product Type
4.3.3. Market Attractiveness Analysis by Distribution Channel
4.3.4. Market Attractiveness Analysis by Region
4.4. Industry Trends
5. Market Dynamics
5.1. Market Evaluation
5.2. Drivers
5.2.1. The growing emphasis on personal grooming
5.3. Restraints
5.3.1. The availability of cheap counterfeit goods
5.4. Opportunities
5.4.1. The introduction of natural and organic products
5.5. Challenges
5.5.1. Misleading claims that are damaging to consumers
6. Global Beauty and Personal Care Products Market Analysis and Forecast, By Type
6.1. Segment Overview
6.2. Conventional
6.3. Organic
7. Global Beauty and Personal Care Products Market Analysis and Forecast, By Product Type
7.1. Segment Overview
7.2. Skincare
7.3. Colour Cosmetics
7.4. Haircare
7.5. Fragrances
7.6. Others
8. Global Beauty and Personal Care Products Market Analysis and Forecast, By Distribution Channel
8.1. Segment Overview
8.2. Ecommerce
8.3. Departmental Stores
8.4. Convenience Stores
8.5. Supermarkets/Hypermarkets
8.6. Specialty Stores
8.7. Retail Stores
8.8. Others
9. Global Beauty and Personal Care Products Market Analysis and Forecast, By Regional Analysis
9.1. Segment Overview
9.2. North America
9.2.1. U.S.
9.2.2. Canada
9.2.3. Mexico
9.3. Europe
9.3.1. Germany
9.3.2. France
9.3.3. U.K.
9.3.4. Italy
9.3.5. Spain
9.4. Asia-Pacific
9.4.1. Japan
9.4.2. China
9.4.3. India
9.5. South America
9.5.1. Brazil
9.6. Middle East and Africa
9.6.1. UAE
9.6.2. South Africa
10. Global Beauty and Personal Care Products Market-Competitive Landscape
10.1. Overview
10.2. Market Share of Key Players in the Beauty and Personal Care Products Market
10.2.1. Global Company Market Share
10.2.2. North America Company Market Share
10.2.3. Europe Company Market Share
10.2.4. APAC Company Market Share
10.3. Competitive Situations and Trends
10.3.1. Product Launches and Developments
10.3.2. Partnerships, Collaborations, and Agreements
10.3.3. Mergers & Acquisitions
10.3.4. Expansions
11. Company Profiles
11.1. AVON Products, Inc
11.1.1. Business Overview
11.1.2. Company Snapshot
11.1.3. Company Market Share Analysis
11.1.4. Company Product Portfolio
11.1.5. Recent Developments
11.1.6. SWOT Analysis
11.2. Johnson & Johnson
11.2.1. Business Overview
11.2.2. Company Snapshot
11.2.3. Company Market Share Analysis
11.2.4. Company Product Portfolio
11.2.5. Recent Developments
11.2.6. SWOT Analysis
11.3. Kao Corporation
11.3.1. Business Overview
11.3.2. Company Snapshot
11.3.3. Company Market Share Analysis
11.3.4. Company Product Portfolio
11.3.5. Recent Developments
11.3.6. SWOT Analysis
11.4. L'Oréal S.A.
11.4.1. Business Overview
11.4.2. Company Snapshot
11.4.3. Company Market Share Analysis
11.4.4. Company Product Portfolio
11.4.5. Recent Developments
11.4.6. SWOT Analysis
11.5. Oriflame Cosmetics Global SA
11.5.1. Business Overview
11.5.2. Company Snapshot
11.5.3. Company Market Share Analysis
11.5.4. Company Product Portfolio
11.5.5. Recent Developments
11.5.6. SWOT Analysis
11.6. Revlon, Inc.
11.6.1. Business Overview
11.6.2. Company Snapshot
11.6.3. Company Market Share Analysis
11.6.4. Company Product Portfolio
11.6.5. Recent Developments
11.6.6. SWOT Analysis
11.7. Shiseido Company, Limited
11.7.1. Business Overview
11.7.2. Company Snapshot
11.7.3. Company Market Share Analysis
11.7.4. Company Product Portfolio
11.7.5. Recent Developments
11.7.6. SWOT Analysis
11.8. The Estee Lauder Companies Inc.
11.8.1. Business Overview
11.8.2. Company Snapshot
11.8.3. Company Market Share Analysis
11.8.4. Company Product Portfolio
11.8.5. Recent Developments
11.8.6. SWOT Analysis
11.9. The Procter & Gamble Company
11.9.1. Business Overview
11.9.2. Company Snapshot
11.9.3. Company Market Share Analysis
11.9.4. Company Product Portfolio
11.9.5. Recent Developments
11.9.6. SWOT Analysis
11.10. Unilever PLC
11.10.1. Business Overview
11.10.2. Company Snapshot
11.10.3. Company Market Share Analysis
11.10.4. Company Product Portfolio
11.10.5. Recent Developments
11.10.6. SWOT Analysis
List of Table
1. Global Beauty and Personal Care Products Market, By Type, 2019-2032 (USD Billion)
2. Global Conventional Beauty and Personal Care Products Market, By Region, 2019-2032 (USD Billion)
3. Global Organic Beauty and Personal Care Products Market, By Region, 2019-2032 (USD Billion)
4. Global Beauty and Personal Care Products Market, By Product Type, 2019-2032 (USD Billion)
5. Global Skincare Beauty and Personal Care Products Market, By Region, 2019-2032 (USD Billion)
6. Global Colour Cosmetics Beauty and Personal Care Products Market, By Region, 2019-2032 (USD Billion)
7. Global Haircare Beauty and Personal Care Products Market, By Region, 2019-2032 (USD Billion)
8. Global Fragrances Beauty and Personal Care Products Market, By Region, 2019-2032 (USD Billion)
9. Global Others Beauty and Personal Care Products Market, By Region, 2019-2032 (USD Billion)
10. Global Beauty and Personal Care Products Market, By Distribution Channel, 2019-2032 (USD Billion)
11. Global Ecommerce Beauty and Personal Care Products Market, By Region, 2019-2032 (USD Billion)
12. Global Departmental Stores Beauty and Personal Care Products Market, By Region, 2019-2032 (USD Billion)
13. Global Convenience Stores Beauty and Personal Care Products Market, By Region, 2019-2032 (USD Billion)
14. Global Supermarkets/Hypermarkets Beauty and Personal Care Products Market, By Region, 2019-2032 (USD Billion)
15. Global Specialty Stores Beauty and Personal Care Products Market, By Region, 2019-2032 (USD Billion)
16. Global Retail Stores Beauty and Personal Care Products Market, By Region, 2019-2032 (USD Billion)
17. Global Others Beauty and Personal Care Products Market, By Region, 2019-2032 (USD Billion)
18. Global Beauty and Personal Care Products Market, By Region, 2019-2032 (USD Billion)
19. North America Beauty and Personal Care Products Market, By Type, 2019-2032 (USD Billion)
20. North America Beauty and Personal Care Products Market, By Product Type, 2019-2032 (USD Billion)
21. North America Beauty and Personal Care Products Market, By Distribution Channel, 2019-2032 (USD Billion)
22. U.S. Beauty and Personal Care Products Market, By Type, 2019-2032 (USD Billion)
23. U.S. Beauty and Personal Care Products Market, By Product Type, 2019-2032 (USD Billion)
24. U.S. Beauty and Personal Care Products Market, By Distribution Channel, 2019-2032 (USD Billion)
25. Canada Beauty and Personal Care Products Market, By Type, 2019-2032 (USD Billion)
26. Canada Beauty and Personal Care Products Market, By Product Type, 2019-2032 (USD Billion)
27. Canada Beauty and Personal Care Products Market, By Distribution Channel, 2019-2032 (USD Billion)
28. Mexico Beauty and Personal Care Products Market, By Type, 2019-2032 (USD Billion)
29. Mexico Beauty and Personal Care Products Market, By Product Type, 2019-2032 (USD Billion)
30. Mexico Beauty and Personal Care Products Market, By Distribution Channel, 2019-2032 (USD Billion)
31. Europe Beauty and Personal Care Products Market, By Type, 2019-2032 (USD Billion)
32. Europe Beauty and Personal Care Products Market, By Product Type, 2019-2032 (USD Billion)
33. Europe Beauty and Personal Care Products Market, By Distribution Channel, 2019-2032 (USD Billion)
34. Germany Beauty and Personal Care Products Market, By Type, 2019-2032 (USD Billion)
35. Germany Beauty and Personal Care Products Market, By Product Type, 2019-2032 (USD Billion)
36. Germany Beauty and Personal Care Products Market, By Distribution Channel, 2019-2032 (USD Billion)
37. France Beauty and Personal Care Products Market, By Type, 2019-2032 (USD Billion)
38. France Beauty and Personal Care Products Market, By Product Type, 2019-2032 (USD Billion)
39. France Beauty and Personal Care Products Market, By Distribution Channel, 2019-2032 (USD Billion)
40. U.K. Beauty and Personal Care Products Market, By Type, 2019-2032 (USD Billion)
41. U.K. Beauty and Personal Care Products Market, By Product Type, 2019-2032 (USD Billion)
42. U.K. Beauty and Personal Care Products Market, By Distribution Channel, 2019-2032 (USD Billion)
43. Italy Beauty and Personal Care Products Market, By Type, 2019-2032 (USD Billion)
44. Italy Beauty and Personal Care Products Market, By Product Type, 2019-2032 (USD Billion)
45. Italy Beauty and Personal Care Products Market, By Distribution Channel, 2019-2032 (USD Billion)
46. Spain Beauty and Personal Care Products Market, By Type, 2019-2032 (USD Billion)
47. Spain Beauty and Personal Care Products Market, By Product Type, 2019-2032 (USD Billion)
48. Spain Beauty and Personal Care Products Market, By Distribution Channel, 2019-2032 (USD Billion)
49. Asia Pacific Beauty and Personal Care Products Market, By Type, 2019-2032 (USD Billion)
50. Asia Pacific Beauty and Personal Care Products Market, By Product Type, 2019-2032 (USD Billion)
51. Asia Pacific Beauty and Personal Care Products Market, By Distribution Channel, 2019-2032 (USD Billion)
52. Japan Beauty and Personal Care Products Market, By Type, 2019-2032 (USD Billion)
53. Japan Beauty and Personal Care Products Market, By Product Type, 2019-2032 (USD Billion)
54. Japan Beauty and Personal Care Products Market, By Distribution Channel, 2019-2032 (USD Billion)
55. China Beauty and Personal Care Products Market, By Type, 2019-2032 (USD Billion)
56. China Beauty and Personal Care Products Market, By Product Type, 2019-2032 (USD Billion)
57. China Beauty and Personal Care Products Market, By Distribution Channel, 2019-2032 (USD Billion)
58. India Beauty and Personal Care Products Market, By Type, 2019-2032 (USD Billion)
59. India Beauty and Personal Care Products Market, By Product Type, 2019-2032 (USD Billion)
60. India Beauty and Personal Care Products Market, By Distribution Channel, 2019-2032 (USD Billion)
61. South America Beauty and Personal Care Products Market, By Type, 2019-2032 (USD Billion)
62. South America Beauty and Personal Care Products Market, By Product Type, 2019-2032 (USD Billion)
63. South America Beauty and Personal Care Products Market, By Distribution Channel, 2019-2032 (USD Billion)
64. Brazil Beauty and Personal Care Products Market, By Type, 2019-2032 (USD Billion)
65. Brazil Beauty and Personal Care Products Market, By Product Type, 2019-2032 (USD Billion)
66. Brazil Beauty and Personal Care Products Market, By Distribution Channel, 2019-2032 (USD Billion)
67. Middle East and Africa Beauty and Personal Care Products Market, By Type, 2019-2032 (USD Billion)
68. Middle East and Africa Beauty and Personal Care Products Market, By Product Type, 2019-2032 (USD Billion)
69. Middle East and Africa Beauty and Personal Care Products Market, By Distribution Channel, 2019-2032 (USD Billion)
70. UAE Beauty and Personal Care Products Market, By Type, 2019-2032 (USD Billion)
71. UAE Beauty and Personal Care Products Market, By Product Type, 2019-2032 (USD Billion)
72. UAE Beauty and Personal Care Products Market, By Distribution Channel, 2019-2032 (USD Billion)
73. South Africa Beauty and Personal Care Products Market, By Type, 2019-2032 (USD Billion)
74. South Africa Beauty and Personal Care Products Market, By Product Type, 2019-2032 (USD Billion)
75. South Africa Beauty and Personal Care Products Market, By Distribution Channel, 2019-2032 (USD Billion)
List of Figures
1. Global Beauty and Personal Care Products Market Segmentation
2. Beauty and Personal Care Products Market: Research Methodology
3. Market Size Estimation Methodology: Bottom-Up Approach
4. Market Size Estimation Methodology: Top-Down Approach
5. Data Triangulation
6. Porter’s Five Forces Analysis
7. Value Chain Analysis
8. Global Beauty and Personal Care Products Market Attractiveness Analysis by Type
9. Global Beauty and Personal Care Products Market Attractiveness Analysis by Product Type
10. Global Beauty and Personal Care Products Market Attractiveness Analysis by Distribution Channel
11. Global Beauty and Personal Care Products Market Attractiveness Analysis by Region
12. Global Beauty and Personal Care Products Market: Dynamics
13. Global Beauty and Personal Care Products Market Share by Type (2022 & 2032)
14. Global Beauty and Personal Care Products Market Share by Product Type (2022 & 2032)
15. Global Beauty and Personal Care Products Market Share by Distribution Channel (2022 & 2032)
16. Global Beauty and Personal Care Products Market Share by Regions (2022 & 2032)
17. Global Beauty and Personal Care Products Market Share by Company (2022)
This study forecasts revenue at global, regional, and country levels from 2019 to 2032. The Brainy Insights has segmented the global beauty and personal care products market based on below mentioned segments:
Global Beauty and Personal Care Products Market by Type:
Global Beauty and Personal Care Products Market by Product Type:
Global Beauty and Personal Care Products Market by Distribution Channel:
Global Beauty and Personal Care Products Market by Region:
Research has its special purpose to undertake marketing efficiently. In this competitive scenario, businesses need information across all industry verticals; the information about customer wants, market demand, competition, industry trends, distribution channels etc. This information needs to be updated regularly because businesses operate in a dynamic environment. Our organization, The Brainy Insights incorporates scientific and systematic research procedures in order to get proper market insights and industry analysis for overall business success. The analysis consists of studying the market from a miniscule level wherein we implement statistical tools which helps us in examining the data with accuracy and precision.
Our research reports feature both; quantitative and qualitative aspects for any market. Qualitative information for any market research process are fundamental because they reveal the customer needs and wants, usage and consumption for any product/service related to a specific industry. This in turn aids the marketers/investors in knowing certain perceptions of the customers. Qualitative research can enlighten about the different product concepts and designs along with unique service offering that in turn, helps define marketing problems and generate opportunities. On the other hand, quantitative research engages with the data collection process through interviews, e-mail interactions, surveys and pilot studies. Quantitative aspects for the market research are useful to validate the hypotheses generated during qualitative research method, explore empirical patterns in the data with the help of statistical tools, and finally make the market estimations.
The Brainy Insights offers comprehensive research and analysis, based on a wide assortment of factual insights gained through interviews with CXOs and global experts and secondary data from reliable sources. Our analysts and industry specialist assume vital roles in building up statistical tools and analysis models, which are used to analyse the data and arrive at accurate insights with exceedingly informative research discoveries. The data provided by our organization have proven precious to a diverse range of companies, facilitating them to address issues such as determining which products/services are the most appealing, whether or not customers use the product in the manner anticipated, the purchasing intentions of the market and many others.
Our research methodology encompasses an idyllic combination of primary and secondary initiatives. Key phases involved in this process are listed below:

The phase involves the gathering and collecting of market data and its related information with the help of different sources & research procedures.

The data procurement stage involves in data gathering and collecting through various data sources.
This stage involves in extensive research. These data sources includes:
Purchased Database: Purchased databases play a crucial role in estimating the market sizes irrespective of the domain. Our purchased database includes:
Primary Research: The Brainy Insights interacts with leading companies and experts of the concerned domain to develop the analyst team’s market understanding and expertise. It improves and substantiates every single data presented in the market reports. Primary research mainly involves in telephonic interviews, E-mail interactions and face-to-face interviews with the raw material providers, manufacturers/producers, distributors, & independent consultants. The interviews that we conduct provides valuable data on market size and industry growth trends prevailing in the market. Our organization also conducts surveys with the various industry experts in order to gain overall insights of the industry/market. For instance, in healthcare industry we conduct surveys with the pharmacists, doctors, surgeons and nurses in order to gain insights and key information of a medical product/device/equipment which the customers are going to usage. Surveys are conducted in the form of questionnaire designed by our own analyst team. Surveys plays an important role in primary research because surveys helps us to identify the key target audiences of the market. Additionally, surveys helps to identify the key target audience engaged with the market. Our survey team conducts the survey by targeting the key audience, thus gaining insights from them. Based on the perspectives of the customers, this information is utilized to formulate market strategies. Moreover, market surveys helps us to understand the current competitive situation of the industry. To be precise, our survey process typically involve with the 360 analysis of the market. This analytical process begins by identifying the prospective customers for a product or service related to the market/industry to obtain data on how a product/service could fit into customers’ lives.

Secondary Research: The secondary data sources includes information published by the on-profit organizations such as World bank, WHO, company fillings, investor presentations, annual reports, national government documents, statistical databases, blogs, articles, white papers and others. From the annual report, we analyse a company’s revenue to understand the key segment and market share of that organization in a particular region. We analyse the company websites and adopt the product mapping technique which is important for deriving the segment revenue. In the product mapping method, we select and categorize the products offered by the companies catering to domain specific market, deduce the product revenue for each of the companies so as to get overall estimation of the market size. We also source data and analyses trends based on information received from supply side and demand side intermediaries in the value chain. The supply side denotes the data gathered from supplier, distributor, wholesaler and the demand side illustrates the data gathered from the end customers for respective market domain.

The supply side for a domain specific market is analysed by:
The demand side for the market is estimated through:
In-house Library: Apart from these third-party sources, we have our in-house library of qualitative and quantitative information. Our in-house database includes market data for various industry and domains. These data are updated on regular basis as per the changing market scenario. Our library includes, historic databases, internal audit reports and archives.
Sometimes there are instances where there is no metadata or raw data available for any domain specific market. For those cases, we use our expertise to forecast and estimate the market size in order to generate comprehensive data sets. Our analyst team adopt a robust research technique in order to produce the estimates:
Data Synthesis: This stage involves the analysis & mapping of all the information obtained from the previous step. It also involves in scrutinizing the data for any discrepancy observed while data gathering related to the market. The data is collected with consideration to the heterogeneity of sources. Robust scientific techniques are in place for synthesizing disparate data sets and provide the essential contextual information that can orient market strategies. The Brainy Insights has extensive experience in data synthesis where the data passes through various stages:


Market Deduction & Formulation: The final stage comprises of assigning data points at appropriate market spaces so as to deduce feasible conclusions. Analyst perspective & subject matter expert based holistic form of market sizing coupled with industry analysis also plays a crucial role in this stage.
This stage involves in finalization of the market size and numbers that we have collected from data integration step. With data interpolation, it is made sure that there is no gap in the market data. Successful trend analysis is done by our analysts using extrapolation techniques, which provide the best possible forecasts for the market.
Data Validation & Market Feedback: Validation is the most important step in the process. Validation & re-validation via an intricately designed process helps us finalize data-points to be used for final calculations.

The Brainy Insights interacts with leading companies and experts of the concerned domain to develop the analyst team’s market understanding and expertise. It improves and substantiates every single data presented in the market reports. The data validation interview and discussion panels are typically composed of the most experienced industry members. The participants include, however, are not limited to:
Moreover, we always validate our data and findings through primary respondents from all the major regions we are working on.


Free Customization
Fortune 500 Clients
Free Yearly Update On Purchase Of Multi/Corporate License
Companies Served Till Date