- +1-315-215-1633
- sales@thebrainyinsights.com

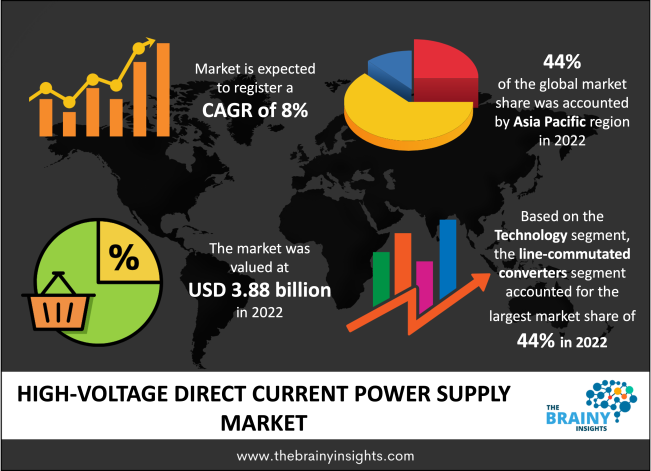
The global high-voltage direct current power supply market is expected to grow from USD 3.88 billion in 2022 to USD 8.37 billion by 2032, at a CAGR of 8% during the forecast period 2023-2032. The increasing demand for energy and power globally will drive the global high-voltage direct current power supply market.
The modern economy relies on electricity to run; it is essential to it. Electricity is necessary for heating, cooling, lighting, appliances, and other items in homes, businesses, manufacturing facilities, and agricultural and mining sites. Energy must be transported from its source to the areas mentioned earlier for use as intended by using the power supply and transmission networks to move it from there to the final consumers. Various conductors, poles, transformers, wires, and earthing systems transfer electricity through the power supply system. It is a sophisticated system designed to quickly move energy from power plants to final consumers. It has wires for connection, transmission, and cables. The system's transmission unit is in charge of transporting massive amounts of high-voltage electricity over huge distances from power plants to substations. The energy is then moved from sub-stations to residences, companies, and other end consumers. In today's globally interconnected environment, the smooth transfer and operation of supply and transmission lines are essential. Developing more modern, rapid, durable, dependable, and efficient power supply and transmission systems is vital. The use of high voltage direct current power supply systems, which are becoming more widespread worldwide, is suitable for efficiently transferring enormous amounts of energy.
Get an overview of this study by requesting a free sample
February 2023 - Hitachi Energy officially opened a new high-voltage direct current (HVDC) and power quality factory in Chennai, India, to meet the rising electricity demand. The factory will deliver cutting-edge solutions to support the acceleration of the energy transition, allowing Hitachi Energy to increase its production capacity. These ground-breaking solutions are essential for growth in transmission, particularly for the integration of renewables and electrical grid stability. Both the rapidly expanding Indian market and the significant global need for clean energy solutions will be served by it, allowing for the rapid and efficient integration of renewable energy sources.
February 2023 - The UK's electricity infrastructure is now being upgraded, and Prysmian Group, the global market leader in energy and telecom cable systems, announced that it had been granted a Medium Voltage cable framework deal with National Grid Electricity Distribution for a minimum of three years. To meet the rising capacity requirements of global electrification, more expansive and sophisticated grids and infrastructures are needed, capable of crossing greater distances and facilitating two-way energy traffic to and from where the energy is produced and consumed. Grid hardening is at the centre of Prysmian's research and development strategy. The business has created solutions, such as asset monitoring systems and grid enhancement solutions, to meet the expanding demand for grid stability and innovation.
The increasing demand for electricity or energy – The population growth globally has led to an equal rise in demands for utilities which essentially require power or energy in the form of electricity, light, heat etc. rapid urbanization has increased the demand for smart offices, homes and an enhanced urban living, mobility and overall quality of life, which again requires vast amounts of energy. Industrialization in the contemporary world is driven by automation and digitization, whose fundamental basis is power in the form of chemical, electrical and mechanical energy have all significantly boosted energy demand. The population's rising standard of living has increased demand for expensive electronics, smart houses, and offices outfitted with technologically advanced equipment, which has boosted consumer energy use. Rising energy consumption will also be a result of industrialization in developing nations. Furthermore, the government initiatives to provide last-mile water and light delivery will require HDVC power transmission systems. HDVC power supply is preferred given its efficiency over long distances, cheaper tower requirement, and less power loss. These systems also offer greater flexibility to the operator, and it is reliable. The advantages of HVDC power supply will propel its application in several economic sectors, thereby driving the global market's growth.
The multi-dimensional HVDC nodes are complex in design – The global power distributions and transmission systems are shifting towards high voltage direct current power supply systems to facilitate long-distance energy transfer with less power loss. The need to transfer energy from offshore energy sources has encouraged the need to utilize high voltage direct current power supply lines at a larger scale and a faster pace than anticipated by the market participants. Employing the HVDC technology involves several components. The system itself has a complex design, making them difficult to operate. Several adjustments, repairs, and replacements must be performed at multi-terminal HVDC power nodes to prevent future problems and ensure hassle-free energy transmission. This cutting-edge and complex system is occasionally incompatible with the current power supply networks, and their integration may lead to high overhead costs. The process is time-consuming, which restricts market growth.
Technological advancements have made HVDC ideal for renewable energy transmission – To reduce power loss during energy transmission and distribution, industry players are creating new tools, machinery, and components that encourage energy conservation. Given its rising popularity in renewable energy, the market for high-voltage direct current power supplies will have great potential. It will offer lucrative market opportunities for the industry participants. The market's expansion will also be aided by greater funding for the study and creation of more durable HVDC networks and superconducting technologies for reduced emissions. Due to the accelerated climate change rate, it is urgently necessary to dramatically reduce carbon emissions. Government initiatives to develop smart power networks and renewable energy sources have altered. The government's subsidies and incentives encourage the establishment and incorporation of intelligent and renewable energy transmission and distribution systems, which will also create lucrative opportunities for the market for high-voltage direct current power supplies.
The stringent government regulations – The high voltage direct current power supply systems are deployed for carrying vast amounts of energy. If necessary, safety precautions aren't taken; such a massive amount of energy could be harmful. Strict protective guidelines, rules, and laws govern the high voltage direct current power supply market. There are well-established, autonomous and powerful federal authorities under the national governments who authorize, monitor and control the power distribution and transmission market. The rules and regulations guarantee end-user security and guard stakeholders' interests. The exploitation of the energy sector is also kept in check by robust regulatory oversight. The regulatory bodies drive the shift from conventional to renewable energy sources, enforce environmental regulations to limit emissions, and guarantee market participants' adherence to the law. Such strict regulations may hamper the expansion of the high-voltage direct current power supply market.
The regions analyzed for the market include North America, Europe, South America, Asia Pacific, the Middle East, and Africa. The Asia Pacific region emerged as the most significant global high-voltage direct current power supply market, with a 44% market revenue share in 2022. The market for high-voltage direct current power supply is being driven by the region's rising urbanization and the industrialization of developing countries. The need for consumer durables, smart homes, workspaces, and public utilities is being driven by the urbanized population. Consumers' rising disposable income enables them to use such energy-dependent luxuries. These energy-powered smart homes, workplaces, and consumer goods are expanding in the regional market. Additionally, as the industrial, oil and gas, construction and mining industry is expanding, the regional high-voltage direct current power supply market will grow. The region's emerging economies fund initiatives for last-mile energy delivery to promote human growth and development through better healthcare, education, and housing. The market for regional high-voltage direct current power supply will benefit from the increased financial investment needed to create a smart grid and guarantee energy security. The region's rapid industrialization and strong manufacturing, industrial, and commercial hubs will help support the market's expansion. Due to the government's recent implementation of new rules supporting the development of smart power grids with high voltage direct current capability and lower transmission loss, Asia-Pacific is anticipated to see the highest growth throughout the projected period.
Asia Pacific Region High-voltage Direct Current Power Supply Market Share in 2022 - 44%
www.thebrainyinsights.com
Check the geographical analysis of this market by requesting a free sample
The application segment is divided into telecommunication, medical, oil & gas, industrial, and others. The industrial segment dominated the market with a revenue share of around 39% in 2022. The expanding presence of office spaces in the rising developing economies of India and China primarily drives the industrial segment. High voltage direct current carrying cables are extremely robust and adaptable to the requirements of the massive and extensive network of a vast industrial business environment. As mentioned earlier, the usage of HVDC cables in the area will be driven by the automation of businesses with technologically advanced machinery, equipment, devices and other components. The need for energy will increase as the automobile, manufacturing, and aerospace industries expand. Devices with a large current carrying capacity, quick switching rate, and less power consumption are required for the sectors mentioned earlier. A dependable, robust, and effective High-voltage direct current power supply system will satisfy these requirements.
The technology segment is divided into line commutated converters, voltage source converters, and capacitor-commentated converters. The line-commutated converters segment dominated the market with a revenue share of around 44% in 2022. The traditional, proven technology for converting electrical power from AC to DC or vice versa is called a line-commutated converter (LCC). They are well-tested and efficient, explaining their dominance in the market.
The voltage segment is divided into less than 1000 V, 1000V-4000V, and more than 4000V. The more than 4000V segment dominated the market with a revenue share of around 64% in 2022. The expanding smart grid installation in economies worldwide to improve energy transmission and ensure power conservation by minimizing transfer losses will increase the adoption of more than 4000V segment. The developing telecommunication sector to introduce faster connectivity will also propel the segment's growth. The growing need for developing offshore power transmission and distribution lines for the oil and gas industry will also augment the segment's growth.
The deployment type segment is divided into overhead, subsea, underground and combination. The subsea segment dominated the market with a revenue share of around 46% in 2022. Subsea power supply and transmission lines are below the water surface. The growing need for providing power to remote places, including islands and other swathes of strategic lands, will increase the adoption of subsea power transmission and distribution lines. They are safe, effective, and fast energy transfer mechanisms over continents. The offshore oil and gas industry has garnered pace in the past few years, and the use of subsea power supply and transmission is bound to increase.
| Attribute | Description |
|---|---|
| Market Size | Revenue (USD Billion) |
| Market size value in 2022 | USD 3.88 Billion |
| Market size value in 2032 | USD 8.37 Billion |
| CAGR (2023 to 2032) | 8% |
| Historical data | 2019-2021 |
| Base Year | 2022 |
| Forecast | 2023-2032 |
| Regional Segments | The regions examined for the market are Europe, Asia Pacific, North America, South America, and Middle East & Africa. |
| Segments | The research segment is based on application, technology, voltage, and deployment type. |
As per The Brainy Insights, the size of the high-voltage direct current power supply market was valued at USD 3.88 billion in 2022 to USD 8.37 billion by 2032.
The global high-voltage direct current power supply market is growing at a CAGR of 8% during the forecast period 2023-2032.
The market's growth will be influenced by the increasing demand for electricity or energy.
The multi-dimensional HVDC nodes are complex in design and could hamper market growth.
1. Introduction
1.1. Objectives of the Study
1.2. Market Definition
1.3. Research Scope
1.4. Currency
1.5. Key Target Audience
2. Research Methodology and Assumptions
3. Executive Summary
4. Premium Insights
4.1. Porter’s Five Forces Analysis
4.2. Value Chain Analysis
4.3. Top Investment Pockets
4.3.1. Market Attractiveness Analysis by Application
4.3.2. Market Attractiveness Analysis by Technology
4.3.3. Market Attractiveness Analysis by Voltage
4.3.4. Market Attractiveness Analysis by Deployment Type
4.3.5. Market Attractiveness Analysis by Region
4.4. Industry Trends
5. Market Dynamics
5.1. Market Evaluation
5.2. Drivers
5.2.1. The increasing demand for electricity or energy
5.3. Restraints
5.3.1. The multi-dimensional HVDC nodes are complex in design
5.4. Opportunities
5.4.1. Technological advancements have made HVDC ideal for renewable energy transmission
5.5. Challenges
5.5.1. The stringent government regulations
6. Global High-Voltage Direct Current Power Supply Market Analysis and Forecast, By Application
6.1. Segment Overview
6.2. Telecommunication
6.3. Medical
6.4. Oil & Gas
6.5. Industrial
6.6. Others
7. Global High-Voltage Direct Current Power Supply Market Analysis and Forecast, By Technology
7.1. Segment Overview
7.2. Line Commutated Converters
7.3. Voltage Source Converters
7.4. Capacitor Commentated Converters
8. Global High-Voltage Direct Current Power Supply Market Analysis and Forecast, By Voltage
8.1. Segment Overview
8.2. Less Than 1000 V
8.3. 1000V-4000V
8.4. More Than 4000V
9. Global High-Voltage Direct Current Power Supply Market Analysis and Forecast, By Deployment Type
9.1. Segment Overview
9.2. Overhead
9.3. Subsea
9.4. Underground
9.5. Combination
10. Global High-Voltage Direct Current Power Supply Market Analysis and Forecast, By Regional Analysis
10.1. Segment Overview
10.2. North America
10.2.1. U.S.
10.2.2. Canada
10.2.3. Mexico
10.3. Europe
10.3.1. Germany
10.3.2. France
10.3.3. U.K.
10.3.4. Italy
10.3.5. Spain
10.4. Asia-Pacific
10.4.1. Japan
10.4.2. China
10.4.3. India
10.5. South America
10.5.1. Brazil
10.6. Middle East and Africa
10.6.1. UAE
10.6.2. South Africa
11. Global High-Voltage Direct Current Power Supply Market-Competitive Landscape
11.1. Overview
11.2. Market Share of Key Players in the High-Voltage Direct Current Power Supply Market
11.2.1. Global Company Market Share
11.2.2. North America Company Market Share
11.2.3. Europe Company Market Share
11.2.4. APAC Company Market Share
11.3. Competitive Situations and Trends
11.3.1. Product Launches and Developments
11.3.2. Partnerships, Collaborations, and Agreements
11.3.3. Mergers & Acquisitions
11.3.4. Expansions
12. Company Profiles
12.1. ABB Ltd.
12.1.1. Business Overview
12.1.2. Company Snapshot
12.1.3. Company Market Share Analysis
12.1.4. Company Product Portfolio
12.1.5. Recent Developments
12.1.6. SWOT Analysis
12.2. AHV
12.2.1. Business Overview
12.2.2. Company Snapshot
12.2.3. Company Market Share Analysis
12.2.4. Company Product Portfolio
12.2.5. Recent Developments
12.2.6. SWOT Analysis
12.3. American Power Design
12.3.1. Business Overview
12.3.2. Company Snapshot
12.3.3. Company Market Share Analysis
12.3.4. Company Product Portfolio
12.3.5. Recent Developments
12.3.6. SWOT Analysis
12.4. Excelitas Technologies Corporation
12.4.1. Business Overview
12.4.2. Company Snapshot
12.4.3. Company Market Share Analysis
12.4.4. Company Product Portfolio
12.4.5. Recent Developments
12.4.6. SWOT Analysis
12.5. General Electric
12.5.1. Business Overview
12.5.2. Company Snapshot
12.5.3. Company Market Share Analysis
12.5.4. Company Product Portfolio
12.5.5. Recent Developments
12.5.6. SWOT Analysis
12.6. Glassman Europe Ltd
12.6.1. Business Overview
12.6.2. Company Snapshot
12.6.3. Company Market Share Analysis
12.6.4. Company Product Portfolio
12.6.5. Recent Developments
12.6.6. SWOT Analysis
12.7. Hamamatsu
12.7.1. Business Overview
12.7.2. Company Snapshot
12.7.3. Company Market Share Analysis
12.7.4. Company Product Portfolio
12.7.5. Recent Developments
12.7.6. SWOT Analysis
12.8. Siemens AG
12.8.1. Business Overview
12.8.2. Company Snapshot
12.8.3. Company Market Share Analysis
12.8.4. Company Product Portfolio
12.8.5. Recent Developments
12.8.6. SWOT Analysis
12.9. Toshiba Group
12.9.1. Business Overview
12.9.2. Company Snapshot
12.9.3. Company Market Share Analysis
12.9.4. Company Product Portfolio
12.9.5. Recent Developments
12.9.6. SWOT Analysis
12.10. XP Power
12.10.1. Business Overview
12.10.2. Company Snapshot
12.10.3. Company Market Share Analysis
12.10.4. Company Product Portfolio
12.10.5. Recent Developments
12.10.6. SWOT Analysis
List of Table
1. Global High-Voltage Direct Current Power Supply Market, By Application, 2019-2032 (USD Billion)
2. Global Telecommunication High-Voltage Direct Current Power Supply Market, By Region, 2019-2032 (USD Billion)
3. Global Medical High-Voltage Direct Current Power Supply Market, By Region, 2019-2032 (USD Billion)
4. Global Oil & Gas High-Voltage Direct Current Power Supply Market, By Region, 2019-2032 (USD Billion)
5. Global Industrial High-Voltage Direct Current Power Supply Market, By Region, 2019-2032 (USD Billion)
6. Global Others High-Voltage Direct Current Power Supply Market, By Region, 2019-2032 (USD Billion)
7. Global High-Voltage Direct Current Power Supply Market, By Technology, 2019-2032 (USD Billion)
8. Global Line Commutated Converters High-Voltage Direct Current Power Supply Market, By Region, 2019-2032 (USD Billion)
9. Global Voltage Source Converters High-Voltage Direct Current Power Supply Market, By Region, 2019-2032 (USD Billion)
10. Global Capacitor Commentated Converters High-Voltage Direct Current Power Supply Market, By Region, 2019-2032 (USD Billion)
11. Global High-Voltage Direct Current Power Supply Market, By Voltage, 2019-2032 (USD Billion)
12. Global Less Than 1000 V High-Voltage Direct Current Power Supply Market, By Region, 2019-2032 (USD Billion)
13. Global 1000V-4000V High-Voltage Direct Current Power Supply Market, By Region, 2019-2032 (USD Billion)
14. Global More Than 4000V High-Voltage Direct Current Power Supply Market, By Region, 2019-2032 (USD Billion)
15. Global High-Voltage Direct Current Power Supply Market, By Deployment Type, 2019-2032 (USD Billion)
16. Global Overhead High-Voltage Direct Current Power Supply Market, By Region, 2019-2032 (USD Billion)
17. Global Subsea High-Voltage Direct Current Power Supply Market, By Region, 2019-2032 (USD Billion)
18. Global Underground High-Voltage Direct Current Power Supply Market, By Region, 2019-2032 (USD Billion)
19. Global Combination High-Voltage Direct Current Power Supply Market, By Region, 2019-2032 (USD Billion)
20. Global High-Voltage Direct Current Power Supply Market, By Region, 2019-2032 (USD Billion)
21. North America High-Voltage Direct Current Power Supply Market, By Application, 2019-2032 (USD Billion)
22. North America High-Voltage Direct Current Power Supply Market, By Technology, 2019-2032 (USD Billion)
23. North America High-Voltage Direct Current Power Supply Market, By Voltage, 2019-2032 (USD Billion)
24. North America High-Voltage Direct Current Power Supply Market, By Deployment Type, 2019-2032 (USD Billion)
25. U.S. High-Voltage Direct Current Power Supply Market, By Application, 2019-2032 (USD Billion)
26. U.S. High-Voltage Direct Current Power Supply Market, By Technology, 2019-2032 (USD Billion)
27. U.S. High-Voltage Direct Current Power Supply Market, By Voltage, 2019-2032 (USD Billion)
28. U.S. High-Voltage Direct Current Power Supply Market, By Deployment Type, 2019-2032 (USD Billion)
29. Canada High-Voltage Direct Current Power Supply Market, By Application, 2019-2032 (USD Billion)
30. Canada High-Voltage Direct Current Power Supply Market, By Technology, 2019-2032 (USD Billion)
31. Canada High-Voltage Direct Current Power Supply Market, By Voltage, 2019-2032 (USD Billion)
32. Canada High-Voltage Direct Current Power Supply Market, By Deployment Type, 2019-2032 (USD Billion)
33. Mexico High-Voltage Direct Current Power Supply Market, By Application, 2019-2032 (USD Billion)
34. Mexico High-Voltage Direct Current Power Supply Market, By Technology, 2019-2032 (USD Billion)
35. Mexico High-Voltage Direct Current Power Supply Market, By Voltage, 2019-2032 (USD Billion)
36. Mexico High-Voltage Direct Current Power Supply Market, By Deployment Type, 2019-2032 (USD Billion)
37. Europe High-Voltage Direct Current Power Supply Market, By Application, 2019-2032 (USD Billion)
38. Europe High-Voltage Direct Current Power Supply Market, By Technology, 2019-2032 (USD Billion)
39. Europe High-Voltage Direct Current Power Supply Market, By Voltage, 2019-2032 (USD Billion)
40. Europe High-Voltage Direct Current Power Supply Market, By Deployment Type, 2019-2032 (USD Billion)
41. Germany High-Voltage Direct Current Power Supply Market, By Application, 2019-2032 (USD Billion)
42. Germany High-Voltage Direct Current Power Supply Market, By Technology, 2019-2032 (USD Billion)
43. Germany High-Voltage Direct Current Power Supply Market, By Voltage, 2019-2032 (USD Billion)
44. Germany High-Voltage Direct Current Power Supply Market, By Deployment Type, 2019-2032 (USD Billion)
45. France High-Voltage Direct Current Power Supply Market, By Application, 2019-2032 (USD Billion)
46. France High-Voltage Direct Current Power Supply Market, By Technology, 2019-2032 (USD Billion)
47. France High-Voltage Direct Current Power Supply Market, By Voltage, 2019-2032 (USD Billion)
48. France High-Voltage Direct Current Power Supply Market, By Deployment Type, 2019-2032 (USD Billion)
49. U.K. High-Voltage Direct Current Power Supply Market, By Application, 2019-2032 (USD Billion)
50. U.K. High-Voltage Direct Current Power Supply Market, By Technology, 2019-2032 (USD Billion)
51. U.K. High-Voltage Direct Current Power Supply Market, By Voltage, 2019-2032 (USD Billion)
52. U.K. High-Voltage Direct Current Power Supply Market, By Deployment Type, 2019-2032 (USD Billion)
53. Italy High-Voltage Direct Current Power Supply Market, By Application, 2019-2032 (USD Billion)
54. Italy High-Voltage Direct Current Power Supply Market, By Technology, 2019-2032 (USD Billion)
55. Italy High-Voltage Direct Current Power Supply Market, By Voltage, 2019-2032 (USD Billion)
56. Italy High-Voltage Direct Current Power Supply Market, By Deployment Type, 2019-2032 (USD Billion)
57. Spain High-Voltage Direct Current Power Supply Market, By Application, 2019-2032 (USD Billion)
58. Spain High-Voltage Direct Current Power Supply Market, By Technology, 2019-2032 (USD Billion)
59. Spain High-Voltage Direct Current Power Supply Market, By Voltage, 2019-2032 (USD Billion)
60. Spain High-Voltage Direct Current Power Supply Market, By Deployment Type, 2019-2032 (USD Billion)
61. Asia Pacific High-Voltage Direct Current Power Supply Market, By Application, 2019-2032 (USD Billion)
62. Asia Pacific High-Voltage Direct Current Power Supply Market, By Technology, 2019-2032 (USD Billion)
63. Asia Pacific High-Voltage Direct Current Power Supply Market, By Voltage, 2019-2032 (USD Billion)
64. Asia Pacific High-Voltage Direct Current Power Supply Market, By Deployment Type, 2019-2032 (USD Billion)
65. Japan High-Voltage Direct Current Power Supply Market, By Application, 2019-2032 (USD Billion)
66. Japan High-Voltage Direct Current Power Supply Market, By Technology, 2019-2032 (USD Billion)
67. Japan High-Voltage Direct Current Power Supply Market, By Voltage, 2019-2032 (USD Billion)
68. Japan High-Voltage Direct Current Power Supply Market, By Deployment Type, 2019-2032 (USD Billion)
69. China High-Voltage Direct Current Power Supply Market, By Application, 2019-2032 (USD Billion)
70. China High-Voltage Direct Current Power Supply Market, By Technology, 2019-2032 (USD Billion)
71. China High-Voltage Direct Current Power Supply Market, By Voltage, 2019-2032 (USD Billion)
72. China High-Voltage Direct Current Power Supply Market, By Deployment Type, 2019-2032 (USD Billion)
73. India High-Voltage Direct Current Power Supply Market, By Application, 2019-2032 (USD Billion)
74. India High-Voltage Direct Current Power Supply Market, By Technology, 2019-2032 (USD Billion)
75. India High-Voltage Direct Current Power Supply Market, By Voltage, 2019-2032 (USD Billion)
76. India High-Voltage Direct Current Power Supply Market, By Deployment Type, 2019-2032 (USD Billion)
77. South America High-Voltage Direct Current Power Supply Market, By Application, 2019-2032 (USD Billion)
78. South America High-Voltage Direct Current Power Supply Market, By Technology, 2019-2032 (USD Billion)
79. South America High-Voltage Direct Current Power Supply Market, By Voltage, 2019-2032 (USD Billion)
80. South America High-Voltage Direct Current Power Supply Market, By Deployment Type, 2019-2032 (USD Billion)
81. Brazil High-Voltage Direct Current Power Supply Market, By Application, 2019-2032 (USD Billion)
82. Brazil High-Voltage Direct Current Power Supply Market, By Technology, 2019-2032 (USD Billion)
83. Brazil High-Voltage Direct Current Power Supply Market, By Voltage, 2019-2032 (USD Billion)
84. Brazil High-Voltage Direct Current Power Supply Market, By Deployment Type, 2019-2032 (USD Billion)
85. Middle East and Africa High-Voltage Direct Current Power Supply Market, By Application, 2019-2032 (USD Billion)
86. Middle East and Africa High-Voltage Direct Current Power Supply Market, By Technology, 2019-2032 (USD Billion)
87. Middle East and Africa High-Voltage Direct Current Power Supply Market, By Voltage, 2019-2032 (USD Billion)
88. Middle East and Africa High-Voltage Direct Current Power Supply Market, By Deployment Type, 2019-2032 (USD Billion)
89. UAE High-Voltage Direct Current Power Supply Market, By Application, 2019-2032 (USD Billion)
90. UAE High-Voltage Direct Current Power Supply Market, By Technology, 2019-2032 (USD Billion)
91. UAE High-Voltage Direct Current Power Supply Market, By Voltage, 2019-2032 (USD Billion)
92. UAE High-Voltage Direct Current Power Supply Market, By Deployment Type, 2019-2032 (USD Billion)
93. South Africa High-Voltage Direct Current Power Supply Market, By Application, 2019-2032 (USD Billion)
94. South Africa High-Voltage Direct Current Power Supply Market, By Technology, 2019-2032 (USD Billion)
95. South Africa High-Voltage Direct Current Power Supply Market, By Voltage, 2019-2032 (USD Billion)
96. South Africa High-Voltage Direct Current Power Supply Market, By Deployment Type, 2019-2032 (USD Billion)
List of Figures
1. Global High-Voltage Direct Current Power Supply Market Segmentation
2. High-Voltage Direct Current Power Supply Market: Research Methodology
3. Market Size Estimation Methodology: Bottom-Up Approach
4. Market Size Estimation Methodology: Top-Down Approach
5. Data Triangulation
6. Porter’s Five Forces Analysis
7. Value Chain Analysis
8. Global High-Voltage Direct Current Power Supply Market Attractiveness Analysis by Application
9. Global High-Voltage Direct Current Power Supply Market Attractiveness Analysis by Technology
10. Global High-Voltage Direct Current Power Supply Market Attractiveness Analysis by Voltage
11. Global High-Voltage Direct Current Power Supply Market Attractiveness Analysis by Deployment Type
12. Global High-Voltage Direct Current Power Supply Market Attractiveness Analysis by Region
13. Global High-Voltage Direct Current Power Supply Market: Dynamics
14. Global High-Voltage Direct Current Power Supply Market Share by Application (2022 & 2032)
15. Global High-Voltage Direct Current Power Supply Market Share by Technology (2022 & 2032)
16. Global High-Voltage Direct Current Power Supply Market Share by Voltage (2022 & 2032)
17. Global High-Voltage Direct Current Power Supply Market Share by Deployment Type (2022 & 2032)
18. Global High-Voltage Direct Current Power Supply Market Share by Regions (2022 & 2032)
19. Global High-Voltage Direct Current Power Supply Market Share by Company (2022)
This study forecasts revenue at global, regional, and country levels from 2019 to 2032. The Brainy Insights has segmented the high-voltage direct current power supply market based on below mentioned segments:
High-Voltage Direct Current Power Supply Market by Application:
High-Voltage Direct Current Power Supply Market by Technology:
High-Voltage Direct Current Power Supply Market by Voltage:
High-Voltage Direct Current Power Supply Market by Deployment Type:
High-Voltage Direct Current Power Supply Market by Region:
Research has its special purpose to undertake marketing efficiently. In this competitive scenario, businesses need information across all industry verticals; the information about customer wants, market demand, competition, industry trends, distribution channels etc. This information needs to be updated regularly because businesses operate in a dynamic environment. Our organization, The Brainy Insights incorporates scientific and systematic research procedures in order to get proper market insights and industry analysis for overall business success. The analysis consists of studying the market from a miniscule level wherein we implement statistical tools which helps us in examining the data with accuracy and precision.
Our research reports feature both; quantitative and qualitative aspects for any market. Qualitative information for any market research process are fundamental because they reveal the customer needs and wants, usage and consumption for any product/service related to a specific industry. This in turn aids the marketers/investors in knowing certain perceptions of the customers. Qualitative research can enlighten about the different product concepts and designs along with unique service offering that in turn, helps define marketing problems and generate opportunities. On the other hand, quantitative research engages with the data collection process through interviews, e-mail interactions, surveys and pilot studies. Quantitative aspects for the market research are useful to validate the hypotheses generated during qualitative research method, explore empirical patterns in the data with the help of statistical tools, and finally make the market estimations.
The Brainy Insights offers comprehensive research and analysis, based on a wide assortment of factual insights gained through interviews with CXOs and global experts and secondary data from reliable sources. Our analysts and industry specialist assume vital roles in building up statistical tools and analysis models, which are used to analyse the data and arrive at accurate insights with exceedingly informative research discoveries. The data provided by our organization have proven precious to a diverse range of companies, facilitating them to address issues such as determining which products/services are the most appealing, whether or not customers use the product in the manner anticipated, the purchasing intentions of the market and many others.
Our research methodology encompasses an idyllic combination of primary and secondary initiatives. Key phases involved in this process are listed below:

The phase involves the gathering and collecting of market data and its related information with the help of different sources & research procedures.

The data procurement stage involves in data gathering and collecting through various data sources.
This stage involves in extensive research. These data sources includes:
Purchased Database: Purchased databases play a crucial role in estimating the market sizes irrespective of the domain. Our purchased database includes:
Primary Research: The Brainy Insights interacts with leading companies and experts of the concerned domain to develop the analyst team’s market understanding and expertise. It improves and substantiates every single data presented in the market reports. Primary research mainly involves in telephonic interviews, E-mail interactions and face-to-face interviews with the raw material providers, manufacturers/producers, distributors, & independent consultants. The interviews that we conduct provides valuable data on market size and industry growth trends prevailing in the market. Our organization also conducts surveys with the various industry experts in order to gain overall insights of the industry/market. For instance, in healthcare industry we conduct surveys with the pharmacists, doctors, surgeons and nurses in order to gain insights and key information of a medical product/device/equipment which the customers are going to usage. Surveys are conducted in the form of questionnaire designed by our own analyst team. Surveys plays an important role in primary research because surveys helps us to identify the key target audiences of the market. Additionally, surveys helps to identify the key target audience engaged with the market. Our survey team conducts the survey by targeting the key audience, thus gaining insights from them. Based on the perspectives of the customers, this information is utilized to formulate market strategies. Moreover, market surveys helps us to understand the current competitive situation of the industry. To be precise, our survey process typically involve with the 360 analysis of the market. This analytical process begins by identifying the prospective customers for a product or service related to the market/industry to obtain data on how a product/service could fit into customers’ lives.

Secondary Research: The secondary data sources includes information published by the on-profit organizations such as World bank, WHO, company fillings, investor presentations, annual reports, national government documents, statistical databases, blogs, articles, white papers and others. From the annual report, we analyse a company’s revenue to understand the key segment and market share of that organization in a particular region. We analyse the company websites and adopt the product mapping technique which is important for deriving the segment revenue. In the product mapping method, we select and categorize the products offered by the companies catering to domain specific market, deduce the product revenue for each of the companies so as to get overall estimation of the market size. We also source data and analyses trends based on information received from supply side and demand side intermediaries in the value chain. The supply side denotes the data gathered from supplier, distributor, wholesaler and the demand side illustrates the data gathered from the end customers for respective market domain.

The supply side for a domain specific market is analysed by:
The demand side for the market is estimated through:
In-house Library: Apart from these third-party sources, we have our in-house library of qualitative and quantitative information. Our in-house database includes market data for various industry and domains. These data are updated on regular basis as per the changing market scenario. Our library includes, historic databases, internal audit reports and archives.
Sometimes there are instances where there is no metadata or raw data available for any domain specific market. For those cases, we use our expertise to forecast and estimate the market size in order to generate comprehensive data sets. Our analyst team adopt a robust research technique in order to produce the estimates:
Data Synthesis: This stage involves the analysis & mapping of all the information obtained from the previous step. It also involves in scrutinizing the data for any discrepancy observed while data gathering related to the market. The data is collected with consideration to the heterogeneity of sources. Robust scientific techniques are in place for synthesizing disparate data sets and provide the essential contextual information that can orient market strategies. The Brainy Insights has extensive experience in data synthesis where the data passes through various stages:


Market Deduction & Formulation: The final stage comprises of assigning data points at appropriate market spaces so as to deduce feasible conclusions. Analyst perspective & subject matter expert based holistic form of market sizing coupled with industry analysis also plays a crucial role in this stage.
This stage involves in finalization of the market size and numbers that we have collected from data integration step. With data interpolation, it is made sure that there is no gap in the market data. Successful trend analysis is done by our analysts using extrapolation techniques, which provide the best possible forecasts for the market.
Data Validation & Market Feedback: Validation is the most important step in the process. Validation & re-validation via an intricately designed process helps us finalize data-points to be used for final calculations.

The Brainy Insights interacts with leading companies and experts of the concerned domain to develop the analyst team’s market understanding and expertise. It improves and substantiates every single data presented in the market reports. The data validation interview and discussion panels are typically composed of the most experienced industry members. The participants include, however, are not limited to:
Moreover, we always validate our data and findings through primary respondents from all the major regions we are working on.


Free Customization
Fortune 500 Clients
Free Yearly Update On Purchase Of Multi/Corporate License
Companies Served Till Date