- +1-315-215-1633
- sales@thebrainyinsights.com

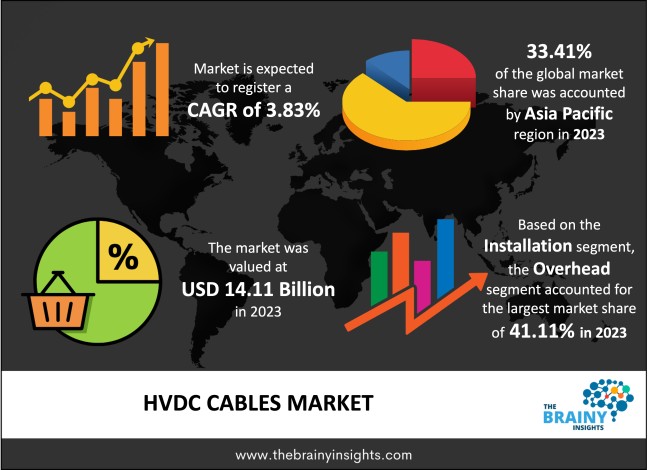
The global HVDC Cables market was valued at USD 14.11 Billion in 2023 and growing at a CAGR of 3.83% from 2023 to 2033. The market is expected to reach USD 20.96 Billion by 2033. The modernization of the grid, along with the integration of advanced products with advanced technology for transmission and distribution networks, are some of the factors propelling the growth of the HVDC cables. Moreover, there is a surge in the deployment of renewable energy sources to achieve clean energy goals, fueling the demand for HVDC cables worldwide. HVDC cables can transport power long distances. Also, there is a growing awareness of the use of HVDC cables, which helps with their cost efficiency. These are some of the factors which are fueling the HVDC cable market.
The growing awareness towards green energy sources worldwide is changing the energy and power sector. This trend of green energy is growing as there is an increase in environmental pollution due to using conventional energy sources. Moreover, the government is also taking initiatives to conduct awareness programs towards clean energy. Also, it has been observed that there is an increase in investment in many developed and developing countries globally, which led to the installation of cables underground and submarines based on the applications. As the world grows, there is more investment in interconnecting grids, linking offshore wind-feeding metropolitan areas, etc. It has been observed that there is a growth in offshore wind energy projects globally, and hence, the sectors which are connecting these projects are also growing. All these factors are driving the HVDC cables market. There is work to modernize the grid for which advanced goods are used in the transmission and distribution network. Also, there is an increase in power consumption in emerging economies because of a surge in industrialization and commercialization. Many projects were happening, such as the Kenya-Ethiopia Electricity Highway in Africa. In this project, the bipolar 500 KV HVDC line is being built, starting from Welaya Sodo in Ethiopia and moving to Suswa in Kenya. The total distance of this project will be around 1068 km, with around 437 km in Ethiopia and 631 km in Kenya. Egypt is also investing in the region for grid infrastructure; hence, it is becoming a leader in Africa for the HVDC cables market. It shows that there is growth in the installation of HVDC systems worldwide as it is proven economically justifiable to strengthen the grid connections. Many renewable energy sources are being added to the grid from many dispersed locations, far from the load centres most of the time; hence, power needs to travel to satisfy the growing need. Hence, the demand for HVDC cables is growing worldwide. The DC offers more flexibility than AC for connecting asynchronous grids, providing stronger grid protection. HVDC cable demand is growing as it has advantages like being easily deployed underground for long distances in very narrow right-of-way (ROW) in comparison to overhead transmission lines.
Get an overview of this study by requesting a free sample
Growing demand for clean energy – There is a growing energy demand and more emphasis on clean energy projects. Based on one of the studies, the world's yearly electricity production is anticipated to cross 38,000 TWh by 2040, compared to 24,000 TWh in 2016. In this case, renewable energy sources are anticipated to contribute around 51% of the total generation mix by 2040, compared to around 22% in 2016. Based on the studies, global renewable energy generation, which includes hydropower, solar photovoltaics, OV and wind, was anticipated to increase by 8% in 2021 and above 6% in 2022. Development is required to maintain such large energy production, transmission, and distribution. As many renewable energy power plants are distantly located from important demand centres, there is a requirement for efficient long-distance bulk energy transmission. These factors, in turn, drive the HVDC cable market.
Problems in Land Acquisition – HVDC cables need large strips of land, especially for underground and overhead cables. These cables also need land that cannot be used for other purposes after overhead or underground lines are passed. In most cases, it is difficult to acquire land for such purposes. Hence, land acquisition becomes a big problem when the cable is laid close to human settlements. These factors are acting as restraints for the market.
Government initiatives – It has been observed that governments worldwide are providing financial support to upgrade the power transmission and distribution infrastructure to meet the energy demands. HVDC cables are very useful for manufacturing plants set up at distant locations as they are very efficient in transmitting large amounts of electricity over long distances. Moreover, there is a growing need for the interrupted electricity supply due to rapid urbanization and industrialization. Also, the leading organizations in HVDC cables are expanding the network domestically and internationally, and there is a high demand for transmission and distribution systems that can bear the enormous load of operations needed for many factories and commercial buildings, etc. All these factors eventually drive the HVDC Cables market in the forecasting period.
The regions analyzed for the market include North America, Europe, South America, Asia Pacific, the Middle East, and Africa. Asia Pacific emerged as the largest market for the global HVDC Cables market, with a 33.41% share of the market revenue in 2023. China and India are the key contributors to the APAC region because of their growing power demand. China is expanding its infrastructure, propelling the demand for HVDC cables in the region. Also, other than India and China, ASEAN countries like South Korea, Pakistan, Japan, and Indonesia will seem to significantly contribute to the expansion of HVDC cable in the region shortly as there is an ageing power infrastructure. Based on one of the studies, around 64.3 GW of the offshore wind capacity worldwide was in operation by the end of 2022 across three continents and 19 countries. It accounts for around 7.1% of the total wind power installation. Over 380 GW of offshore wind capacity in 32 countries is estimated to be added in the next decade.
Asia Pacific Region HVDC Cables Market Share in 2023 - 33.41%
www.thebrainyinsights.com
Check the geographical analysis of this market by requesting a free sample
The installation segment is divided into subsea, underground, overhead and mixed. The overhead segment dominated the market, with a market share of around 41.11% in 2023. This market share is attributed to its easy installation and low long-distance transmission loss. Also, numerous classical HVDC systems utilise overhead transmission lines due to high power transmission and long distances such as 600km and, more generally, from remote power generating stations.
The voltage segment is divided into High(35 to 475 KV), Extra High(475-600 KV) and Ultra High(Above 600KV). The High(35 to 475 KV) segment dominated the market, with a market share of around 65.21% in 2023. It is attributed to the growing demand for long-distance power transmission and the surge in renewable energy projects. HVDC transmission lines are considered best in power transmission for more than hundreds and thousands of kilometres.
The application segment is divided into telecommunication, medical, industrial, oil &gas and others. The industrial segment dominated the market, with a market share of around 36.36% in 2023. This market share is attributed to industries' growing demand for HVDC transmission, as there is a huge power demand there. HVDC cable helps in the interconnection of power grids for securing reliable energy infrastructure.
| Attribute | Description |
|---|---|
| Market Size | Revenue (USD Billion) |
| Market size value in 2023 | USD 14.11 Billion |
| Market size value in 2033 | USD 20.96 Billion |
| CAGR (2024 to 2033) | 3.83% |
| Historical data | 2020-2022 |
| Base Year | 2023 |
| Forecast | 2024-2033 |
| Region | The regions analyzed for the market are Asia Pacific, Europe, South America, North America, and Middle East & Africa. Furthermore, the regions are further analyzed at the country level. |
| Segments | Installation, Voltage and Application |
Asia Pacific region emerged as the largest market for the HVDC Cables.
The market's growth will be influenced by growing demand for clean energy.
Problems in land acquisition could hamper the market growth.
Government initiatives will provide huge opportunities to the market.
Key players are Nexans, Mitsubishi Corp, Hitachi Ltd, General Electric Company, Siemens AG, ABB Ltd, Sumitomo Electric Industries Ltd, LS Corp, Prysmian SpA and J-Power Group among others.
1. Introduction
1.1. Objectives of the Study
1.2. Market Definition
1.3. Research Scope
1.4. Currency
1.5. Key Target Audience
2. Research Methodology and Assumptions
3. Executive Summary
4. Premium Insights
4.1. Porter’s Five Forces Analysis
4.2. Value Chain Analysis
4.3. Top Investment Pockets
4.3.1. Market Attractiveness Analysis By Installation
4.3.2. Market Attractiveness Analysis By Voltage
4.3.3. Market Attractiveness Analysis By Region
4.4. Industry Trends
5. Market Dynamics
5.1. Market Evaluation
5.2. Drivers
5.2.1. Growing demand for clean energy
5.3. Restraints
5.3.1. Problems in Land Acquisition
5.4. Opportunities
5.4.1. Government initiatives
5.5. Challenges
5.5.1. Economic slowdown
6. Global HVDC Cables Market Analysis and Forecast, By Installation
6.1. Segment Overview
6.2. Subsea
6.3. Underground
6.4. Overhead
6.5. Mixed
7. Global HVDC Cables Market Analysis and Forecast, By Voltage
7.1. Segment Overview
7.2. High(35 to 475 kv)
7.3. Extra High(475-600kv)
7.4. Ultra High(Above 600kv)
8. Global HVDC Cables Market Analysis and Forecast, By Application
8.1. Segment Overview
8.2. Telecommunication
8.3. Medical
8.4. Industrial
8.5. Oil &Gas
8.6. Others
9. Global HVDC Cables Market Analysis and Forecast, By Regional Analysis
9.1. Segment Overview
9.2. North America
9.2.1. U.S.
9.2.2. Canada
9.2.3. Mexico
9.3. Europe
9.3.1. Germany
9.3.2. France
9.3.3. U.K.
9.3.4. Italy
9.3.5. Spain
9.4. Asia-Pacific
9.4.1. Japan
9.4.2. China
9.4.3. India
9.5. South America
9.5.1. Brazil
9.6. Middle East and Africa
9.6.1. UAE
9.6.2. South Africa
10. Global HVDC Cables Market-Competitive Landscape
10.1. Overview
10.2. Market Share of Key Players in Global HVDC Cables Market
10.2.1. Global Company Market Share
10.2.2. North America Company Market Share
10.2.3. Europe Company Market Share
10.2.4. APAC Company Market Share
10.3. Competitive Situations and Trends
10.3.1. Product Launches and Developments
10.3.2. Partnerships, Collaborations, and Agreements
10.3.3. Mergers & Acquisitions
10.3.4. Expansions
11. Company Profiles
11.1. Nexans
11.1.1. Business Overview
11.1.2. Company Snapshot
11.1.3. Company Market Share Analysis
11.1.4. Company Product Portfolio
11.1.5. Recent Developments
11.1.6. SWOT Analysis
11.2. Mitsubishi Corp
11.2.1. Business Overview
11.2.2. Company Snapshot
11.2.3. Company Market Share Analysis
11.2.4. Company Product Portfolio
11.2.5. Recent Developments
11.2.6. SWOT Analysis
11.3. Hitachi Ltd
11.3.1. Business Overview
11.3.2. Company Snapshot
11.3.3. Company Market Share Analysis
11.3.4. Company Product Portfolio
11.3.5. Recent Developments
11.3.6. SWOT Analysis
11.4. General Electric Company
11.4.1. Business Overview
11.4.2. Company Snapshot
11.4.3. Company Market Share Analysis
11.4.4. Company Product Portfolio
11.4.5. Recent Developments
11.4.6. SWOT Analysis
11.5. Siemens AG
11.5.1. Business Overview
11.5.2. Company Snapshot
11.5.3. Company Market Share Analysis
11.5.4. Company Product Portfolio
11.5.5. Recent Developments
11.5.6. SWOT Analysis
11.6. ABB Ltd
11.6.1. Business Overview
11.6.2. Company Snapshot
11.6.3. Company Market Share Analysis
11.6.4. Company Product Portfolio
11.6.5. Recent Developments
11.6.6. SWOT Analysis
11.7. Sumitomo Electric Industries Ltd
11.7.1. Business Overview
11.7.2. Company Snapshot
11.7.3. Company Market Share Analysis
11.7.4. Company Product Portfolio
11.7.5. Recent Developments
11.7.6. SWOT Analysis
11.8. LS Corp
11.8.1. Business Overview
11.8.2. Company Snapshot
11.8.3. Company Market Share Analysis
11.8.4. Company Product Portfolio
11.8.5. Recent Developments
11.8.6. SWOT Analysis
11.9. Prysmian SpA
11.9.1. Business Overview
11.9.2. Company Snapshot
11.9.3. Company Market Share Analysis
11.9.4. Company Product Portfolio
11.9.5. Recent Developments
11.9.6. SWOT Analysis
11.10. J-Power Group
11.10.1. Business Overview
11.10.2. Company Snapshot
11.10.3. Company Market Share Analysis
11.10.4. Company Product Portfolio
11.10.5. Recent Developments
11.10.6. SWOT Analysis
List of Table
1. Global HVDC Cables Market, By Installation, 2020-2033 (USD Billion)
2. Global Subsea, HVDC Cables Market, By Region, 2020-2033 (USD Billion)
3. Global Underground, HVDC Cables Market, By Region, 2020-2033 (USD Billion)
4. Global Overhead, HVDC Cables Market, By Region, 2020-2033 (USD Billion)
5. Global Others, HVDC Cables Market, By Region, 2020-2033 (USD Billion)
6. Global HVDC Cables Market, By Voltage, 2020-2033 (USD Billion)
7. Global High(35 to 475 kv), HVDC Cables Market, By Region, 2020-2033 (USD Billion)
8. Global Extra High(475-600kv), HVDC Cables Market, By Region, 2020-2033 (USD Billion)
9. Global Ultra High(Above 600kv), HVDC Cables Market, By Region, 2020-2033 (USD Billion)
10. Global HVDC Cables Market, By Application, 2020-2033 (USD Billion)
11. Global Telecommunication, HVDC Cables Market, By Region, 2020-2033 (USD Billion)
12. Global Medical, HVDC Cables Market, By Region, 2020-2033 (USD Billion)
13. Global Industrial, HVDC Cables Market, By Region, 2020-2033 (USD Billion)
14. Global Oil & Gas, HVDC Cables Market, By Region, 2020-2033 (USD Billion)
15. Global Others, HVDC Cables Market, By Region, 2020-2033 (USD Billion)
16. North America HVDC Cables Market, By Installation, 2020-2033 (USD Billion)
17. North America HVDC Cables Market, By Voltage, 2020-2033 (USD Billion)
18. North America HVDC Cables Market, By Application, 2020-2033 (USD Billion)
19. U.S. HVDC Cables Market, By Installation, 2020-2033 (USD Billion)
20. U.S. HVDC Cables Market, By Voltage, 2020-2033 (USD Billion)
21. U.S. HVDC Cables Market, By Application, 2020-2033 (USD Billion)
22. Canada HVDC Cables Market, By Installation, 2020-2033 (USD Billion)
23. Canada HVDC Cables Market, By Voltage, 2020-2033 (USD Billion)
24. Canada HVDC Cables Market, By Application, 2020-2033 (USD Billion)
25. Mexico HVDC Cables Market, By Installation, 2020-2033 (USD Billion)
26. Mexico HVDC Cables Market, By Voltage, 2020-2033 (USD Billion)
27. Mexico HVDC Cables Market, By Application, 2020-2033 (USD Billion)
28. Europe HVDC Cables Market, By Installation, 2020-2033 (USD Billion)
29. Europe HVDC Cables Market, By Voltage, 2020-2033 (USD Billion)
30. Europe HVDC Cables Market, By Application, 2020-2033 (USD Billion)
31. Germany HVDC Cables Market, By Installation, 2020-2033 (USD Billion)
32. Germany HVDC Cables Market, By Voltage, 2020-2033 (USD Billion)
33. Germany HVDC Cables Market, By Application, 2020-2033 (USD Billion)
34. France HVDC Cables Market, By Installation, 2020-2033 (USD Billion)
35. France HVDC Cables Market, By Voltage, 2020-2033 (USD Billion)
36. France HVDC Cables Market, By Application, 2020-2033 (USD Billion)
37. U.K. HVDC Cables Market, By Installation, 2020-2033 (USD Billion)
38. U.K. HVDC Cables Market, By Voltage, 2020-2033 (USD Billion)
39. U.K. HVDC Cables Market, By Application, 2020-2033 (USD Billion)
40. Italy HVDC Cables Market, By Installation, 2020-2033 (USD Billion)
41. Italy HVDC Cables Market, By Voltage, 2020-2033 (USD Billion)
42. Italy HVDC Cables Market, By Application, 2020-2033 (USD Billion)
43. Spain HVDC Cables Market, By Installation, 2020-2033 (USD Billion)
44. Spain HVDC Cables Market, By Voltage, 2020-2033 (USD Billion)
45. Spain HVDC Cables Market, By Application, 2020-2033 (USD Billion)
46. Asia Pacific HVDC Cables Market, By Installation, 2020-2033 (USD Billion)
47. Asia Pacific HVDC Cables Market, By Voltage, 2020-2033 (USD Billion)
48. Asia Pacific HVDC Cables Market, By Application, 2020-2033 (USD Billion)
49. Japan HVDC Cables Market, By Installation, 2020-2033 (USD Billion)
50. Japan HVDC Cables Market, By Voltage, 2020-2033 (USD Billion)
51. Japan HVDC Cables Market, By Application, 2020-2033 (USD Billion)
52. China HVDC Cables Market, By Installation, 2020-2033 (USD Billion)
53. China HVDC Cables Market, By Voltage, 2020-2033 (USD Billion)
54. China HVDC Cables Market, By Application, 2020-2033 (USD Billion)
55. India HVDC Cables Market, By Installation, 2020-2033 (USD Billion)
56. India HVDC Cables Market, By Voltage, 2020-2033 (USD Billion)
57. India HVDC Cables Market, By Application, 2020-2033 (USD Billion)
58. South America HVDC Cables Market, By Installation, 2020-2033 (USD Billion)
59. South America HVDC Cables Market, By Voltage, 2020-2033 (USD Billion)
60. South America HVDC Cables Market, By Application, 2020-2033 (USD Billion)
61. Brazil HVDC Cables Market, By Installation, 2020-2033 (USD Billion)
62. Brazil HVDC Cables Market, By Voltage, 2020-2033 (USD Billion)
63. Brazil HVDC Cables Market, By Application, 2020-2033 (USD Billion)
64. Middle East and Africa HVDC Cables Market, By Installation, 2020-2033 (USD Billion)
65. Middle East and Africa HVDC Cables Market, By Voltage, 2020-2033 (USD Billion)
66. Middle East and Africa HVDC Cables Market, By Application, 2020-2033 (USD Billion)
67. UAE HVDC Cables Market, By Installation, 2020-2033 (USD Billion)
68. UAE HVDC Cables Market, By Voltage, 2020-2033 (USD Billion)
69. UAE HVDC Cables Market, By Application, 2020-2033 (USD Billion)
70. South Africa HVDC Cables Market, By Installation, 2020-2033 (USD Billion)
71. South Africa HVDC Cables Market, By Voltage, 2020-2033 (USD Billion)
72. South Africa HVDC Cables Market, By Application, 2020-2033 (USD Billion)
List of Figures
1. Global HVDC Cables Market Segmentation
2. Global HVDC Cables Market: Research Methodology
3. Market Size Estimation Methodology: Bottom-Up Approach
4. Market Size Estimation Methodology: Top-Down Approach
5. Data Triangulation
6. Porter’s Five Forces Analysis
7. Value Chain Analysis
8. Global HVDC Cables Market Attractiveness Analysis By Installation
9. Global HVDC Cables Market Attractiveness Analysis By Voltage
10. Global HVDC Cables Market Attractiveness Analysis By Application
11. Global HVDC Cables Market Attractiveness Analysis By Region
12. Global HVDC Cables Market: Dynamics
13. Global HVDC Cables Market Share By Installation (2023 & 2033)
14. Global HVDC Cables Market Share By Voltage (2023 & 2033)
15. Global HVDC Cables Market Share By Application (2023 & 2033)
16. Global HVDC Cables Market Share By Regions (2023 & 2033)
17. Global HVDC Cables Market Share By Company (2023)
This study forecasts revenue at global, regional, and country levels from 2019 to 2032. The Brainy Insights has segmented the global HVDC Cables market based on below mentioned segments:
Global HVDC Cables Market by Installation:
Global HVDC Cables Market by Voltage:
Global HVDC Cables Market by Application:
Global HVDC Cables by Region:
Research has its special purpose to undertake marketing efficiently. In this competitive scenario, businesses need information across all industry verticals; the information about customer wants, market demand, competition, industry trends, distribution channels etc. This information needs to be updated regularly because businesses operate in a dynamic environment. Our organization, The Brainy Insights incorporates scientific and systematic research procedures in order to get proper market insights and industry analysis for overall business success. The analysis consists of studying the market from a miniscule level wherein we implement statistical tools which helps us in examining the data with accuracy and precision.
Our research reports feature both; quantitative and qualitative aspects for any market. Qualitative information for any market research process are fundamental because they reveal the customer needs and wants, usage and consumption for any product/service related to a specific industry. This in turn aids the marketers/investors in knowing certain perceptions of the customers. Qualitative research can enlighten about the different product concepts and designs along with unique service offering that in turn, helps define marketing problems and generate opportunities. On the other hand, quantitative research engages with the data collection process through interviews, e-mail interactions, surveys and pilot studies. Quantitative aspects for the market research are useful to validate the hypotheses generated during qualitative research method, explore empirical patterns in the data with the help of statistical tools, and finally make the market estimations.
The Brainy Insights offers comprehensive research and analysis, based on a wide assortment of factual insights gained through interviews with CXOs and global experts and secondary data from reliable sources. Our analysts and industry specialist assume vital roles in building up statistical tools and analysis models, which are used to analyse the data and arrive at accurate insights with exceedingly informative research discoveries. The data provided by our organization have proven precious to a diverse range of companies, facilitating them to address issues such as determining which products/services are the most appealing, whether or not customers use the product in the manner anticipated, the purchasing intentions of the market and many others.
Our research methodology encompasses an idyllic combination of primary and secondary initiatives. Key phases involved in this process are listed below:

The phase involves the gathering and collecting of market data and its related information with the help of different sources & research procedures.

The data procurement stage involves in data gathering and collecting through various data sources.
This stage involves in extensive research. These data sources includes:
Purchased Database: Purchased databases play a crucial role in estimating the market sizes irrespective of the domain. Our purchased database includes:
Primary Research: The Brainy Insights interacts with leading companies and experts of the concerned domain to develop the analyst team’s market understanding and expertise. It improves and substantiates every single data presented in the market reports. Primary research mainly involves in telephonic interviews, E-mail interactions and face-to-face interviews with the raw material providers, manufacturers/producers, distributors, & independent consultants. The interviews that we conduct provides valuable data on market size and industry growth trends prevailing in the market. Our organization also conducts surveys with the various industry experts in order to gain overall insights of the industry/market. For instance, in healthcare industry we conduct surveys with the pharmacists, doctors, surgeons and nurses in order to gain insights and key information of a medical product/device/equipment which the customers are going to usage. Surveys are conducted in the form of questionnaire designed by our own analyst team. Surveys plays an important role in primary research because surveys helps us to identify the key target audiences of the market. Additionally, surveys helps to identify the key target audience engaged with the market. Our survey team conducts the survey by targeting the key audience, thus gaining insights from them. Based on the perspectives of the customers, this information is utilized to formulate market strategies. Moreover, market surveys helps us to understand the current competitive situation of the industry. To be precise, our survey process typically involve with the 360 analysis of the market. This analytical process begins by identifying the prospective customers for a product or service related to the market/industry to obtain data on how a product/service could fit into customers’ lives.

Secondary Research: The secondary data sources includes information published by the on-profit organizations such as World bank, WHO, company fillings, investor presentations, annual reports, national government documents, statistical databases, blogs, articles, white papers and others. From the annual report, we analyse a company’s revenue to understand the key segment and market share of that organization in a particular region. We analyse the company websites and adopt the product mapping technique which is important for deriving the segment revenue. In the product mapping method, we select and categorize the products offered by the companies catering to domain specific market, deduce the product revenue for each of the companies so as to get overall estimation of the market size. We also source data and analyses trends based on information received from supply side and demand side intermediaries in the value chain. The supply side denotes the data gathered from supplier, distributor, wholesaler and the demand side illustrates the data gathered from the end customers for respective market domain.

The supply side for a domain specific market is analysed by:
The demand side for the market is estimated through:
In-house Library: Apart from these third-party sources, we have our in-house library of qualitative and quantitative information. Our in-house database includes market data for various industry and domains. These data are updated on regular basis as per the changing market scenario. Our library includes, historic databases, internal audit reports and archives.
Sometimes there are instances where there is no metadata or raw data available for any domain specific market. For those cases, we use our expertise to forecast and estimate the market size in order to generate comprehensive data sets. Our analyst team adopt a robust research technique in order to produce the estimates:
Data Synthesis: This stage involves the analysis & mapping of all the information obtained from the previous step. It also involves in scrutinizing the data for any discrepancy observed while data gathering related to the market. The data is collected with consideration to the heterogeneity of sources. Robust scientific techniques are in place for synthesizing disparate data sets and provide the essential contextual information that can orient market strategies. The Brainy Insights has extensive experience in data synthesis where the data passes through various stages:


Market Deduction & Formulation: The final stage comprises of assigning data points at appropriate market spaces so as to deduce feasible conclusions. Analyst perspective & subject matter expert based holistic form of market sizing coupled with industry analysis also plays a crucial role in this stage.
This stage involves in finalization of the market size and numbers that we have collected from data integration step. With data interpolation, it is made sure that there is no gap in the market data. Successful trend analysis is done by our analysts using extrapolation techniques, which provide the best possible forecasts for the market.
Data Validation & Market Feedback: Validation is the most important step in the process. Validation & re-validation via an intricately designed process helps us finalize data-points to be used for final calculations.

The Brainy Insights interacts with leading companies and experts of the concerned domain to develop the analyst team’s market understanding and expertise. It improves and substantiates every single data presented in the market reports. The data validation interview and discussion panels are typically composed of the most experienced industry members. The participants include, however, are not limited to:
Moreover, we always validate our data and findings through primary respondents from all the major regions we are working on.


Free Customization
Fortune 500 Clients
Free Yearly Update On Purchase Of Multi/Corporate License
Companies Served Till Date