- +1-315-215-1633
- sales@thebrainyinsights.com

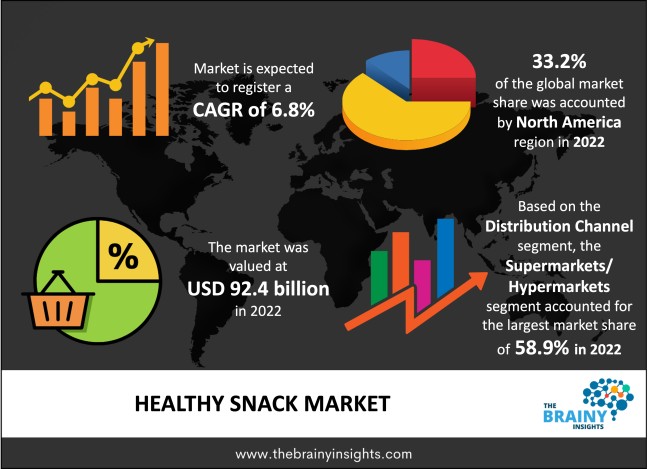
The global healthy snack market was valued at USD 92.4 billion in 2022 and grew at a CAGR of 6.8% from 2023 to 2032. The market is expected to reach USD 178.3 billion by 2032. Because of the ongoing change in consumption habits and preference for healthier food items, the global snacking business is significantly expanding. Today's consumers seek out delicious, convenient, and inexpensive snacks that will meet their daily nutritional requirements. The usage of raw materials, processing, innovations in preservation, and creative packaging methods are all contributing to the food industry's fast evolution. This has sparked new ideas and the creation of cutting-edge food options that are advancing the global snacking market. The expansion of e-commerce platforms and distribution network channels is also anticipated to have a positive impact on the worldwide market for healthy snacks.
Consumers are actively looking for snacks that support their wellness objectives as their concern for their health grows. They are seeking snacks that are high in nutrition, fiber, and protein but low in fat, sugar, and artificial additives. The need for easy-to-carry, portable snacks which can be enjoyed while on the go has grown as a result of busy lives and an increase in snacking situations. Granola bars, trail mixes, single-serve fruit packs, and pre-cut veggies are examples of healthy snack items that meet this demand.
Get an overview of this study by requesting a free sample
The market for healthy snacks has been significantly influenced by rising awareness of the value of leading a healthy lifestyle and making informed dietary decisions. Consumers are actively looking for healthier alternatives to typical snacks as they are more aware of how their dietary choices affect their overall health. Additionally, the market for snacks that accommodate these dietary choices has increased as more individuals choose specialized diets including veganism, vegetarianism, gluten-free eating, and dairy-free eating. People seeking acceptable solutions choose healthy snacks that adhere to particular nutritional needs.
Pricewise, healthy snacks are sometimes more expensive than conventional munchies. For customers who are concerned about costs and might put affordability over healthy alternatives, this might be a barrier. Healthy snacks may cost more since they need more money to produce and package as well as to get premium ingredients.
Businesses have plenty of room to innovate and create new, distinctive healthy snack items which stand out in terms of flavor, texture, and nutritional composition. Consumers searching for fresh and interesting alternatives might be drawn in by developing distinctive tastes, utilizing useful components, and experimenting with different snack forms. Customers that adhere to certain diets, such as those that are vegan, gluten-free, or keto, make up a rising market sector. Creating snacks that satisfy these particular dietary tastes and requirements might help businesses reach specialized markets and build a devoted consumer base.
North America led the market in 2022 with the largest market share of 33.2%. The COVID-19 pandemic has caused a sharp increase in demand for nutritious snacks in the United States. The United States already consumed a lot of snacks, but consumers are now more concerned about eating wholesome snacks to avoid the many health hazards associated with over-snacking. Another important aspect that has boosted the market's sales in the area is the high abundance rates of supermarkets and hypermarkets, as well as convenience stores. To increase their online presence, these convenience businesses are working with delivery services. For instance, through its agreement with 7-Eleven, Inc., Instacart, a grocery delivery and pick-up service provider in the United States and Canada, joined the convenience store sector in September 2020.
North America Region Healthy Snack Market Share in 2022 - 33.2%
www.thebrainyinsights.com
Check the geographical analysis of this market by requesting a free sample
The savory segment dominated the global market in 2022 with a market share of 38.3%. Working-class folks and recent graduates of the college, for whom wholesome savory snack items have developed as an alternative to a meal, are the segment's main consumers. People may satisfy their appetites with savory snacks, which also helps them avoid overeating at meals. Businesses are working on baked chips that are all-natural, non-GMO, multigrain, low in salt, and offer a variety of health advantages. These low-fat, high-protein chips are frequently made with ragi, soya, and veggies.
The Supermarkets/hypermarkets segment dominated the global market in 2022 with a market share of 58.9%. The dominance of this distribution channel is largely attributed to the large number of hypermarkets and supermarkets that are present around the world. For instance, 7-Eleven is one of the biggest grocery chains in the world. In 16 countries, it has more than 46,000 locations. Furthermore, industry expansion is being further accentuated by the swift development of retail infrastructure in developing nations. Additionally, grocery chains are following the trend of rapid delivery services as they seek to increase their value globally. In recent months, a growing number of supermarkets have formed partnerships with or made investments in sizable quick delivery startups. While delivery services profit from their present supply chains to expand their distribution networks and reduce market competition, supermarkets benefit from them to increase their profits.
| Attribute | Description |
|---|---|
| Market Size | Revenue (USD Billion) |
| Market size value in 2022 | USD 92.4 Billion |
| Market size value in 2032 | USD 178.3 Billion |
| CAGR (2023 to 2032) | 6.8% |
| Historical data | 2019-2021 |
| Base Year | 2022 |
| Forecast | 2023-2032 |
| Region | The regions analyzed for the market are Asia Pacific, Europe, South America, North America, and Middle East & Africa. Furthermore, the regions are further analyzed at the country level. |
| Segments | Product, Distribution Channel |
As per The Brainy Insights, the size of the healthy snack market was valued at USD 92.4 billion in 2022 to USD 178.3 billion by 2032.
The global healthy snack market is growing at a CAGR of 6.8% during the forecast period 2023-2032.
The North American region emerged as the largest market for the healthy snack.
The rising awareness of the value of leading a healthy lifestyle will influence the market's growth.
1. Introduction
1.1. Objectives of the Study
1.2. Market Definition
1.3. Research Scope
1.4. Currency
1.5. Key Target Audience
2. Research Methodology and Assumptions
3. Executive Summary
4. Premium Insights
4.1. Porter’s Five Forces Analysis
4.2. Value Chain Analysis
4.3. Top Investment Pockets
4.3.1. Market Attractiveness Analysis by Product
4.3.2. Market Attractiveness Analysis by Distribution Channel
4.3.3. Market Attractiveness Analysis by Region
4.4. Industry Trends
5. Market Dynamics
5.1. Market Evaluation
5.2. Drivers
5.2.1. Rising awareness of the value of leading a healthy lifestyle
5.3. Restraints
5.3.1. High Cost
5.4. Opportunities
5.4.1. Development of new Healthy Snack
5.5. Challenges
5.5.1. Limited shelf Life
6. Global Healthy Snack Market Analysis and Forecast, By Product
6.1. Segment Overview
6.2. Fruit
6.3. Savory
6.4. Confectionery
6.5. Dairy
6.6. Frozen & Refrigerated
6.7. Bakery
6.8. Others
7. Global Healthy Snack Market Analysis and Forecast, By Distribution Channel
7.1. Segment Overview
7.2. Supermarkets/Hypermarkets
7.3. Convenience Stores
7.4. Online
7.5. Others
8. Global Healthy Snack Market Analysis and Forecast, By Regional Analysis
8.1. Segment Overview
8.2. North America
8.2.1. U.S.
8.2.2. Canada
8.2.3. Mexico
8.3. Europe
8.3.1. Germany
8.3.2. France
8.3.3. U.K.
8.3.4. Italy
8.3.5. Spain
8.4. Asia-Pacific
8.4.1. Japan
8.4.2. China
8.4.3. India
8.5. South America
8.5.1. Brazil
8.6. Middle East and Africa
8.6.1. UAE
8.6.2. South Africa
9. Global Healthy Snack Market-Competitive Landscape
9.1. Overview
9.2. Market Share of Key Players in the Healthy Snack Market
9.2.1. Global Company Market Share
9.2.2. North America Company Market Share
9.2.3. Europe Company Market Share
9.2.4. APAC Company Market Share
9.3. Competitive Situations and Trends
9.3.1. Product Launches and Developments
9.3.2. Partnerships, Collaborations, and Agreements
9.3.3. Mergers & Acquisitions
9.3.4. Expansions
10. Company Profiles
10.1. B&G Foods
10.1.1. Business Overview
10.1.2. Company Snapshot
10.1.3. Company Market Share Analysis
10.1.4. Company Product Portfolio
10.1.5. Recent Developments
10.1.6. SWOT Analysis
10.2. Del Monte Foods, Inc.
10.2.1. Business Overview
10.2.2. Company Snapshot
10.2.3. Company Market Share Analysis
10.2.4. Company Product Portfolio
10.2.5. Recent Developments
10.2.6. SWOT Analysis
10.3. Dole Packaged Foods, LLC.
10.3.1. Business Overview
10.3.2. Company Snapshot
10.3.3. Company Market Share Analysis
10.3.4. Company Product Portfolio
10.3.5. Recent Developments
10.3.6. SWOT Analysis
10.4. Hormel Foods Corporation
10.4.1. Business Overview
10.4.2. Company Snapshot
10.4.3. Company Market Share Analysis
10.4.4. Company Product Portfolio
10.4.5. Recent Developments
10.4.6. SWOT Analysis
10.5. Monsoon Harvest
10.5.1. Business Overview
10.5.2. Company Snapshot
10.5.3. Company Market Share Analysis
10.5.4. Company Product Portfolio
10.5.5. Recent Developments
10.5.6. SWOT Analysis
10.6. Select Harvests
10.6.1. Business Overview
10.6.2. Company Snapshot
10.6.3. Company Market Share Analysis
10.6.4. Company Product Portfolio
10.6.5. Recent Developments
10.6.6. SWOT Analysis
10.7. Nestlé
10.7.1. Business Overview
10.7.2. Company Snapshot
10.7.3. Company Market Share Analysis
10.7.4. Company Product Portfolio
10.7.5. Recent Developments
10.7.6. SWOT Analysis
10.8. The Kellogg Company
10.8.1. Business Overview
10.8.2. Company Snapshot
10.8.3. Company Market Share Analysis
10.8.4. Company Product Portfolio
10.8.5. Recent Developments
10.8.6. SWOT Analysis
10.9. Unilever
10.9.1. Business Overview
10.9.2. Company Snapshot
10.9.3. Company Market Share Analysis
10.9.4. Company Product Portfolio
10.9.5. Recent Developments
10.9.6. SWOT Analysis
10.10. Danone
10.10.1. Business Overview
10.10.2. Company Snapshot
10.10.3. Company Market Share Analysis
10.10.4. Company Product Portfolio
10.10.5. Recent Developments
10.10.6. SWOT Analysis
10.11. PepsiCo
10.11.1. Business Overview
10.11.2. Company Snapshot
10.11.3. Company Market Share Analysis
10.11.4. Company Product Portfolio
10.11.5. Recent Developments
10.11.6. SWOT Analysis
10.12. Mondelēz International
10.12.1. Business Overview
10.12.2. Company Snapshot
10.12.3. Company Market Share Analysis
10.12.4. Company Product Portfolio
10.12.5. Recent Developments
10.12.6. SWOT Analysis
List of Table
1. Global Healthy Snack Market, By Product, 2019-2032 (USD Billion)
2. Global Fruit, Healthy Snack Market, By Region, 2019-2032 (USD Billion)
3. Global Savory, Healthy Snack Market, By Region, 2019-2032 (USD Billion)
4. Global Confectionery, Healthy Snack Market, By Region, 2019-2032 (USD Billion)
5. Global Dairy, Healthy Snack Market, By Region, 2019-2032 (USD Billion)
6. Global Frozen & Refrigerated, Healthy Snack Market, By Region, 2019-2032 (USD Billion)
7. Global Bakery, Healthy Snack Market, By Region, 2019-2032 (USD Billion)
8. Global Others, Healthy Snack Market, By Region, 2019-2032 (USD Billion)
9. Global Healthy Snack Market, By Distribution Channel, 2019-2032 (USD Billion)
10. Global Supermarkets/Hypermarkets, Healthy Snack Market, By Region, 2019-2032 (USD Billion)
11. Global Convenience Stores, Healthy Snack Market, By Region, 2019-2032 (USD Billion)
12. Global Online, Healthy Snack Market, By Region, 2019-2032 (USD Billion)
13. Global Others, Healthy Snack Market, By Region, 2019-2032 (USD Billion)
14. Global Healthy Snack Market, By Region, 2019-2032 (USD Billion)
15. North America Healthy Snack Market, By Product, 2019-2032 (USD Billion)
16. North America Healthy Snack Market, By Distribution Channel, 2019-2032 (USD Billion)
17. U.S. Healthy Snack Market, By Product, 2019-2032 (USD Billion)
18. U.S. Healthy Snack Market, By Distribution Channel, 2019-2032 (USD Billion)
19. Canada Healthy Snack Market, By Product, 2019-2032 (USD Billion)
20. Canada Healthy Snack Market, By Distribution Channel, 2019-2032 (USD Billion)
21. Mexico Healthy Snack Market, By Product, 2019-2032 (USD Billion)
22. Mexico Healthy Snack Market, By Distribution Channel, 2019-2032 (USD Billion)
23. Europe Healthy Snack Market, By Product, 2019-2032 (USD Billion)
24. Europe Healthy Snack Market, By Distribution Channel, 2019-2032 (USD Billion)
25. Germany Healthy Snack Market, By Product, 2019-2032 (USD Billion)
26. Germany Healthy Snack Market, By Distribution Channel, 2019-2032 (USD Billion)
27. France Healthy Snack Market, By Product, 2019-2032 (USD Billion)
28. France Healthy Snack Market, By Distribution Channel, 2019-2032 (USD Billion)
29. U.K. Healthy Snack Market, By Product, 2019-2032 (USD Billion)
30. U.K. Healthy Snack Market, By Distribution Channel, 2019-2032 (USD Billion)
31. Italy Healthy Snack Market, By Product, 2019-2032 (USD Billion)
32. Italy Healthy Snack Market, By Distribution Channel, 2019-2032 (USD Billion)
33. Spain Healthy Snack Market, By Product, 2019-2032 (USD Billion)
34. Spain Healthy Snack Market, By Distribution Channel, 2019-2032 (USD Billion)
35. Asia Pacific Healthy Snack Market, By Product, 2019-2032 (USD Billion)
36. Asia Pacific Healthy Snack Market, By Distribution Channel, 2019-2032 (USD Billion)
37. Japan Healthy Snack Market, By Product, 2019-2032 (USD Billion)
38. Japan Healthy Snack Market, By Distribution Channel, 2019-2032 (USD Billion)
39. China Healthy Snack Market, By Product, 2019-2032 (USD Billion)
40. China Healthy Snack Market, By Distribution Channel, 2019-2032 (USD Billion)
41. India Healthy Snack Market, By Product, 2019-2032 (USD Billion)
42. India Healthy Snack Market, By Distribution Channel, 2019-2032 (USD Billion)
43. South America Healthy Snack Market, By Product, 2019-2032 (USD Billion)
44. South America Healthy Snack Market, By Distribution Channel, 2019-2032 (USD Billion)
45. Brazil Healthy Snack Market, By Product, 2019-2032 (USD Billion)
46. Brazil Healthy Snack Market, By Distribution Channel, 2019-2032 (USD Billion)
47. Middle East and Africa Healthy Snack Market, By Product, 2019-2032 (USD Billion)
48. Middle East and Africa Healthy Snack Market, By Distribution Channel, 2019-2032 (USD Billion)
49. UAE Healthy Snack Market, By Product, 2019-2032 (USD Billion)
50. UAE Healthy Snack Market, By Distribution Channel, 2019-2032 (USD Billion)
51. South Africa Healthy Snack Market, By Product, 2019-2032 (USD Billion)
52. South Africa Healthy Snack Market, By Distribution Channel, 2019-2032 (USD Billion)
List of Figures
1. Global Healthy Snack Market Segmentation
2. Healthy Snack Market: Research Methodology
3. Market Size Estimation Methodology: Bottom-Up Approach
4. Market Size Estimation Methodology: Top-Down Approach
5. Data Triangulation
6. Porter’s Five Forces Analysis
7. Value Chain Analysis
8. Global Healthy Snack Market Attractiveness Analysis by Product
9. Global Healthy Snack Market Attractiveness Analysis by Distribution Channel
10. Global Healthy Snack Market Attractiveness Analysis by Region
11. Global Healthy Snack Market: Dynamics
12. Global Healthy Snack Market Share by Product (2022 & 2032)
13. Global Healthy Snack Market Share by Distribution Channel (2022 & 2032)
14. Global Healthy Snack Market Share by Regions (2022 & 2032)
15. Global Healthy Snack Market Share by Company (2022)
This study forecasts revenue at global, regional, and country levels from 2019 to 2032. The Brainy Insights has segmented the global healthy snack market based on below-mentioned segments:
Global Healthy Snack Market by Product:
Global Healthy Snack Market by Distribution Channel:
Global Healthy Snack Market by Region:
Research has its special purpose to undertake marketing efficiently. In this competitive scenario, businesses need information across all industry verticals; the information about customer wants, market demand, competition, industry trends, distribution channels etc. This information needs to be updated regularly because businesses operate in a dynamic environment. Our organization, The Brainy Insights incorporates scientific and systematic research procedures in order to get proper market insights and industry analysis for overall business success. The analysis consists of studying the market from a miniscule level wherein we implement statistical tools which helps us in examining the data with accuracy and precision.
Our research reports feature both; quantitative and qualitative aspects for any market. Qualitative information for any market research process are fundamental because they reveal the customer needs and wants, usage and consumption for any product/service related to a specific industry. This in turn aids the marketers/investors in knowing certain perceptions of the customers. Qualitative research can enlighten about the different product concepts and designs along with unique service offering that in turn, helps define marketing problems and generate opportunities. On the other hand, quantitative research engages with the data collection process through interviews, e-mail interactions, surveys and pilot studies. Quantitative aspects for the market research are useful to validate the hypotheses generated during qualitative research method, explore empirical patterns in the data with the help of statistical tools, and finally make the market estimations.
The Brainy Insights offers comprehensive research and analysis, based on a wide assortment of factual insights gained through interviews with CXOs and global experts and secondary data from reliable sources. Our analysts and industry specialist assume vital roles in building up statistical tools and analysis models, which are used to analyse the data and arrive at accurate insights with exceedingly informative research discoveries. The data provided by our organization have proven precious to a diverse range of companies, facilitating them to address issues such as determining which products/services are the most appealing, whether or not customers use the product in the manner anticipated, the purchasing intentions of the market and many others.
Our research methodology encompasses an idyllic combination of primary and secondary initiatives. Key phases involved in this process are listed below:

The phase involves the gathering and collecting of market data and its related information with the help of different sources & research procedures.

The data procurement stage involves in data gathering and collecting through various data sources.
This stage involves in extensive research. These data sources includes:
Purchased Database: Purchased databases play a crucial role in estimating the market sizes irrespective of the domain. Our purchased database includes:
Primary Research: The Brainy Insights interacts with leading companies and experts of the concerned domain to develop the analyst team’s market understanding and expertise. It improves and substantiates every single data presented in the market reports. Primary research mainly involves in telephonic interviews, E-mail interactions and face-to-face interviews with the raw material providers, manufacturers/producers, distributors, & independent consultants. The interviews that we conduct provides valuable data on market size and industry growth trends prevailing in the market. Our organization also conducts surveys with the various industry experts in order to gain overall insights of the industry/market. For instance, in healthcare industry we conduct surveys with the pharmacists, doctors, surgeons and nurses in order to gain insights and key information of a medical product/device/equipment which the customers are going to usage. Surveys are conducted in the form of questionnaire designed by our own analyst team. Surveys plays an important role in primary research because surveys helps us to identify the key target audiences of the market. Additionally, surveys helps to identify the key target audience engaged with the market. Our survey team conducts the survey by targeting the key audience, thus gaining insights from them. Based on the perspectives of the customers, this information is utilized to formulate market strategies. Moreover, market surveys helps us to understand the current competitive situation of the industry. To be precise, our survey process typically involve with the 360 analysis of the market. This analytical process begins by identifying the prospective customers for a product or service related to the market/industry to obtain data on how a product/service could fit into customers’ lives.

Secondary Research: The secondary data sources includes information published by the on-profit organizations such as World bank, WHO, company fillings, investor presentations, annual reports, national government documents, statistical databases, blogs, articles, white papers and others. From the annual report, we analyse a company’s revenue to understand the key segment and market share of that organization in a particular region. We analyse the company websites and adopt the product mapping technique which is important for deriving the segment revenue. In the product mapping method, we select and categorize the products offered by the companies catering to domain specific market, deduce the product revenue for each of the companies so as to get overall estimation of the market size. We also source data and analyses trends based on information received from supply side and demand side intermediaries in the value chain. The supply side denotes the data gathered from supplier, distributor, wholesaler and the demand side illustrates the data gathered from the end customers for respective market domain.

The supply side for a domain specific market is analysed by:
The demand side for the market is estimated through:
In-house Library: Apart from these third-party sources, we have our in-house library of qualitative and quantitative information. Our in-house database includes market data for various industry and domains. These data are updated on regular basis as per the changing market scenario. Our library includes, historic databases, internal audit reports and archives.
Sometimes there are instances where there is no metadata or raw data available for any domain specific market. For those cases, we use our expertise to forecast and estimate the market size in order to generate comprehensive data sets. Our analyst team adopt a robust research technique in order to produce the estimates:
Data Synthesis: This stage involves the analysis & mapping of all the information obtained from the previous step. It also involves in scrutinizing the data for any discrepancy observed while data gathering related to the market. The data is collected with consideration to the heterogeneity of sources. Robust scientific techniques are in place for synthesizing disparate data sets and provide the essential contextual information that can orient market strategies. The Brainy Insights has extensive experience in data synthesis where the data passes through various stages:


Market Deduction & Formulation: The final stage comprises of assigning data points at appropriate market spaces so as to deduce feasible conclusions. Analyst perspective & subject matter expert based holistic form of market sizing coupled with industry analysis also plays a crucial role in this stage.
This stage involves in finalization of the market size and numbers that we have collected from data integration step. With data interpolation, it is made sure that there is no gap in the market data. Successful trend analysis is done by our analysts using extrapolation techniques, which provide the best possible forecasts for the market.
Data Validation & Market Feedback: Validation is the most important step in the process. Validation & re-validation via an intricately designed process helps us finalize data-points to be used for final calculations.

The Brainy Insights interacts with leading companies and experts of the concerned domain to develop the analyst team’s market understanding and expertise. It improves and substantiates every single data presented in the market reports. The data validation interview and discussion panels are typically composed of the most experienced industry members. The participants include, however, are not limited to:
Moreover, we always validate our data and findings through primary respondents from all the major regions we are working on.


Free Customization
Fortune 500 Clients
Free Yearly Update On Purchase Of Multi/Corporate License
Companies Served Till Date