- +1-315-215-1633
- sales@thebrainyinsights.com

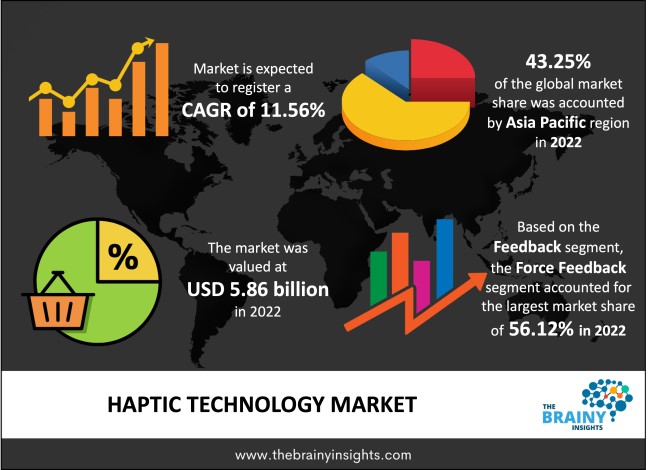
The global haptic technology market was valued at USD 5.86 billion in 2022, growing at a CAGR of 11.56% from 2023 to 2032. The market is expected to reach USD 17.49 billion by 2032. The growth of haptic technology is increasing the adoption of haptic technology in multiple gaming applications with AR/VR-enabled instruments to provide immersive gaming experiences, propelling the growth in the market.
Haptic technology, or 3D touch or kinaesthetic communication, can make an experience of touch by applying motions, vibrations, or forces to the user. Haptic technology recreates the sense of touch via a vibration or other means. Haptic technology acts as an interface between the user & the connected machine, providing forced or tactile feedback to the users. Haptics find broad applications and is known to improve the user experience by engaging sound, light, and touch, especially in joysticks, video game controllers, and steering wheels. Haptic technology delivers flexibility in the military field, including training in a virtual reality environment. Haptic science also affects tactile feedback, such as air pressure or sound waves. Game controllers, wearables, phones, virtual reality, the automobile industry, and many more fields employ haptic technology broadly.
Get an overview of this study by requesting a free sample
The rising use of haptic technology in the medical and robotics industry: The rising use of haptics in gaming consoles for an immersive experience drives market growth. Further, the rising usage of household electronic devices, e.g. laptops, smartphones, and other wearable gadgets, are helping to drive the market growth over the forecast period. Also, medical wearables and haptics will transform the healthcare sector and propel market growth. Additionally, the haptic has vast scope in engineering applications and design, propelling the market growth.
The high implementation cost of haptic: The high cost of technology & technical challenges related to product design is restraining market growth factors. Moreover, the increasing design complexity and maintenance costs are hindering market growth. Additionally, the price of employing haptic technology is not excessive, but the market for haptic technology has been harshly restricted by the expense of force-feedback haptic machines, which are more costly than tactile information haptic machines.
The electronics industry's adoption of technology: The rapidly increasing usage of education display technology and the high demand from the holographic display industry are opportunities for market growth. Moreover, the electronics industry's adoption of the technology is anticipated to be accelerated by its different advantages, including sound, improved touchscreen, and visual effects in display touch applications are helping to boost the market growth. The escalating usage of haptics in home appliances & education stimulates market growth. Moreover, the rising demand for wearable devices and the prevalence of different customer electronics manufacturers are helping to boost the market growth. However, haptic technology permits users to reproduce the tactile touch through a series of actions, including force & vibration. Haptic sensors are revolutionizing the automotive industry by allowing drivers to make informed decisions. It also assists in providing an intuitive & seamless experience. These factors are stimulating the market growth over the projection period.
The regions analyzed for the market include North America, Europe, South America, Asia Pacific, the Middle East, and Africa. Asia Pacific emerged as the largest global haptic technology market, with a 43.25% share of the market revenue in 2022.
The Asia-Pacific region will account for the largest market share with revenue growth. This growth is attributed to the presence of a strong electronics manufacturing base in Japan and China. Moreover, leading smartphone manufacturers such as Huawei, Vivo, Xiaomi, Oppo, and OnePlus are stimulating market growth. Also, the increasing integration of innovative technologies, including infotainment systems & touchscreen-enabled in automotive industries, is expected to drive market growth in this region.
Asia Pacific Region Haptic Technology Market Share in 2022 - 43.25%
www.thebrainyinsights.com
Check the geographical analysis of this market by requesting a free sample
The feedback segment is divided into force feedback and tactile feedback. The force feedback segment dominated the market, with a market share of around 56.12% in 2022. This growth is attributed to the increasing demand for high-quality graphical images and 3D animations in video games & manufacturing industries. Force feedback haptic technology is a type of haptic technology that provides tactile or forced feedback to the user. This can be used to provide feedback for simulation, games, virtual reality, training, and other applications. It also provides feedback for medical methods & other medical machines. Additionally, the increasing consumer demand for simulating smartphone touch experiences and offering personalized texts and notifications are expected to propel the tactile feedback segment market growth.
The component segment is divided into actuators, microcontrollers, software, drivers, and others. The software segment dominated the market, with a market share of around 25.29% in 2022. This growth is attributed to the increasing application of haptic technology in electronic devices.
The application segment is divided into consumer electronics, automotive & transportation, healthcare, gaming, education & research, engineering, and others. The consumer electronics segment dominated, with a market share of around 21.16% in 2022. This growth is attributed to the rising use of consumer electronics such as smartphones, wearables, watches, and wristbands. Further, by 2032, the automotive & transportation segment will likely dominate the market due to the increasing demand for haptic technology devices in cars that provide a realistic sense of touch for driving and gaming purposes.
| Attribute | Description |
|---|---|
| Market Size | Revenue (USD Billion) |
| Market size value in 2022 | USD 5.86 Billion |
| Market size value in 2032 | USD 17.49 Billion |
| CAGR (2023 to 2032) | 11.56% |
| Historical data | 2019-2021 |
| Base Year | 2022 |
| Forecast | 2023-2032 |
| Regional Segments | The regions analyzed for the market are Asia Pacific, Europe, South America, North America, and Middle East & Africa. Furthermore, the regions are further analyzed at the country level. |
| Segments | Feedback, Component, Application |
As per The Brainy Insights, the size of the haptic technology market was valued at 5.86 billion in 2022 to USD 17.49 billion by 2032.
Global haptic technology market is growing at a CAGR of 11.56% during the forecast period 2022-2032.
Asia Pacific region emerged as the largest market for the haptic technology.
1. Introduction
1.1. Objectives of the Study
1.2. Market Definition
1.3. Research Scope
1.4. Currency
1.5. Key Target Audience
2. Research Methodology and Assumptions
3. Executive Summary
4. Premium Insights
4.1. Porter’s Five Forces Analysis
4.2. Value Chain Analysis
4.3. Top Investment Pockets
4.3.1. Market Attractiveness Analysis By Feedback
4.3.2. Market Attractiveness Analysis By Component
4.3.3. Market Attractiveness Analysis By Application
4.3.4. Market Attractiveness Analysis By Region
4.4. Industry Trends
5. Market Dynamics
5.1. Market Evaluation
5.2. Drivers
5.2.1. The growing income levels
5.2.2. The rising demand for loT devices
5.2.3. The rising applications in robotic industries
5.3. Restraints
5.3.1. The high implementation cost of haptic
5.3.2. The high-power consumption of haptic devices
5.4. Opportunities
5.4.1. The rising demand for wearable devices
5.4.2. The electronics industry's adoption of the technology
6. Global Haptic Technology Market Analysis and Forecast, By Feedback
6.1. Segment Overview
6.2. Force Feedback
6.3. Tactile Feedback
7. Global Haptic Technology Market Analysis and Forecast, By Component
7.1. Segment Overview
7.2. Actuators
7.3. Microcontrollers
7.4. Software
7.5. Drivers
7.6. Others
8. Global Haptic Technology Market Analysis and Forecast, By Application
8.1. Segment Overview
8.2. Consumer Electronics
8.3. Automotive & Transportation
8.4. Healthcare
8.5. Gaming
8.6. Education & Research
8.7. Engineering
8.8. Others
9. Global Haptic Technology Market Analysis and Forecast, By Regional Analysis
9.1. Segment Overview
9.2. North America
9.2.1. U.S.
9.2.2. Canada
9.2.3. Mexico
9.3. Europe
9.3.1. Germany
9.3.2. France
9.3.3. U.K.
9.3.4. Italy
9.3.5. Spain
9.4. Asia-Pacific
9.4.1. Japan
9.4.2. China
9.4.3. India
9.5. South America
9.5.1. Brazil
9.6. Middle East and Africa
9.6.1. UAE
9.6.2. South Africa
10. Global Haptic Technology Market-Competitive Landscape
10.1. Overview
10.2. Market Share of Key Players in Global Haptic Technology Market
10.2.1. Global Company Market Share
10.2.2. North America Company Market Share
10.2.3. Europe Company Market Share
10.2.4. APAC Company Market Share
10.3. Competitive Situations and Trends
10.3.1. Product Launches and Developments
10.3.2. Partnerships, Collaborations, and Agreements
10.3.3. Mergers & Acquisitions
10.3.4. Expansions
11. Company Profiles
11.1. TDK Corporation
11.1.1. Business Overview
11.1.2. Company Snapshot
11.1.3. Company Market Share Analysis
11.1.4. Company Product Portfolio
11.1.5. Recent Developments
11.1.6. SWOT Analysis
11.2. Infineon Technologies AG
11.2.1. Business Overview
11.2.2. Company Snapshot
11.2.3. Company Market Share Analysis
11.2.4. Company Product Portfolio
11.2.5. Recent Developments
11.2.6. SWOT Analysis
11.3. Dialog Semiconductor PLC
11.3.1. Business Overview
11.3.2. Company Snapshot
11.3.3. Company Market Share Analysis
11.3.4. Company Product Portfolio
11.3.5. Recent Developments
11.3.6. SWOT Analysis
11.4. Microchip Technology, Inc.
11.4.1. Business Overview
11.4.2. Company Snapshot
11.4.3. Company Market Share Analysis
11.4.4. Company Product Portfolio
11.4.5. Recent Developments
11.4.6. SWOT Analysis
11.5. Immersion Corporation
11.5.1. Business Overview
11.5.2. Company Snapshot
11.5.3. Company Market Share Analysis
11.5.4. Company Product Portfolio
11.5.5. Recent Developments
11.5.6. SWOT Analysis
11.6. Synaptics, Inc.
11.6.1. Business Overview
11.6.2. Company Snapshot
11.6.3. Company Market Share Analysis
11.6.4. Company Product Portfolio
11.6.5. Recent Developments
11.6.6. SWOT Analysis
11.7. ON Semiconductor Corporation
11.7.1. Business Overview
11.7.2. Company Snapshot
11.7.3. Company Market Share Analysis
11.7.4. Company Product Portfolio
11.7.5. Recent Developments
11.7.6. SWOT Analysis
11.8. Ultraleap Limited (Leap Motion, Inc.)
11.8.1. Business Overview
11.8.2. Company Snapshot
11.8.3. Company Market Share Analysis
11.8.4. Company Product Portfolio
11.8.5. Recent Developments
11.8.6. SWOT Analysis
11.9. HaptX, Inc
11.9.1. Business Overview
11.9.2. Company Snapshot
11.9.3. Company Market Share Analysis
11.9.4. Company Product Portfolio
11.9.5. Recent Developments
11.9.6. SWOT Analysis
11.10. SMK Corporation
11.10.1. Business Overview
11.10.2. Company Snapshot
11.10.3. Company Market Share Analysis
11.10.4. Company Product Portfolio
11.10.5. Recent Developments
11.10.6. SWOT Analysis
List of Table
1. Global Haptic Technology Market, By Feedback, 2019-2032 (USD Billion)
2. Global Force Feedback, Haptic Technology Market, By Region, 2019-2032 (USD Billion)
3. Global Tactile Feedback, Haptic Technology Market, By Region, 2019-2032 (USD Billion)
4. Global Haptic Technology Market, By Component, 2019-2032 (USD Billion)
5. Global Actuators, Haptic Technology Market, By Region, 2019-2032 (USD Billion)
6. Global Microcontrollers, Haptic Technology Market, By Region, 2019-2032 (USD Billion)
7. Global Software, Haptic Technology Market, By Region, 2019-2032 (USD Billion)
8. Global Drivers, Haptic Technology Market, By Region, 2019-2032 (USD Billion)
9. Global Others, Haptic Technology Market, By Region, 2019-2032 (USD Billion)
10. Global Haptic Technology Market, By Application, 2019-2032 (USD Billion)
11. Global Automotive & Transportation, Haptic Technology Market, By Region, 2019-2032 (USD Billion)
12. Global Healthcare, Haptic Technology Market, By Region, 2019-2032 (USD Billion)
13. Global Gaming, Haptic Technology Market, By Region, 2019-2032 (USD Billion)
14. Global Education & Research, Haptic Technology Market, By Region, 2019-2032 (USD Billion)
15. Global Engineering, Haptic Technology Market, By Region, 2019-2032 (USD Billion)
16. Global Others, Haptic Technology Market, By Region, 2019-2032 (USD Billion)
17. North America Haptic Technology Market, By Feedback, 2019-2032 (USD Billion)
18. North America Haptic Technology Market, By Component, 2019-2032 (USD Billion)
19. North America Haptic Technology Market, By Application, 2019-2032 (USD Billion)
20. U.S. Haptic Technology Market, By Feedback, 2019-2032 (USD Billion)
21. U.S. Haptic Technology Market, By Component, 2019-2032 (USD Billion)
22. U.S. Haptic Technology Market, By Application, 2019-2032 (USD Billion)
23. Canada Haptic Technology Market, By Feedback, 2019-2032 (USD Billion)
24. Canada Haptic Technology Market, By Component, 2019-2032 (USD Billion)
25. Canada Haptic Technology Market, By Application, 2019-2032 (USD Billion)
26. Mexico Haptic Technology Market, By Feedback, 2019-2032 (USD Billion)
27. Mexico Haptic Technology Market, By Component, 2019-2032 (USD Billion)
28. Mexico Haptic Technology Market, By Application, 2019-2032 (USD Billion)
29. Europe Haptic Technology Market, By Feedback, 2019-2032 (USD Billion)
30. Europe Haptic Technology Market, By Component, 2019-2032 (USD Billion)
31. Europe Haptic Technology Market, By Application, 2019-2032 (USD Billion)
32. Germany Haptic Technology Market, By Feedback, 2019-2032 (USD Billion)
33. Germany Haptic Technology Market, By Component, 2019-2032 (USD Billion)
34. Germany Haptic Technology Market, By Application, 2019-2032 (USD Billion)
35. France Haptic Technology Market, By Feedback, 2019-2032 (USD Billion)
36. France Haptic Technology Market, By Component, 2019-2032 (USD Billion)
37. France Haptic Technology Market, By Application, 2019-2032 (USD Billion)
38. U.K. Haptic Technology Market, By Feedback, 2019-2032 (USD Billion)
39. U.K. Haptic Technology Market, By Component, 2019-2032 (USD Billion)
40. U.K. Haptic Technology Market, By Application, 2019-2032 (USD Billion)
41. Italy Haptic Technology Market, By Feedback, 2019-2032 (USD Billion)
42. Italy Haptic Technology Market, By Component, 2019-2032 (USD Billion)
43. Italy Haptic Technology Market, By Application, 2019-2032 (USD Billion)
44. Spain Haptic Technology Market, By Feedback, 2019-2032 (USD Billion)
45. Spain Haptic Technology Market, By Component, 2019-2032 (USD Billion)
46. Spain Haptic Technology Market, By Application, 2019-2032 (USD Billion)
47. Asia Pacific Haptic Technology Market, By Feedback, 2019-2032 (USD Billion)
48. Asia Pacific Haptic Technology Market, By Component, 2019-2032 (USD Billion)
49. Asia Pacific Haptic Technology Market, By Application, 2019-2032 (USD Billion)
50. Japan Haptic Technology Market, By Feedback, 2019-2032 (USD Billion)
51. Japan Haptic Technology Market, By Component, 2019-2032 (USD Billion)
52. Japan Haptic Technology Market, By Application, 2019-2032 (USD Billion)
53. China Haptic Technology Market, By Feedback, 2019-2032 (USD Billion)
54. China Haptic Technology Market, By Component, 2019-2032 (USD Billion)
55. China Haptic Technology Market, By Application, 2019-2032 (USD Billion)
56. India Haptic Technology Market, By Feedback, 2019-2032 (USD Billion)
57. India Haptic Technology Market, By Component, 2019-2032 (USD Billion)
58. India Haptic Technology Market, By Application, 2019-2032 (USD Billion)
59. South America Haptic Technology Market, By Feedback, 2019-2032 (USD Billion)
60. South America Haptic Technology Market, By Component, 2019-2032 (USD Billion)
61. South America Haptic Technology Market, By Application, 2019-2032 (USD Billion)
62. Brazil Haptic Technology Market, By Feedback, 2019-2032 (USD Billion)
63. Brazil Haptic Technology Market, By Component, 2019-2032 (USD Billion)
64. Brazil Haptic Technology Market, By Application, 2019-2032 (USD Billion)
65. Middle East and Africa Haptic Technology Market, By Feedback, 2019-2032 (USD Billion)
66. Middle East and Africa Haptic Technology Market, By Component, 2019-2032 (USD Billion)
67. Middle East and Africa Haptic Technology Market, By Application, 2019-2032 (USD Billion)
68. UAE Haptic Technology Market, By Feedback, 2019-2032 (USD Billion)
69. UAE Haptic Technology Market, By Component, 2019-2032 (USD Billion)
70. UAE Haptic Technology Market, By Application, 2019-2032 (USD Billion)
71. South Africa Haptic Technology Market, By Feedback, 2019-2032 (USD Billion)
72. South Africa Haptic Technology Market, By Component, 2019-2032 (USD Billion)
73. South Africa Haptic Technology Market, By Application, 2019-2032 (USD Billion)
List of Figures
1. Global Haptic Technology Market Segmentation
2. Global Haptic Technology Market: Research Methodology
3. Market Size Estimation Methodology: Bottom-Up Approach
4. Market Size Estimation Methodology: Top- Approach
5. Data Triangulation
6. Porter’s Five Forces Analysis
7. Value Chain Analysis
8. Global Haptic Technology Market Attractiveness Analysis By Feedback
9. Global Haptic Technology Market Attractiveness Analysis By Component
10. Global Haptic Technology Market Attractiveness Analysis By Application
11. Global Haptic Technology Market Attractiveness Analysis By Region
12. Global Haptic Technology Market: Dynamics
13. Global Haptic Technology Market Share By Feedback (2023 & 2032)
14. Global Haptic Technology Market Share By Component (2023 & 2032)
15. Global Haptic Technology Market Share By Application (2023 & 2032)
16. Global Haptic Technology Market Share By Regions (2023 & 2032)
17. Global Haptic Technology Market Share By Company (2022)
This study forecasts revenue at global, regional, and country levels from 2019 to 2030. The Brainy Insights has segmented the global haptic technology based on below mentioned segments:
Global Haptic Technology Market by Feedback:
Global Haptic Technology Market by Component:
Global Haptic Technology Market by Application:
Global Haptic Technology by Region:
Research has its special purpose to undertake marketing efficiently. In this competitive scenario, businesses need information across all industry verticals; the information about customer wants, market demand, competition, industry trends, distribution channels etc. This information needs to be updated regularly because businesses operate in a dynamic environment. Our organization, The Brainy Insights incorporates scientific and systematic research procedures in order to get proper market insights and industry analysis for overall business success. The analysis consists of studying the market from a miniscule level wherein we implement statistical tools which helps us in examining the data with accuracy and precision.
Our research reports feature both; quantitative and qualitative aspects for any market. Qualitative information for any market research process are fundamental because they reveal the customer needs and wants, usage and consumption for any product/service related to a specific industry. This in turn aids the marketers/investors in knowing certain perceptions of the customers. Qualitative research can enlighten about the different product concepts and designs along with unique service offering that in turn, helps define marketing problems and generate opportunities. On the other hand, quantitative research engages with the data collection process through interviews, e-mail interactions, surveys and pilot studies. Quantitative aspects for the market research are useful to validate the hypotheses generated during qualitative research method, explore empirical patterns in the data with the help of statistical tools, and finally make the market estimations.
The Brainy Insights offers comprehensive research and analysis, based on a wide assortment of factual insights gained through interviews with CXOs and global experts and secondary data from reliable sources. Our analysts and industry specialist assume vital roles in building up statistical tools and analysis models, which are used to analyse the data and arrive at accurate insights with exceedingly informative research discoveries. The data provided by our organization have proven precious to a diverse range of companies, facilitating them to address issues such as determining which products/services are the most appealing, whether or not customers use the product in the manner anticipated, the purchasing intentions of the market and many others.
Our research methodology encompasses an idyllic combination of primary and secondary initiatives. Key phases involved in this process are listed below:

The phase involves the gathering and collecting of market data and its related information with the help of different sources & research procedures.

The data procurement stage involves in data gathering and collecting through various data sources.
This stage involves in extensive research. These data sources includes:
Purchased Database: Purchased databases play a crucial role in estimating the market sizes irrespective of the domain. Our purchased database includes:
Primary Research: The Brainy Insights interacts with leading companies and experts of the concerned domain to develop the analyst team’s market understanding and expertise. It improves and substantiates every single data presented in the market reports. Primary research mainly involves in telephonic interviews, E-mail interactions and face-to-face interviews with the raw material providers, manufacturers/producers, distributors, & independent consultants. The interviews that we conduct provides valuable data on market size and industry growth trends prevailing in the market. Our organization also conducts surveys with the various industry experts in order to gain overall insights of the industry/market. For instance, in healthcare industry we conduct surveys with the pharmacists, doctors, surgeons and nurses in order to gain insights and key information of a medical product/device/equipment which the customers are going to usage. Surveys are conducted in the form of questionnaire designed by our own analyst team. Surveys plays an important role in primary research because surveys helps us to identify the key target audiences of the market. Additionally, surveys helps to identify the key target audience engaged with the market. Our survey team conducts the survey by targeting the key audience, thus gaining insights from them. Based on the perspectives of the customers, this information is utilized to formulate market strategies. Moreover, market surveys helps us to understand the current competitive situation of the industry. To be precise, our survey process typically involve with the 360 analysis of the market. This analytical process begins by identifying the prospective customers for a product or service related to the market/industry to obtain data on how a product/service could fit into customers’ lives.

Secondary Research: The secondary data sources includes information published by the on-profit organizations such as World bank, WHO, company fillings, investor presentations, annual reports, national government documents, statistical databases, blogs, articles, white papers and others. From the annual report, we analyse a company’s revenue to understand the key segment and market share of that organization in a particular region. We analyse the company websites and adopt the product mapping technique which is important for deriving the segment revenue. In the product mapping method, we select and categorize the products offered by the companies catering to domain specific market, deduce the product revenue for each of the companies so as to get overall estimation of the market size. We also source data and analyses trends based on information received from supply side and demand side intermediaries in the value chain. The supply side denotes the data gathered from supplier, distributor, wholesaler and the demand side illustrates the data gathered from the end customers for respective market domain.

The supply side for a domain specific market is analysed by:
The demand side for the market is estimated through:
In-house Library: Apart from these third-party sources, we have our in-house library of qualitative and quantitative information. Our in-house database includes market data for various industry and domains. These data are updated on regular basis as per the changing market scenario. Our library includes, historic databases, internal audit reports and archives.
Sometimes there are instances where there is no metadata or raw data available for any domain specific market. For those cases, we use our expertise to forecast and estimate the market size in order to generate comprehensive data sets. Our analyst team adopt a robust research technique in order to produce the estimates:
Data Synthesis: This stage involves the analysis & mapping of all the information obtained from the previous step. It also involves in scrutinizing the data for any discrepancy observed while data gathering related to the market. The data is collected with consideration to the heterogeneity of sources. Robust scientific techniques are in place for synthesizing disparate data sets and provide the essential contextual information that can orient market strategies. The Brainy Insights has extensive experience in data synthesis where the data passes through various stages:


Market Deduction & Formulation: The final stage comprises of assigning data points at appropriate market spaces so as to deduce feasible conclusions. Analyst perspective & subject matter expert based holistic form of market sizing coupled with industry analysis also plays a crucial role in this stage.
This stage involves in finalization of the market size and numbers that we have collected from data integration step. With data interpolation, it is made sure that there is no gap in the market data. Successful trend analysis is done by our analysts using extrapolation techniques, which provide the best possible forecasts for the market.
Data Validation & Market Feedback: Validation is the most important step in the process. Validation & re-validation via an intricately designed process helps us finalize data-points to be used for final calculations.

The Brainy Insights interacts with leading companies and experts of the concerned domain to develop the analyst team’s market understanding and expertise. It improves and substantiates every single data presented in the market reports. The data validation interview and discussion panels are typically composed of the most experienced industry members. The participants include, however, are not limited to:
Moreover, we always validate our data and findings through primary respondents from all the major regions we are working on.


Free Customization
Fortune 500 Clients
Free Yearly Update On Purchase Of Multi/Corporate License
Companies Served Till Date