- +1-315-215-1633
- sales@thebrainyinsights.com

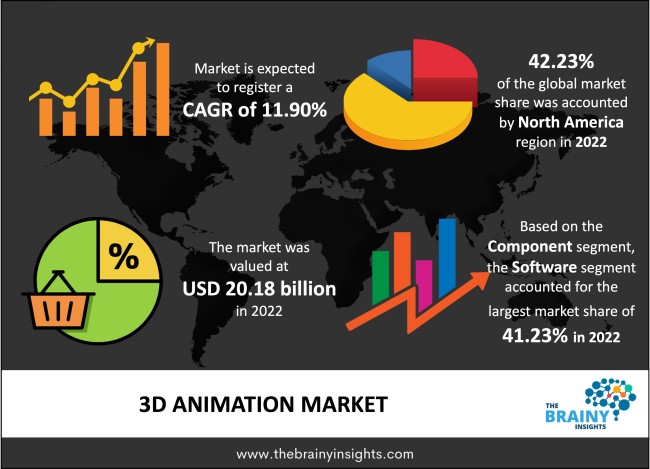
The global 3D animation market was valued at USD 20.18 billion in 2022, growing at a CAGR of 11.90% from 2023 to 2032. The market is expected to reach USD 62.11 billion by 2032. The increasing demand of customers for realistic & appealing content has made the public embrace 3D animation technology, coupled with the adoption of cloud-based technology by animation content producers, which is propelling growth in the market.
Designing, preparing photographic sequences, drawing and making layouts are all part of the animation that is incorporated into multimedia and gaming productions. Cartoon characters, vehicles, props and other objects are brought to life with motion using 3D animation for films, games and TV shows. The creation of moving 3-dimensional images in a digital scope is called 3D animation. With 3D software, designers create computerized objects which appear in 3D, even on a 2D surface. The process of producing VFX content requires the involvement of 3D animators in the early stages. To ensure the accuracy of models, animators work on rigging, modelling, and animation, all of which are pivotal steps in creating a three-dimensional animated image. Video games can feel more authentic because of 3D animation, which strengthens the action for the player.
Get an overview of this study by requesting a free sample
The growing media and entertainment industry: The growing acceptance of technology for visual effects in movies and the increasing demand for high-quality animation by customers propel the market growth. Moreover, the emergence of virtual reality and artificial intelligence technologies across the globe is helping to boost market growth. Further, the rising interest among the populace toward 3D animated movies, coupled with the incorporation of artificial intelligence and virtual reality in 3D technology, is expected to drive market growth. Additionally, the increasing investments by companies in developing advanced technologies are the driving factor of the market growth.
The lack of government support and low proficiency level: The lack of government support and low proficiency level is the restraining factor of market growth. Further, the threat of piracy coupled with corruption is the hampering factor of the market growth.
The increased internet penetration across different regions: The raised internet penetration across various regions, coupled with the rising utilization of this software for 3D mapping and laser screening for geological, geospatial, geophysical, and mining applications, are the opportunities factor for market growth. Further, technological advancements in the technology and communications sectors across the globe are helping to boost market growth. Moreover, the increasing demand for High-Definition (HD) content, particularly for video marketing, as a substantially higher number of pixels, higher resolution, and enhanced range quality compared with standard-definition content having more influence on the audience is expected to drive the market growth.
The regions analyzed for the market include North America, Europe, South America, Asia Pacific, the Middle East, and Africa. North America emerged as the largest global 3D animation market, with a 42.23% market revenue share in 2022. Additionally, the deployment of 3D animation in the healthcare industry to support medical students and practitioners in getting medical training is expected to drive market growth. Moreover, the rise in demand for high-quality animation by customers, the increasing acceptance of cloud & IoT, and the increasing utilization of the web are also helping to boost the market growth in this region over the forecast period. Additionally, the growing need for a realistic virtual view of the product for marketing by small and medium businesses and government agencies is propelling market growth in this region. The Asia-Pacific region will account for the largest market share with revenue growth. This growth is attributed to the increased preferences in the automotive industry. Further, the surge in the use of 3D mobile applications and games and the increasing use of 3D animation in professional training are expected to propel the market growth over the forecast period in this region.
North America Region 3D Animation Market Share in 2022 - 42.23%
www.thebrainyinsights.com
Check the geographical analysis of this market by requesting a free sample
The component segment is divided into software, hardware, and services. The software segment dominated the market, with a share of around 41.23% in 2022. This growth is attributed to the animated software's ability to create real-looking animations. Further, by 2032, the services segment will likely dominate the market due to the increasing applications of computer-generated graphics & visual effects in commercial advertisements and movies.
The technique segment is divided into visual effects, 3d modeling, 3d rendering, and motion graphics. The motion graphics segment dominated, with a market share of around 32.16% 2022. This growth is attributed to the increasing demand for motion graphics in various end-use industries, such as marketing, education, and entertainment. Further, by 2032, the 3d modeling segment will likely dominate the market due to the large presence of key players & technologically advanced capabilities.
The deployment segment is divided into on-demand and on-premise. The on-premise segment dominated the market, with a share of around 56.17% in 2022. This growth is attributed to the widespread acceptance of VFX in the entertainment industry.
The end-user segment is divided into architecture & construction, media & entertainment, healthcare & life sciences, manufacturing, education & academics, government & defense, and others. The media & entertainment segment dominated, with a market share of around 23.12% in 2022. This growth is attributed to the increasing popularity of virtual creation in the media and entertainment business. Further, by 2032, the healthcare & life sciences segment will likely dominate the market due to the rise in demand for biologics.
| Attribute | Description |
|---|---|
| Market Size | Revenue (USD Billion) |
| Market size value in 2022 | USD 20.18 Billion |
| Market size value in 2032 | USD 62.11 Billion |
| CAGR (2023 to 2032) | 11.90% |
| Historical data | 2019-2021 |
| Base Year | 2022 |
| Forecast | 2023-2032 |
| Region | The regions analyzed for the market are Asia Pacific, Europe, South America, North America, and Middle East & Africa. Furthermore, the regions are further analyzed at the country level. |
| Segments | Component, Technique, Deployment Industry, End-User |
As per The Brainy Insights, the size of the 20.18 market was valued at USD 20.18 billion in 2022 to USD 62.11 billion by 2032.
The global 3D animation market is growing at a CAGR of 11.90% during the forecast period 2023-2032.
North America region emerged as the largest market for 3D animation.
The market's growth will be influenced by the growing media and entertainment industry.
The lack of government support and low proficiency level could hamper the market growth.
The rapid growth of the media and entertainment sector across the world will provide huge opportunities to the market.
Key players are Pixar Animation Studios, Walt Disney Animation Studios, DreamWorks Animation LLC, Autodesk, Inc., Corel Corporation, Studio Ghibli Inc., Cartoon Network Studios, Nickelodeon Animation Studios, and Warner Bros and among others.
1. Introduction
1.1. Objectives of the Study
1.2. Market Definition
1.3. Research Scope
1.4. Currency
1.5. Key Target Audience
2. Research Methodology and Assumptions
3. Executive Summary
4. Premium Insights
4.1. Porter’s Five Forces Analysis
4.2. Value Chain Analysis
4.3. Top Investment Pockets
4.3.1. Market Attractiveness Analysis By Component
4.3.2. Market Attractiveness Analysis By Technique
4.3.3. Market Attractiveness Analysis By Deployment
4.3.4. Market Attractiveness Analysis By End-User
4.3.5. Market Attractiveness Analysis By Region
4.4. Industry Trends
5. Market Dynamics
5.1. Market Evaluation
5.2. Drivers
5.2.1. The growing media and entertainment industry
5.2.2. The rising adoption of VFX technology in motion pictures
5.3. Restraints
5.3.1. The lack of government support and low proficiency level
5.3.2. The lack of investment and government support
5.4. Opportunities
5.4.1. The increased internet penetration across different regions
5.4.2. The rapid growth of the media and entertainment sector across the world
6. Global 3D Animation Market Analysis and Forecast, By Component
6.1. Segment Overview
6.2. Software
6.3. Hardware
6.4. Services
7. Global 3D Animation Market Analysis and Forecast, By Technique
7.1. Segment Overview
7.2. Visual Effects
7.3. 3D Modeling
7.4. 3D Rendering
7.5. Motion Graphics
8. Global 3D Animation Market Analysis and Forecast, By Deployment
8.1. Segment Overview
8.2. On-Demand
8.3. On-Premise
9. Global 3D Animation Market Analysis and Forecast, By End-User
9.1. Segment Overview
9.2. Architecture & Construction
9.3. Media & Entertainment
9.4. Healthcare & Life Sciences
9.5. Manufacturing
9.6. Education & Academics
9.7. Government & Defense
9.8. Others
10. Global 3D Animation Market Analysis and Forecast, By Regional Analysis
10.1. Segment Overview
10.2. North America
10.2.1. U.S.
10.2.2. Canada
10.2.3. Mexico
10.3. Europe
10.3.1. Germany
10.3.2. France
10.3.3. U.K.
10.3.4. Italy
10.3.5. Spain
10.4. Asia-Pacific
10.4.1. Japan
10.4.2. China
10.4.3. India
10.5. South America
10.5.1. Brazil
10.6. Middle East and Africa
10.6.1. UAE
10.6.2. South Africa
11. Global 3D Animation Market-Competitive Landscape
11.1. Overview
11.2. Market Share of Key Players in Global 3D Animation Market
11.2.1. Global Company Market Share
11.2.2. North America Company Market Share
11.2.3. Europe Company Market Share
11.2.4. APAC Company Market Share
11.3. Competitive Situations and Trends
11.3.1. Product Launches and Developments
11.3.2. Partnerships, Collaborations, and Agreements
11.3.3. Mergers & Acquisitions
11.3.4. Expansions
12. Company Profiles
12.1. Pixar Animation Studios
12.1.1. Business Overview
12.1.2. Company Snapshot
12.1.3. Company Market Share Analysis
12.1.4. Company Product Portfolio
12.1.5. Recent Developments
12.1.6. SWOT Analysis
12.2. Walt Disney Animation Studios
12.2.1. Business Overview
12.2.2. Company Snapshot
12.2.3. Company Market Share Analysis
12.2.4. Company Product Portfolio
12.2.5. Recent Developments
12.2.6. SWOT Analysis
12.3. DreamWorks Animation LLC
12.3.1. Business Overview
12.3.2. Company Snapshot
12.3.3. Company Market Share Analysis
12.3.4. Company Product Portfolio
12.3.5. Recent Developments
12.3.6. SWOT Analysis
12.4. Autodesk, Inc.
12.4.1. Business Overview
12.4.2. Company Snapshot
12.4.3. Company Market Share Analysis
12.4.4. Company Product Portfolio
12.4.5. Recent Developments
12.4.6. SWOT Analysis
12.5. Corel Corporation
12.5.1. Business Overview
12.5.2. Company Snapshot
12.5.3. Company Market Share Analysis
12.5.4. Company Product Portfolio
12.5.5. Recent Developments
12.5.6. SWOT Analysis
12.6. Studio Ghibli Inc.
12.6.1. Business Overview
12.6.2. Company Snapshot
12.6.3. Company Market Share Analysis
12.6.4. Company Product Portfolio
12.6.5. Recent Developments
12.6.6. SWOT Analysis
12.7. Cartoon Network Studios
12.7.1. Business Overview
12.7.2. Company Snapshot
12.7.3. Company Market Share Analysis
12.7.4. Company Product Portfolio
12.7.5. Recent Developments
12.7.6. SWOT Analysis
12.8. Nickelodeon Animation Studios
12.8.1. Business Overview
12.8.2. Company Snapshot
12.8.3. Company Market Share Analysis
12.8.4. Company Product Portfolio
12.8.5. Recent Developments
12.8.6. SWOT Analysis
12.9. Warner Bros
12.9.1. Business Overview
12.9.2. Company Snapshot
12.9.3. Company Market Share Analysis
12.9.4. Company Product Portfolio
12.9.5. Recent Developments
12.9.6. SWOT Analysis
List of Table
1. Global 3D Animation Market, By Component, 2019-2032 (USD Billion)
2. Global Software, 3D Animation Market, By Region, 2019-2032 (USD Billion)
3. Global Hardware, 3D Animation Market, By Region, 2019-2032 (USD Billion)
4. Global Services, 3D Animation Market, By Region, 2019-2032 (USD Billion)
5. Global 3D Animation Market, By Technique, 2019-2032 (USD Billion)
6. Global Visual Effects, 3D Animation Market, By Region, 2019-2032 (USD Billion)
7. Global 3D Modeling, 3D Animation Market, By Region, 2019-2032 (USD Billion)
8. Global 3D Rendering, 3D Animation Market, By Region, 2019-2032 (USD Billion)
9. Global Motion Graphics, 3D Animation Market, By Region, 2019-2032 (USD Billion)
10. Global 3D Animation Market, By Deployment, 2019-2032 (USD Billion)
11. Global On-Demand, 3D Animation Market, By Region, 2019-2032 (USD Billion)
12. Global On-Premise, 3D Animation Market, By Region, 2019-2032 (USD Billion)
13. Global 3D Animation Market, By End-User, 2019-2032 (USD Billion)
14. Global Architecture & Construction, 3D Animation Market, By Region, 2019-2032 (USD Billion)
15. Global Media & Entertainment, 3D Animation Market, By Region, 2019-2032 (USD Billion)
16. Global Healthcare & Life Sciences, 3D Animation Market, By Region, 2019-2032 (USD Billion)
17. Global Manufacturing, 3D Animation Market, By Region, 2019-2032 (USD Billion)
18. Global Education & Academics, 3D Animation Market, By Region, 2019-2032 (USD Billion)
19. Global Government & Defense, 3D Animation Market, By Region, 2019-2032 (USD Billion)
20. Global Others, 3D Animation Market, By Region, 2019-2032 (USD Billion)
21. North America 3D Animation Market, By Component, 2019-2032 (USD Billion)
22. North America 3D Animation Market, By Technique, 2019-2032 (USD Billion)
23. North America 3D Animation Market, By Deployment, 2019-2032 (USD Billion)
24. North America 3D Animation Market, By End-User, 2019-2032 (USD Billion)
25. U.S. 3D Animation Market, By Component, 2019-2032 (USD Billion)
26. U.S. 3D Animation Market, By Technique, 2019-2032 (USD Billion)
27. U.S. 3D Animation Market, By Deployment, 2019-2032 (USD Billion)
28. U.S. 3D Animation Market, By End-User, 2019-2032 (USD Billion)
29. Canada 3D Animation Market, By Component, 2019-2032 (USD Billion)
30. Canada 3D Animation Market, By Technique, 2019-2032 (USD Billion)
31. Canada 3D Animation Market, By Deployment, 2019-2032 (USD Billion)
32. Canada 3D Animation Market, By End-User, 2019-2032 (USD Billion)
33. Mexico 3D Animation Market, By Component, 2019-2032 (USD Billion)
34. Mexico 3D Animation Market, By Technique, 2019-2032 (USD Billion)
35. Mexico 3D Animation Market, By Deployment, 2019-2032 (USD Billion)
36. Mexico 3D Animation Market, By End-User, 2019-2032 (USD Billion)
37. Europe 3D Animation Market, By Component, 2019-2032 (USD Billion)
38. Europe 3D Animation Market, By Technique, 2019-2032 (USD Billion)
39. Europe 3D Animation Market, By Deployment, 2019-2032 (USD Billion)
40. Europe 3D Animation Market, By End-User, 2019-2032 (USD Billion)
41. Germany 3D Animation Market, By Component, 2019-2032 (USD Billion)
42. Germany 3D Animation Market, By Technique, 2019-2032 (USD Billion)
43. Germany 3D Animation Market, By Deployment, 2019-2032 (USD Billion)
44. Germany 3D Animation Market, By End-User, 2019-2032 (USD Billion)
45. France 3D Animation Market, By Component, 2019-2032 (USD Billion)
46. France 3D Animation Market, By Technique, 2019-2032 (USD Billion)
47. France 3D Animation Market, By Deployment, 2019-2032 (USD Billion)
48. France 3D Animation Market, By End-User, 2019-2032 (USD Billion)
49. U.K. 3D Animation Market, By Component, 2019-2032 (USD Billion)
50. U.K. 3D Animation Market, By Technique, 2019-2032 (USD Billion)
51. U.K. 3D Animation Market, By Deployment, 2019-2032 (USD Billion)
52. U.K. 3D Animation Market, By End-User, 2019-2032 (USD Billion)
53. Italy 3D Animation Market, By Component, 2019-2032 (USD Billion)
54. Italy 3D Animation Market, By Technique, 2019-2032 (USD Billion)
55. Italy 3D Animation Market, By Deployment, 2019-2032 (USD Billion)
56. Italy 3D Animation Market, By End-User, 2019-2032 (USD Billion)
57. Spain 3D Animation Market, By Component, 2019-2032 (USD Billion)
58. Spain 3D Animation Market, By Technique, 2019-2032 (USD Billion)
59. Spain 3D Animation Market, By Deployment, 2019-2032 (USD Billion)
60. Spain 3D Animation Market, By End-User, 2019-2032 (USD Billion)
61. Asia Pacific 3D Animation Market, By Component, 2019-2032 (USD Billion)
62. Asia Pacific 3D Animation Market, By Technique, 2019-2032 (USD Billion)
63. Asia Pacific 3D Animation Market, By Deployment, 2019-2032 (USD Billion)
64. Asia Pacific 3D Animation Market, By End-User, 2019-2032 (USD Billion)
65. Japan 3D Animation Market, By Component, 2019-2032 (USD Billion)
66. Japan 3D Animation Market, By Technique, 2019-2032 (USD Billion)
67. Japan 3D Animation Market, By Deployment, 2019-2032 (USD Billion)
68. Japan 3D Animation Market, By End-User, 2019-2032 (USD Billion)
69. China 3D Animation Market, By Component, 2019-2032 (USD Billion)
70. China 3D Animation Market, By Technique, 2019-2032 (USD Billion)
71. China 3D Animation Market, By Deployment, 2019-2032 (USD Billion)
72. China 3D Animation Market, By End-User, 2019-2032 (USD Billion)
73. India 3D Animation Market, By Component, 2019-2032 (USD Billion)
74. India 3D Animation Market, By Technique, 2019-2032 (USD Billion)
75. India 3D Animation Market, By Deployment, 2019-2032 (USD Billion)
76. India 3D Animation Market, By End-User, 2019-2032 (USD Billion)
77. South America 3D Animation Market, By Component, 2019-2032 (USD Billion)
78. South America 3D Animation Market, By Technique, 2019-2032 (USD Billion)
79. South America 3D Animation Market, By Deployment, 2019-2032 (USD Billion)
80. South America 3D Animation Market, By End-User, 2019-2032 (USD Billion)
81. Brazil 3D Animation Market, By Component, 2019-2032 (USD Billion)
82. Brazil 3D Animation Market, By Technique, 2019-2032 (USD Billion)
83. Brazil 3D Animation Market, By Deployment, 2019-2032 (USD Billion)
84. Brazil 3D Animation Market, By End-User, 2019-2032 (USD Billion)
85. Middle East and Africa 3D Animation Market, By Component, 2019-2032 (USD Billion)
86. Middle East and Africa 3D Animation Market, By Technique, 2019-2032 (USD Billion)
87. Middle East and Africa 3D Animation Market, By Deployment, 2019-2032 (USD Billion)
88. Middle East and Africa 3D Animation Market, By End-User, 2019-2032 (USD Billion)
89. UAE 3D Animation Market, By Component, 2019-2032 (USD Billion)
90. UAE 3D Animation Market, By Technique, 2019-2032 (USD Billion)
91. UAE 3D Animation Market, By Deployment, 2019-2032 (USD Billion)
92. UAE 3D Animation Market, By End-User, 2019-2032 (USD Billion)
93. South Africa 3D Animation Market, By Component, 2019-2032 (USD Billion)
94. South Africa 3D Animation Market, By Technique, 2019-2032 (USD Billion)
95. South Africa 3D Animation Market, By Deployment, 2019-2032 (USD Billion)
96. South Africa 3D Animation Market, By End-User, 2019-2032 (USD Billion)
List of Figures
1. Global 3D Animation Market Segmentation
2. Global 3D Animation Market: Research Methodology
3. Market Size Estimation Methodology: Bottom-Up Approach
4. Market Size Estimation Methodology: Top-Down Approach
5. Data Triangulation
6. Porter’s Five Forces Analysis
7. Value Chain Analysis
8. Global 3D Animation Market Attractiveness Analysis By Component
9. Global 3D Animation Market Attractiveness Analysis By Technique
10. Global 3D Animation Market Attractiveness Analysis By Deployment
11. Global 3D Animation Market Attractiveness Analysis By End-User
12. Global 3D Animation Market Attractiveness Analysis By Region
13. Global 3D Animation Market: Dynamics
14. Global 3D Animation Market Share By Component (2023 & 2032)
15. Global 3D Animation Market Share By Technique (2023 & 2032)
16. Global 3D Animation Market Share By Deployment (2023 & 2032)
17. Global 3D Animation Market Share By End-User (2023 & 2032)
18. Global 3D Animation Market Share By Regions (2023 & 2032)
19. Global 3D Animation Market Share By Company (2022)
This study forecasts revenue at global, regional, and country levels from 2019 to 2030. The Brainy Insights has segmented the global 3D animation based on below mentioned segments:
Global 3D Animation Market by Component:
Global 3D Animation Market by Technique:
Global 3D Animation Market by Deployment:
Global 3D Animation Market by End-User:
Global 3D Animation by Region:
Research has its special purpose to undertake marketing efficiently. In this competitive scenario, businesses need information across all industry verticals; the information about customer wants, market demand, competition, industry trends, distribution channels etc. This information needs to be updated regularly because businesses operate in a dynamic environment. Our organization, The Brainy Insights incorporates scientific and systematic research procedures in order to get proper market insights and industry analysis for overall business success. The analysis consists of studying the market from a miniscule level wherein we implement statistical tools which helps us in examining the data with accuracy and precision.
Our research reports feature both; quantitative and qualitative aspects for any market. Qualitative information for any market research process are fundamental because they reveal the customer needs and wants, usage and consumption for any product/service related to a specific industry. This in turn aids the marketers/investors in knowing certain perceptions of the customers. Qualitative research can enlighten about the different product concepts and designs along with unique service offering that in turn, helps define marketing problems and generate opportunities. On the other hand, quantitative research engages with the data collection process through interviews, e-mail interactions, surveys and pilot studies. Quantitative aspects for the market research are useful to validate the hypotheses generated during qualitative research method, explore empirical patterns in the data with the help of statistical tools, and finally make the market estimations.
The Brainy Insights offers comprehensive research and analysis, based on a wide assortment of factual insights gained through interviews with CXOs and global experts and secondary data from reliable sources. Our analysts and industry specialist assume vital roles in building up statistical tools and analysis models, which are used to analyse the data and arrive at accurate insights with exceedingly informative research discoveries. The data provided by our organization have proven precious to a diverse range of companies, facilitating them to address issues such as determining which products/services are the most appealing, whether or not customers use the product in the manner anticipated, the purchasing intentions of the market and many others.
Our research methodology encompasses an idyllic combination of primary and secondary initiatives. Key phases involved in this process are listed below:

The phase involves the gathering and collecting of market data and its related information with the help of different sources & research procedures.

The data procurement stage involves in data gathering and collecting through various data sources.
This stage involves in extensive research. These data sources includes:
Purchased Database: Purchased databases play a crucial role in estimating the market sizes irrespective of the domain. Our purchased database includes:
Primary Research: The Brainy Insights interacts with leading companies and experts of the concerned domain to develop the analyst team’s market understanding and expertise. It improves and substantiates every single data presented in the market reports. Primary research mainly involves in telephonic interviews, E-mail interactions and face-to-face interviews with the raw material providers, manufacturers/producers, distributors, & independent consultants. The interviews that we conduct provides valuable data on market size and industry growth trends prevailing in the market. Our organization also conducts surveys with the various industry experts in order to gain overall insights of the industry/market. For instance, in healthcare industry we conduct surveys with the pharmacists, doctors, surgeons and nurses in order to gain insights and key information of a medical product/device/equipment which the customers are going to usage. Surveys are conducted in the form of questionnaire designed by our own analyst team. Surveys plays an important role in primary research because surveys helps us to identify the key target audiences of the market. Additionally, surveys helps to identify the key target audience engaged with the market. Our survey team conducts the survey by targeting the key audience, thus gaining insights from them. Based on the perspectives of the customers, this information is utilized to formulate market strategies. Moreover, market surveys helps us to understand the current competitive situation of the industry. To be precise, our survey process typically involve with the 360 analysis of the market. This analytical process begins by identifying the prospective customers for a product or service related to the market/industry to obtain data on how a product/service could fit into customers’ lives.

Secondary Research: The secondary data sources includes information published by the on-profit organizations such as World bank, WHO, company fillings, investor presentations, annual reports, national government documents, statistical databases, blogs, articles, white papers and others. From the annual report, we analyse a company’s revenue to understand the key segment and market share of that organization in a particular region. We analyse the company websites and adopt the product mapping technique which is important for deriving the segment revenue. In the product mapping method, we select and categorize the products offered by the companies catering to domain specific market, deduce the product revenue for each of the companies so as to get overall estimation of the market size. We also source data and analyses trends based on information received from supply side and demand side intermediaries in the value chain. The supply side denotes the data gathered from supplier, distributor, wholesaler and the demand side illustrates the data gathered from the end customers for respective market domain.

The supply side for a domain specific market is analysed by:
The demand side for the market is estimated through:
In-house Library: Apart from these third-party sources, we have our in-house library of qualitative and quantitative information. Our in-house database includes market data for various industry and domains. These data are updated on regular basis as per the changing market scenario. Our library includes, historic databases, internal audit reports and archives.
Sometimes there are instances where there is no metadata or raw data available for any domain specific market. For those cases, we use our expertise to forecast and estimate the market size in order to generate comprehensive data sets. Our analyst team adopt a robust research technique in order to produce the estimates:
Data Synthesis: This stage involves the analysis & mapping of all the information obtained from the previous step. It also involves in scrutinizing the data for any discrepancy observed while data gathering related to the market. The data is collected with consideration to the heterogeneity of sources. Robust scientific techniques are in place for synthesizing disparate data sets and provide the essential contextual information that can orient market strategies. The Brainy Insights has extensive experience in data synthesis where the data passes through various stages:


Market Deduction & Formulation: The final stage comprises of assigning data points at appropriate market spaces so as to deduce feasible conclusions. Analyst perspective & subject matter expert based holistic form of market sizing coupled with industry analysis also plays a crucial role in this stage.
This stage involves in finalization of the market size and numbers that we have collected from data integration step. With data interpolation, it is made sure that there is no gap in the market data. Successful trend analysis is done by our analysts using extrapolation techniques, which provide the best possible forecasts for the market.
Data Validation & Market Feedback: Validation is the most important step in the process. Validation & re-validation via an intricately designed process helps us finalize data-points to be used for final calculations.

The Brainy Insights interacts with leading companies and experts of the concerned domain to develop the analyst team’s market understanding and expertise. It improves and substantiates every single data presented in the market reports. The data validation interview and discussion panels are typically composed of the most experienced industry members. The participants include, however, are not limited to:
Moreover, we always validate our data and findings through primary respondents from all the major regions we are working on.


Free Customization
Fortune 500 Clients
Free Yearly Update On Purchase Of Multi/Corporate License
Companies Served Till Date