- +1-315-215-1633
- sales@thebrainyinsights.com

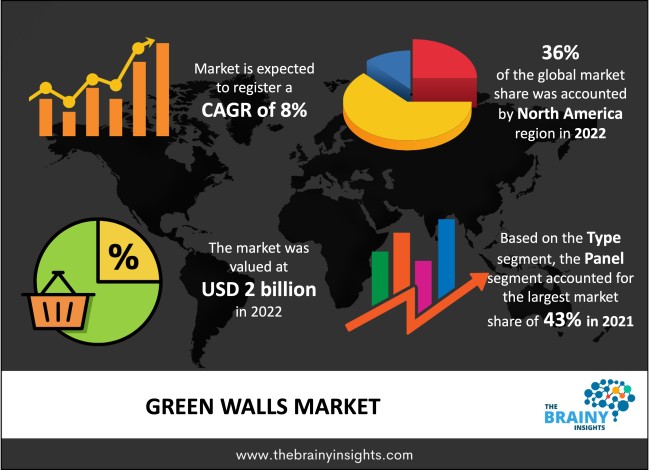
The global green walls market was valued at USD 2 billion in 2022 and grew at a CAGR of 8% from 2023 to 2032. The market is expected to reach USD 4.31 billion by 2032. Rapid urbanization will drive the global green walls market's growth.
Green walls as the term represents, are walls embedded with vegetation. They are vertical upstanding walls, usually with a soil, water and nutrient supply in the foundational structures to nurture the vegetative growth of the plants or flora planted on the walls. Several types of green wall systems depend on the type of walls, vegetation or foundational soil and water system feeding the walls. However, the three most popular types of green wall systems are panel/modular, tray, and freestanding green walls. These can be further subdivided and selected according to the needs and objectives of the space in which the green walls will be incorporated. The first green wall system was created in the 1930s by Stanley Hart White. He was a professor of landscape architecture at the University of Illinois. Green walls offer several benefits. The space enclosed by green walls witnesses better air quality, reduces air pollution, and provides cleaner air to users. They are also highly effective in filtering sounds, acting as an acoustic barrier, and offering a calm space. Green walls facilitate the natural cooling of the place, eventually reducing energy costs. Furthermore, green walls are an ideal way to represent and achieve sustainability. Green walls enhance the space's visual appearance, offering a calm, serene and productive environment for the users to work in. It is calming for the eyes and the mind, cool for the body, and overall aesthetics are desirable compared to conventional concrete walls. Therefore, the several benefits offered by green walls will increase their demand in the forecast period.
Get an overview of this study by requesting a free sample
The rapid pace of urbanization worldwide – The rise in population with increasing disposable income has facilitated a shift towards urban settlements. Urban settlement offers more employment opportunities which are driving the rural-urban migration. Furthermore, it offers more amenities and better access to these amenities. Urban settlements offer a chance to improve the population's standard of living and quality of life. The expanding manufacturing and service sector are also contributing to rapid urbanization. The growing fiscal investment towards developing smart cities is also gaining traction in the developing world. The increasing population, rapid urbanization and growing government initiatives towards developing urban settlements are driving rapid urbanization worldwide. The building and construction sector is at the forefront of rapid urbanization, offering spaces for residential, commercial, industrial and governmental work. The rising concerns over air pollution, high temperatures, and noise pollution have gravitated the building and construction industry to incorporate sustainable and eco-friendly solutions in their products. Green walls are highly popular given their effectiveness in reducing air pollution, acoustics management, thermal insulation, and adjustments. They are highly sustainable, which contributes to their growing popularity worldwide. Therefore, rapid urbanization will benefit the global green walls market.
The need to properly maintain green walls – Green walls have vegetation fed by the soil and water system beneath them. The continuous flow of water and soil, adequate sunlight and proper nutrition must be ensured to keep them alive. Any leakage or lack of proper maintenance can lead to spillage, creating a mess in the internal spaces; it can impact the integrity of the walls and have undesirable effects on the vegetation. Furthermore, the vegetation is likely to attract insects if not checked regularly, which can be dangerous for the users. Regular conditioning, trimming, and other maintenance to keep the vegetation in check and aesthetically pleasing to the viewers involve substantial capital. Therefore, properly maintaining green walls requires high capital, skilled personnel, time and effort, which can potentially hamper the market's growth.
The favourable government initiatives and regulations – The growing concerns have climate change have encouraged governments worldwide to adopt eco-friendly and sustainable policies wherever possible and feasible. Climate change is already causing high temperatures, which has rendered millions vulnerable to heat exhaustion and heat strokes. Air conditioning is a costly and unsustainable means of beating high temperatures. Therefore, the government is promoting green walls as an effective and sustainable alternative to manage temperatures. Green walls can reduce air pollution, provide cleaner air, reduce noise pollution and offer thermal insulation with their vegetation. The residential, commercial, and industrial spaces are encouraged to adopt green walls with favourable regulations, incentives and moral persuasion. Therefore, favourable government initiatives will offer lucrative global green walls market opportunities in the forecast period.
The regions analyzed for the market include North America, Europe, South America, Asia Pacific, the Middle East, and Africa. North America emerged as the largest market for the global green walls market, with a 36% share of the market revenue in 2022.
North American region will account for the largest market share with revenue growth. The growing infrastructural investment by the public and private players will propel the growth of the building and construction sector, thereby driving the regional green walls market's growth. Furthermore, the technological advancements and greater access to products, given the presence of key players in the market, will propel the region's growth. The increasing emphasis on sustainable measures in the economic sector of the market will bode well for the regional green walls market.
North America Region Green Walls Market Share in 2022 - 36%
www.thebrainyinsights.com
Check the geographical analysis of this market by requesting a free sample
The type segment is divided into felt, panel and trellis. The panel segment dominated the market, with a market share of around 43% in 2022. Panel systems are versatile as they can be used in any weather conditions in both indoor and outdoor spaces. The panel system can accommodate plants with various watering requirements and supports a varied design palette. Panel systems use plants pre-grown inside the panels in a nursery and mounted vertically onto a framing support system, making them ideal for brand statements and custom designs. Therefore, they are extensively used in commercial spaces. The design requirements and functionality of panel systems allow fully developed, diversified, and densely populated plants to be installed. Panel systems enable easy access to irrigation lines, making them simple to remove.
The application segment is divided into indoor and outdoor. The outdoor segment dominated the market, with a market share of around 57% in 2022. The government and local bodies are driving the outdoor segment as they are extensively using green walls on roadsides, flyovers and bridges to control air pollution and high temperatures. Several government initiatives with substantial capital outlay to install vertical gardens with diverse vegetation to beautify outdoor spaces, reduce air and noise pollution and cool the surrounding environment. The commercial, residential and industrial units also incorporate green walls on their outer spaces to install a barrier for harsh weather conditions. They beautify the spaces using different patterns, sizes, shapes and colours with diverse vegetation. These green walls also enable them to meet their sustainability goals mandated by the government.
The medium segment is divided into loose growth, mat, sheet and structural. The mat segment dominated the market, with a market share of around 35% in 2022. Mat media systems are thin which works well within buildings. They are suitable for places with little seismic activity. They are used with small plants. Mat media work well in tiny installations no taller than eight feet and can be quickly repaired.
The end-user segment is divided into office spaces, hospitals, residential, landscaping, hotels and restaurants, public spaces, manufacturing facilities and others. The manufacturing facilities segment dominated the market, with a market share of around 30% in 2022. Rapid industrialization in the developing world will drive the demand for green walls in manufacturing facilities. Given the rising population, the increasing consumer demand will drive the growth of manufacturing facilities, which will drive the segment's growth in the global green walls market.
| Attribute | Description |
|---|---|
| Market Size | Revenue (USD Billion) |
| Market size value in 2022 | USD 2 Billion |
| Market size value in 2032 | USD 4.31 Billion |
| CAGR (2023 to 2032) | 8% |
| Historical data | 2019-2021 |
| Base Year | 2022 |
| Forecast | 2023-2032 |
| Regional Segments | The regions analyzed for the market are Asia Pacific, Europe, South America, North America, and Middle East & Africa. Furthermore, the regions are further analyzed at the country level. |
| Segments | Type, Application, Medium and End User |
1. Introduction
1.1. Objectives of the Study
1.2. Market Definition
1.3. Research Scope
1.4. Currency
1.5. Key Target Audience
2. Research Methodology and Assumptions
3. Executive Summary
4. Premium Insights
4.1. Porter’s Five Forces Analysis
4.2. Value Chain Analysis
4.3. Top Investment Pockets
4.3.1. Market Attractiveness Analysis by Type
4.3.2. Market Attractiveness Analysis by Application
4.3.3. Market Attractiveness Analysis by Medium
4.3.4. Market Attractiveness Analysis by End User
4.3.5. Market Attractiveness Analysis by Region
4.4. Industry Trends
5. Market Dynamics
5.1. Market Evaluation
5.2. Drivers
5.2.1. The rapid pace of urbanization worldwide
5.3. Restraints
5.3.1. The proper maintenance of green walls
5.4. Opportunities
5.4.1. The favorable government initiatives and regulations
5.5. Challenges
5.5.1. The availability of other sustainable options
6. Global Green Walls Market Analysis and Forecast, By Type
6.1. Segment Overview
6.2. Felt
6.3. Panel
6.4. Trellis
7. Global Green Walls Market Analysis and Forecast, By Application
7.1. Segment Overview
7.2. Indoor
7.3. Outdoor
8. Global Green Walls Market Analysis and Forecast, By Medium
8.1. Segment Overview
8.2. Loose Growth
8.3. Mat
8.4. Sheet
8.5. Structural
9. Global Green Walls Market Analysis and Forecast, By End User
9.1. Segment Overview
9.2. Office Spaces
9.3. Hospitals
9.4. Residential
9.5. Landscaping
9.6. Hotels and Restaurants
9.7. Public Spaces
9.8. Manufacturing Facilities
9.9. Others
10. Global Green Walls Market Analysis and Forecast, By Regional Analysis
10.1. Segment Overview
10.2. North America
10.2.1. U.S.
10.2.2. Canada
10.2.3. Mexico
10.3. Europe
10.3.1. Germany
10.3.2. France
10.3.3. U.K.
10.3.4. Italy
10.3.5. Spain
10.4. Asia-Pacific
10.4.1. Japan
10.4.2. China
10.4.3. India
10.5. South America
10.5.1. Brazil
10.6. Middle East and Africa
10.6.1. UAE
10.6.2. South Africa
11. Global Green Walls Market-Competitive Landscape
11.1. Overview
11.2. Market Share of Key Players in the Green Walls Market
11.2.1. Global Company Market Share
11.2.2. North America Company Market Share
11.2.3. Europe Company Market Share
11.2.4. APAC Company Market Share
11.3. Competitive Situations and Trends
11.3.1. Product Launches and Developments
11.3.2. Partnerships, Collaborations, and Agreements
11.3.3. Mergers & Acquisitions
11.3.4. Expansions
12. Company Profiles
12.1. ANS Group Global Ltd
12.1.1. Business Overview
12.1.2. Company Snapshot
12.1.3. Company Market Share Analysis
12.1.4. Company Product Portfolio
12.1.5. Recent Developments
12.1.6. SWOT Analysis
12.2. Biotecture Ltd
12.2.1. Business Overview
12.2.2. Company Snapshot
12.2.3. Company Market Share Analysis
12.2.4. Company Product Portfolio
12.2.5. Recent Developments
12.2.6. SWOT Analysis
12.3. ELT India
12.3.1. Business Overview
12.3.2. Company Snapshot
12.3.3. Company Market Share Analysis
12.3.4. Company Product Portfolio
12.3.5. Recent Developments
12.3.6. SWOT Analysis
12.4. Green Mood
12.4.1. Business Overview
12.4.2. Company Snapshot
12.4.3. Company Market Share Analysis
12.4.4. Company Product Portfolio
12.4.5. Recent Developments
12.4.6. SWOT Analysis
12.5. GreenBlue Urban Ltd
12.5.1. Business Overview
12.5.2. Company Snapshot
12.5.3. Company Market Share Analysis
12.5.4. Company Product Portfolio
12.5.5. Recent Developments
12.5.6. SWOT Analysis
12.6. GSky Plant System Inc
12.6.1. Business Overview
12.6.2. Company Snapshot
12.6.3. Company Market Share Analysis
12.6.4. Company Product Portfolio
12.6.5. Recent Developments
12.6.6. SWOT Analysis
12.7. Meamea
12.7.1. Business Overview
12.7.2. Company Snapshot
12.7.3. Company Market Share Analysis
12.7.4. Company Product Portfolio
12.7.5. Recent Developments
12.7.6. SWOT Analysis
12.8. Moss Trend
12.8.1. Business Overview
12.8.2. Company Snapshot
12.8.3. Company Market Share Analysis
12.8.4. Company Product Portfolio
12.8.5. Recent Developments
12.8.6. SWOT Analysis
12.9. Paisajismo Panot Vegetal
12.9.1. Business Overview
12.9.2. Company Snapshot
12.9.3. Company Market Share Analysis
12.9.4. Company Product Portfolio
12.9.5. Recent Developments
12.9.6. SWOT Analysis
12.10. TREEBOX
12.10.1. Business Overview
12.10.2. Company Snapshot
12.10.3. Company Market Share Analysis
12.10.4. Company Product Portfolio
12.10.5. Recent Developments
12.10.6. SWOT Analysis
List of Table
1. Global Green Walls Market, By Type, 2019-2032 (USD Billion)
2. Global Felt Green Walls Market, By Region, 2019-2032 (USD Billion)
3. Global Panel Green Walls Market, By Region, 2019-2032 (USD Billion)
4. Global Trellis Green Walls Market, By Region, 2019-2032 (USD Billion)
5. Global Green Walls Market, By Application, 2019-2032 (USD Billion)
6. Global Indoor Green Walls Market, By Region, 2019-2032 (USD Billion)
7. Global Outdoor Green Walls Market, By Region, 2019-2032 (USD Billion)
8. Global Green Walls Market, By Medium, 2019-2032 (USD Billion)
9. Global Loose Growth Green Walls Market, By Region, 2019-2032 (USD Billion)
10. Global Mat Green Walls Market, By Region, 2019-2032 (USD Billion)
11. Global Sheet Green Walls Market, By Region, 2019-2032 (USD Billion)
12. Global Structural Green Walls Market, By Region, 2019-2032 (USD Billion)
13. Global Green Walls Market, By End User, 2019-2032 (USD Billion)
14. Global Office Spaces Green Walls Market, By Region, 2019-2032 (USD Billion)
15. Global Hospitals Green Walls Market, By Region, 2019-2032 (USD Billion)
16. Global Residential Green Walls Market, By Region, 2019-2032 (USD Billion)
17. Global Landscaping Green Walls Market, By Region, 2019-2032 (USD Billion)
18. Global Hotels and Restaurants Green Walls Market, By Region, 2019-2032 (USD Billion)
19. Global Public Spaces Green Walls Market, By Region, 2019-2032 (USD Billion)
20. Global Manufacturing Facilities Green Walls Market, By Region, 2019-2032 (USD Billion)
21. Global Others Green Walls Market, By Region, 2019-2032 (USD Billion)
22. Global Green Walls Market, By Region, 2019-2032 (USD Billion)
23. North America Green Walls Market, By Type, 2019-2032 (USD Billion)
24. North America Green Walls Market, By Application, 2019-2032 (USD Billion)
25. North America Green Walls Market, By Medium, 2019-2032 (USD Billion)
26. North America Green Walls Market, By End User, 2019-2032 (USD Billion)
27. U.S. Green Walls Market, By Type, 2019-2032 (USD Billion)
28. U.S. Green Walls Market, By Application, 2019-2032 (USD Billion)
29. U.S. Green Walls Market, By Medium, 2019-2032 (USD Billion)
30. U.S. Green Walls Market, By End User, 2019-2032 (USD Billion)
31. Canada Green Walls Market, By Type, 2019-2032 (USD Billion)
32. Canada Green Walls Market, By Application, 2019-2032 (USD Billion)
33. Canada Green Walls Market, By Medium, 2019-2032 (USD Billion)
34. Canada Green Walls Market, By End User, 2019-2032 (USD Billion)
35. Mexico Green Walls Market, By Type, 2019-2032 (USD Billion)
36. Mexico Green Walls Market, By Application, 2019-2032 (USD Billion)
37. Mexico Green Walls Market, By Medium, 2019-2032 (USD Billion)
38. Mexico Green Walls Market, By End User, 2019-2032 (USD Billion)
39. Europe Green Walls Market, By Type, 2019-2032 (USD Billion)
40. Europe Green Walls Market, By Application, 2019-2032 (USD Billion)
41. Europe Green Walls Market, By Medium, 2019-2032 (USD Billion)
42. Europe Green Walls Market, By End User, 2019-2032 (USD Billion)
43. Germany Green Walls Market, By Type, 2019-2032 (USD Billion)
44. Germany Green Walls Market, By Application, 2019-2032 (USD Billion)
45. Germany Green Walls Market, By Medium, 2019-2032 (USD Billion)
46. Germany Green Walls Market, By End User, 2019-2032 (USD Billion)
47. France Green Walls Market, By Type, 2019-2032 (USD Billion)
48. France Green Walls Market, By Application, 2019-2032 (USD Billion)
49. France Green Walls Market, By Medium, 2019-2032 (USD Billion)
50. France Green Walls Market, By End User, 2019-2032 (USD Billion)
51. U.K. Green Walls Market, By Type, 2019-2032 (USD Billion)
52. U.K. Green Walls Market, By Application, 2019-2032 (USD Billion)
53. U.K. Green Walls Market, By Medium, 2019-2032 (USD Billion)
54. U.K. Green Walls Market, By End User, 2019-2032 (USD Billion)
55. Italy Green Walls Market, By Type, 2019-2032 (USD Billion)
56. Italy Green Walls Market, By Application, 2019-2032 (USD Billion)
57. Italy Green Walls Market, By Medium, 2019-2032 (USD Billion)
58. Italy Green Walls Market, By End User, 2019-2032 (USD Billion)
59. Spain Green Walls Market, By Type, 2019-2032 (USD Billion)
60. Spain Green Walls Market, By Application, 2019-2032 (USD Billion)
61. Spain Green Walls Market, By Medium, 2019-2032 (USD Billion)
62. Spain Green Walls Market, By End User, 2019-2032 (USD Billion)
63. Asia Pacific Green Walls Market, By Type, 2019-2032 (USD Billion)
64. Asia Pacific Green Walls Market, By Application, 2019-2032 (USD Billion)
65. Asia Pacific Green Walls Market, By Medium, 2019-2032 (USD Billion)
66. Asia Pacific Green Walls Market, By End User, 2019-2032 (USD Billion)
67. Japan Green Walls Market, By Type, 2019-2032 (USD Billion)
68. Japan Green Walls Market, By Application, 2019-2032 (USD Billion)
69. Japan Green Walls Market, By Medium, 2019-2032 (USD Billion)
70. Japan Green Walls Market, By End User, 2019-2032 (USD Billion)
71. China Green Walls Market, By Type, 2019-2032 (USD Billion)
72. China Green Walls Market, By Application, 2019-2032 (USD Billion)
73. China Green Walls Market, By Medium, 2019-2032 (USD Billion)
74. China Green Walls Market, By End User, 2019-2032 (USD Billion)
75. India Green Walls Market, By Type, 2019-2032 (USD Billion)
76. India Green Walls Market, By Application, 2019-2032 (USD Billion)
77. India Green Walls Market, By Medium, 2019-2032 (USD Billion)
78. India Green Walls Market, By End User, 2019-2032 (USD Billion)
79. South America Green Walls Market, By Type, 2019-2032 (USD Billion)
80. South America Green Walls Market, By Application, 2019-2032 (USD Billion)
81. South America Green Walls Market, By Medium, 2019-2032 (USD Billion)
82. South America Green Walls Market, By End User, 2019-2032 (USD Billion)
83. Brazil Green Walls Market, By Type, 2019-2032 (USD Billion)
84. Brazil Green Walls Market, By Application, 2019-2032 (USD Billion)
85. Brazil Green Walls Market, By Medium, 2019-2032 (USD Billion)
86. Brazil Green Walls Market, By End User, 2019-2032 (USD Billion)
87. Middle East and Africa Green Walls Market, By Type, 2019-2032 (USD Billion)
88. Middle East and Africa Green Walls Market, By Application, 2019-2032 (USD Billion)
89. Middle East and Africa Green Walls Market, By Medium, 2019-2032 (USD Billion)
90. Middle East and Africa Green Walls Market, By End User, 2019-2032 (USD Billion)
91. UAE Green Walls Market, By Type, 2019-2032 (USD Billion)
92. UAE Green Walls Market, By Application, 2019-2032 (USD Billion)
93. UAE Green Walls Market, By Medium, 2019-2032 (USD Billion)
94. UAE Green Walls Market, By End User, 2019-2032 (USD Billion)
95. South Africa Green Walls Market, By Type, 2019-2032 (USD Billion)
96. South Africa Green Walls Market, By Application, 2019-2032 (USD Billion)
97. South Africa Green Walls Market, By Medium, 2019-2032 (USD Billion)
98. South Africa Green Walls Market, By End User, 2019-2032 (USD Billion)
List of Figures
1. Global Green Walls Market Segmentation
2. Green Walls Market: Research Methodology
3. Market Size Estimation Methodology: Bottom-Up Approach
4. Market Size Estimation Methodology: Top-Down Approach
5. Data Triangulation
6. Porter’s Five Forces Analysis
7. Value Chain Analysis
8. Global Green Walls Market Attractiveness Analysis by Type
9. Global Green Walls Market Attractiveness Analysis by Application
10. Global Green Walls Market Attractiveness Analysis by Medium
11. Global Green Walls Market Attractiveness Analysis by End User
12. Global Green Walls Market Attractiveness Analysis by Region
13. Global Green Walls Market: Dynamics
14. Global Green Walls Market Share by Type (2022 & 2032)
15. Global Green Walls Market Share by Application (2022 & 2032)
16. Global Green Walls Market Share by Medium (2022 & 2032)
17. Global Green Walls Market Share by End User (2022 & 2032)
18. Global Green Walls Market Share by Regions (2022 & 2032)
19. Global Green Walls Market Share by Company (2022)
This study forecasts revenue at global, regional, and country levels from 2019 to 2032. The Brainy Insights has segmented the global green walls market based on below mentioned segments:
Global Green Walls Market by Type:
Global Green Walls Market by Application:
Global Green Walls Market by Medium:
Global Green Walls Market by End User:
Global Green Walls Market by Region:
Research has its special purpose to undertake marketing efficiently. In this competitive scenario, businesses need information across all industry verticals; the information about customer wants, market demand, competition, industry trends, distribution channels etc. This information needs to be updated regularly because businesses operate in a dynamic environment. Our organization, The Brainy Insights incorporates scientific and systematic research procedures in order to get proper market insights and industry analysis for overall business success. The analysis consists of studying the market from a miniscule level wherein we implement statistical tools which helps us in examining the data with accuracy and precision.
Our research reports feature both; quantitative and qualitative aspects for any market. Qualitative information for any market research process are fundamental because they reveal the customer needs and wants, usage and consumption for any product/service related to a specific industry. This in turn aids the marketers/investors in knowing certain perceptions of the customers. Qualitative research can enlighten about the different product concepts and designs along with unique service offering that in turn, helps define marketing problems and generate opportunities. On the other hand, quantitative research engages with the data collection process through interviews, e-mail interactions, surveys and pilot studies. Quantitative aspects for the market research are useful to validate the hypotheses generated during qualitative research method, explore empirical patterns in the data with the help of statistical tools, and finally make the market estimations.
The Brainy Insights offers comprehensive research and analysis, based on a wide assortment of factual insights gained through interviews with CXOs and global experts and secondary data from reliable sources. Our analysts and industry specialist assume vital roles in building up statistical tools and analysis models, which are used to analyse the data and arrive at accurate insights with exceedingly informative research discoveries. The data provided by our organization have proven precious to a diverse range of companies, facilitating them to address issues such as determining which products/services are the most appealing, whether or not customers use the product in the manner anticipated, the purchasing intentions of the market and many others.
Our research methodology encompasses an idyllic combination of primary and secondary initiatives. Key phases involved in this process are listed below:

The phase involves the gathering and collecting of market data and its related information with the help of different sources & research procedures.

The data procurement stage involves in data gathering and collecting through various data sources.
This stage involves in extensive research. These data sources includes:
Purchased Database: Purchased databases play a crucial role in estimating the market sizes irrespective of the domain. Our purchased database includes:
Primary Research: The Brainy Insights interacts with leading companies and experts of the concerned domain to develop the analyst team’s market understanding and expertise. It improves and substantiates every single data presented in the market reports. Primary research mainly involves in telephonic interviews, E-mail interactions and face-to-face interviews with the raw material providers, manufacturers/producers, distributors, & independent consultants. The interviews that we conduct provides valuable data on market size and industry growth trends prevailing in the market. Our organization also conducts surveys with the various industry experts in order to gain overall insights of the industry/market. For instance, in healthcare industry we conduct surveys with the pharmacists, doctors, surgeons and nurses in order to gain insights and key information of a medical product/device/equipment which the customers are going to usage. Surveys are conducted in the form of questionnaire designed by our own analyst team. Surveys plays an important role in primary research because surveys helps us to identify the key target audiences of the market. Additionally, surveys helps to identify the key target audience engaged with the market. Our survey team conducts the survey by targeting the key audience, thus gaining insights from them. Based on the perspectives of the customers, this information is utilized to formulate market strategies. Moreover, market surveys helps us to understand the current competitive situation of the industry. To be precise, our survey process typically involve with the 360 analysis of the market. This analytical process begins by identifying the prospective customers for a product or service related to the market/industry to obtain data on how a product/service could fit into customers’ lives.

Secondary Research: The secondary data sources includes information published by the on-profit organizations such as World bank, WHO, company fillings, investor presentations, annual reports, national government documents, statistical databases, blogs, articles, white papers and others. From the annual report, we analyse a company’s revenue to understand the key segment and market share of that organization in a particular region. We analyse the company websites and adopt the product mapping technique which is important for deriving the segment revenue. In the product mapping method, we select and categorize the products offered by the companies catering to domain specific market, deduce the product revenue for each of the companies so as to get overall estimation of the market size. We also source data and analyses trends based on information received from supply side and demand side intermediaries in the value chain. The supply side denotes the data gathered from supplier, distributor, wholesaler and the demand side illustrates the data gathered from the end customers for respective market domain.

The supply side for a domain specific market is analysed by:
The demand side for the market is estimated through:
In-house Library: Apart from these third-party sources, we have our in-house library of qualitative and quantitative information. Our in-house database includes market data for various industry and domains. These data are updated on regular basis as per the changing market scenario. Our library includes, historic databases, internal audit reports and archives.
Sometimes there are instances where there is no metadata or raw data available for any domain specific market. For those cases, we use our expertise to forecast and estimate the market size in order to generate comprehensive data sets. Our analyst team adopt a robust research technique in order to produce the estimates:
Data Synthesis: This stage involves the analysis & mapping of all the information obtained from the previous step. It also involves in scrutinizing the data for any discrepancy observed while data gathering related to the market. The data is collected with consideration to the heterogeneity of sources. Robust scientific techniques are in place for synthesizing disparate data sets and provide the essential contextual information that can orient market strategies. The Brainy Insights has extensive experience in data synthesis where the data passes through various stages:


Market Deduction & Formulation: The final stage comprises of assigning data points at appropriate market spaces so as to deduce feasible conclusions. Analyst perspective & subject matter expert based holistic form of market sizing coupled with industry analysis also plays a crucial role in this stage.
This stage involves in finalization of the market size and numbers that we have collected from data integration step. With data interpolation, it is made sure that there is no gap in the market data. Successful trend analysis is done by our analysts using extrapolation techniques, which provide the best possible forecasts for the market.
Data Validation & Market Feedback: Validation is the most important step in the process. Validation & re-validation via an intricately designed process helps us finalize data-points to be used for final calculations.

The Brainy Insights interacts with leading companies and experts of the concerned domain to develop the analyst team’s market understanding and expertise. It improves and substantiates every single data presented in the market reports. The data validation interview and discussion panels are typically composed of the most experienced industry members. The participants include, however, are not limited to:
Moreover, we always validate our data and findings through primary respondents from all the major regions we are working on.


Free Customization
Fortune 500 Clients
Free Yearly Update On Purchase Of Multi/Corporate License
Companies Served Till Date