- +1-315-215-1633
- sales@thebrainyinsights.com

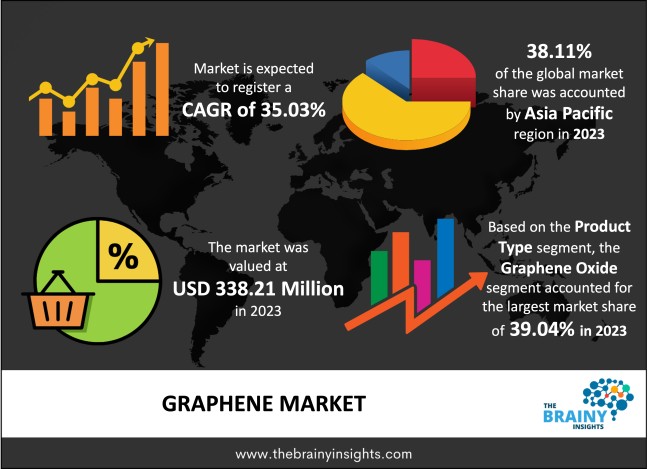
The global graphene market was valued at USD 338.21 Million in 2023 and grew at a CAGR of 35.03% from 2024 to 2033. The market is expected to reach USD 6815.36 Million by 2033. The growth of the graphene market can be attributed to the rising applications of it in different end-user industries such as construction, automotive, healthcare, energy, etc. Further, the increasing investment in energy efficiency has played a pivotal role in the market growth.
One of the most significant elements in nature, graphene, is a substance derived from graphite and present in commonplace items like pencil lead. Graphene is distinguished by its flexibility, strength, excellent resistance and low weight. This material is estimated to be five times lighter than aluminium and 200 times more resistant than steel. These qualities make graphene useful in energy, electronics, building, and healthcare. For example, by enabling increased comfort and accessibility for all users, magnetic graphene can potentially revolutionize the electronics sector. Graphene has become one of the most promising nanomaterials due to its unique combination of remarkable properties: it is the thinnest, strongest, and most heat-conductive material available; it is also optically transparent but so dense that not even the smallest gas atom can pass through it; and it is an excellent conductor of electricity.
Get an overview of this study by requesting a free sample
Increasing applications in the electronics industry: The properties of graphene can potentially revolutionize the electronics industry. Using these materials, gadgets that are currently unattainable with today's components can be produced—lighter, smaller, harder, and more efficient. Moreover, using graphene in electrical circuits would render the devices immune to moisture, which is a primary cause of deterioration. Its outstanding electrical and thermal conductivity is also a thousand times greater than that of copper. Applying graphene as a coating can enhance present-day touch displays on phones and tablets. It can also be utilized to create the extremely fast circuitry seen in computers. Both graphene's mechanical and electrical properties are utilized in flexible, wearable electronics.
Production cost: Graphene varies from $100 to $450,000 per pound, or around $1,000 per gram. The manufacturing process and raw materials define the quality, determining the price. Multi-layer graphene ranges in price from $50 to $1,500 per kilogramme, while graphene with 1-2 layers can cost as much as $100,000 per square metre.
Increasing growth of printed electronics: Throughout the forecast period, the market is expected to be driven primarily by the growing global use of IoT. Throughout the projection period, technological application is anticipated to be driven by the telecom industry's ever-increasing need for IoT to improve network performance and operations. Competent industry companies invest significantly in associated R&D projects to expand their product offerings and build brand recognition. The use of dependable and efficient technology, like printed electronics, has ultimately proven to be essential for businesses worldwide. As a result, printed electronics are expected to garner significant attention throughout the consumer electronics sector during the forecast period.
The regions analyzed for the market include North America, Europe, South America, Asia Pacific, the Middle East, and Africa. Asia-Pacific emerged as the most significant graphene market, with a 38.11% market revenue share in 2023.
Asia Pacific region will account for the largest market share with revenue growth. The market is being driven by the numerous end-user businesses in the regional countries. The consumer electronics industry's fastest growth rates are shown in the demand for electronic gadgets, including OLED TVs, tablets, and smartphones. The region has a high demand for graphene to meet the required consumer electronics manufacturing. The growing investment in the automotive and healthcare industry, especially in China, India and Japan, is attracting more regional manufacturers. Further, developing advanced electronic components increases the demand for graphene.
Asia-Pacific region Graphene Market Share in 2023 - 38.11%
www.thebrainyinsights.com
Check the geographical analysis of this market by requesting a free sample
The product type segment is divided into bulk graphene, graphene oxide, monolayer graphene, reduced graphene oxide, graphene nanoplatelets and others. The graphene oxide segment dominated the market, with a share of around 39.04% in 2023. Graphene oxide is graphene that has undergone oxidation. It is an inexpensive, widely accessible substance made of single atomic layers produced through graphite oxidation. As GO has large functional groups that contain oxygen, it is easily functionalized.
The application segment is divided into paints and coatings, composites, electronic components, solar panels, catalyst, tires and others. The electronic components segment dominated the market, with a share of around 41.58% in 2023. Global research into graphene's potential uses as a semiconductor has been sparked by the material's exceptional conductivity and thinness. Graphene semiconductors, which are only one atom thick and carry electricity at normal temperature, can potentially replace current computer chip technology.
The end-user segment is divided into aerospace and defence, automotive, electronics, healthcare, energy and others. The automotive segment dominated the market, with a share of around 38.32% in 2023. This potential use of graphene in automobile coatings extends beyond the vehicle's exterior to any area where a coating is applied to enhance corrosion resistance, lubricate or reduce friction, and shield underneath components or gadgets.
Report Description:
| Attribute | Description |
|---|---|
| Market Size | Revenue (USD Million) |
| Market size value in 2023 | USD 338.21 Million |
| Market size value in 2033 | USD 6815.36 Million |
| CAGR (2024 to 2033) | 35.03% |
| Historical data | 2020-2022 |
| Base Year | 2023 |
| Forecast | 2024-2033 |
| Region | The regions analyzed for the market are Asia Pacific, Europe, South America, North America, and Middle East & Africa. Furthermore, the regions are further analyzed at the country level. |
| Segments | Product Type, Application and End-user |
As per The Brainy Insights, the size of the graphene market was valued at USD 338.21 Million in 2023 to USD 6815.36 Million by 2033.
Global graphene market is growing at a CAGR of 35.03% during the forecast period 2024-2033.
Asia Pacific region emerged as the largest market for the graphene.
The market's growth will be influenced by the growing usage of grapheme across several industries.
The high cost can hamper the market growth.
The increasing investment in printed electronics is providing huge opportunities to the market.
1. Introduction
1.1. Objectives of the Study
1.2. Market Definition
1.3. Research Scope
1.4. Currency
1.5. Key Target Audience
2. Research Methodology and Assumptions
3. Executive Summary
4. Premium Insights
4.1. Porter’s Five Forces Analysis
4.2. Value Chain Analysis
4.3. Top Investment Pockets
4.3.1. Market Attractiveness Analysis by Product Type
4.3.2. Market Attractiveness Analysis by Application
4.3.3. Market Attractiveness Analysis by End-user
4.3.4. Market Attractiveness Analysis by Region
4.4. Industry Trends
5. Market Dynamics
5.1. Market Evaluation
5.2. Drivers
5.2.1. Increasing use of graphene across End-users
5.3. Restraints
5.3.1. High cost
5.4. Opportunities
5.4.1. Increasing investment in printed electronics
5.5. Challenges
5.5.1. Toxicity
6. Global Graphene Market Analysis and Forecast, By Product Type
6.1. Segment Overview
6.2. Bulk Graphene
6.3. Graphene Oxide
6.4. Monolayer Graphene
6.5. Reduced Graphene Oxide
6.6. Graphene Nanoplatelets
6.7. Others
7. Global Graphene Market Analysis and Forecast, By Application
7.1. Segment Overview
7.2. Paints and Coatings
7.3. Composites
7.4. Electronic Components
7.5. Solar Panels
7.6. Catalyst
7.7. Tires
7.8. Others
8. Global Graphene Market Analysis and Forecast, By End-user
8.1. Segment Overview
8.2. Aerospace and Defense
8.3. Automotive
8.4. Electronics
8.5. Healthcare
8.6. Energy
8.7. Others
9. Global Graphene Market Analysis and Forecast, By Regional Analysis
9.1. Segment Overview
9.2. North America
9.2.1. U.S.
9.2.2. Canada
9.2.3. Mexico
9.3. Europe
9.3.1. Germany
9.3.2. France
9.3.3. U.K.
9.3.4. Italy
9.3.5. Spain
9.4. Asia-Pacific
9.4.1. Japan
9.4.2. China
9.4.3. India
9.5. South America
9.5.1. Brazil
9.6. Middle East and Africa
9.6.1. UAE
9.6.2. South Africa
10. Global Graphene Market-Competitive Landscape
10.1. Overview
10.2. Market Share of Key Players in the Graphene Market
10.2.1. Global Company Market Share
10.2.2. North America Company Market Share
10.2.3. Europe Company Market Share
10.2.4. APAC Company Market Share
10.3. Competitive Situations and Trends
10.3.1. Product Launches and Developments
10.3.2. Partnerships, Collaborations, and Agreements
10.3.3. Mergers & Acquisitions
10.3.4. Expansions
11. Company Profiles
11.1. 2D Carbon Graphene Material Co., Ltd.
11.1.1. Business Overview
11.1.2. Company Snapshot
11.1.3. Company Market Share Analysis
11.1.4. Company Product Portfolio
11.1.5. Recent Developments
11.1.6. SWOT Analysis
11.2. Applied Graphene Materials
11.2.1. Business Overview
11.2.2. Company Snapshot
11.2.3. Company Market Share Analysis
11.2.4. Company Product Portfolio
11.2.5. Recent Developments
11.2.6. SWOT Analysis
11.3. Thomas Swan & Co. Ltd.
11.3.1. Business Overview
11.3.2. Company Snapshot
11.3.3. Company Market Share Analysis
11.3.4. Company Product Portfolio
11.3.5. Recent Developments
11.3.6. SWOT Analysis
11.4. Graphensic AB
11.4.1. Business Overview
11.4.2. Company Snapshot
11.4.3. Company Market Share Analysis
11.4.4. Company Product Portfolio
11.4.5. Recent Developments
11.4.6. SWOT Analysis
11.5. Graphene Laboratories, Inc.
11.5.1. Business Overview
11.5.2. Company Snapshot
11.5.3. Company Market Share Analysis
11.5.4. Company Product Portfolio
11.5.5. Recent Developments
11.5.6. SWOT Analysis
11.6. Talga Group
11.6.1. Business Overview
11.6.2. Company Snapshot
11.6.3. Company Market Share Analysis
11.6.4. Company Product Portfolio
11.6.5. Recent Developments
11.6.6. SWOT Analysis
11.7. BGT Materials Limited, Ltd.
11.7.1. Business Overview
11.7.2. Company Snapshot
11.7.3. Company Market Share Analysis
11.7.4. Company Product Portfolio
11.7.5. Recent Developments
11.7.6. SWOT Analysis
11.8. ACS Material
11.8.1. Business Overview
11.8.2. Company Snapshot
11.8.3. Company Market Share Analysis
11.8.4. Company Product Portfolio
11.8.5. Recent Developments
11.8.6. SWOT Analysis
11.9. Directa Plus S.p.A.
11.9.1. Business Overview
11.9.2. Company Snapshot
11.9.3. Company Market Share Analysis
11.9.4. Company Product Portfolio
11.9.5. Recent Developments
11.9.6. SWOT Analysis
11.10. NanoXplore Inc.
11.10.1. Business Overview
11.10.2. Company Snapshot
11.10.3. Company Market Share Analysis
11.10.4. Company Product Portfolio
11.10.5. Recent Developments
11.10.6. SWOT Analysis
11.11. Grafoid Inc
11.11.1. Business Overview
11.11.2. Company Snapshot
11.11.3. Company Market Share Analysis
11.11.4. Company Product Portfolio
11.11.5. Recent Developments
11.11.6. SWOT Analysis
11.12. Haydale Graphene Industries PLC
11.12.1. Business Overview
11.12.2. Company Snapshot
11.12.3. Company Market Share Analysis
11.12.4. Company Product Portfolio
11.12.5. Recent Developments
11.12.6. SWOT Analysis
List of Table
1. Global Graphene Market, By Product Type, 2020-2033 (USD Million)
2. Global Bulk Graphene, Graphene Market, By Region, 2020-2033 (USD Million)
3. Global Graphene Oxide, Graphene Market, By Region, 2020-2033 (USD Million)
4. Global Monolayer Graphene, Graphene Market, By Region, 2020-2033 (USD Million)
5. Global Reduced Graphene Oxide, Graphene Market, By Region, 2020-2033 (USD Million)
6. Global Graphene Nanoplatelets, Graphene Market, By Region, 2020-2033 (USD Million)
7. Global Others, Graphene Market, By Region, 2020-2033 (USD Million)
8. Global Graphene Market, By Application, 2020-2033 (USD Million)
9. Global Paints and Coatings, Graphene Market, By Region, 2020-2033 (USD Million)
10. Global Composites, Graphene Market, By Region, 2020-2033 (USD Million)
11. Global Electronic Components, Graphene Market, By Region, 2020-2033 (USD Million)
12. Global Solar Panels, Graphene Market, By Region, 2020-2033 (USD Million)
13. Global Catalyst, Graphene Market, By Region, 2020-2033 (USD Million)
14. Global Tires, Graphene Market, By Region, 2020-2033 (USD Million)
15. Global Others, Graphene Market, By Region, 2020-2033 (USD Million)
16. Global Graphene Market, By End-user, 2020-2033 (USD Million)
17. Global Aerospace and Defense, Graphene Market, By Region, 2020-2033 (USD Million)
18. Global Automotive, Graphene Market, By Region, 2020-2033 (USD Million)
19. Global Electronics, Graphene Market, By Region, 2020-2033 (USD Million)
20. Global Healthcare, Graphene Market, By Region, 2020-2033 (USD Million)
21. Global Energy, Graphene Market, By Region, 2020-2033 (USD Million)
22. Global Others, Graphene Market, By Region, 2020-2033 (USD Million)
23. Global Graphene Market, By Region, 2020-2033 (USD Million)
24. North America Graphene Market, By Product Type, 2020-2033 (USD Million)
25. North America Graphene Market, By Application, 2020-2033 (USD Million)
26. North America Graphene Market, By End-user, 2020-2033 (USD Million)
27. U.S. Graphene Market, By Product Type, 2020-2033 (USD Million)
28. U.S. Graphene Market, By Application, 2020-2033 (USD Million)
29. U.S. Graphene Market, By End-user, 2020-2033 (USD Million)
30. Canada Graphene Market, By Product Type, 2020-2033 (USD Million)
31. Canada Graphene Market, By Application, 2020-2033 (USD Million)
32. Canada Graphene Market, By End-user, 2020-2033 (USD Million)
33. Mexico Graphene Market, By Product Type, 2020-2033 (USD Million)
34. Mexico Graphene Market, By Application, 2020-2033 (USD Million)
35. Mexico Graphene Market, By End-user, 2020-2033 (USD Million)
36. Europe Graphene Market, By Product Type, 2020-2033 (USD Million)
37. Europe Graphene Market, By Application, 2020-2033 (USD Million)
38. Europe Graphene Market, By End-user, 2020-2033 (USD Million)
39. Germany Graphene Market, By Product Type, 2020-2033 (USD Million)
40. Germany Graphene Market, By Application, 2020-2033 (USD Million)
41. Germany Graphene Market, By End-user, 2020-2033 (USD Million)
42. France Graphene Market, By Product Type, 2020-2033 (USD Million)
43. France Graphene Market, By Application, 2020-2033 (USD Million)
44. France Graphene Market, By End-user, 2020-2033 (USD Million)
45. U.K. Graphene Market, By Product Type, 2020-2033 (USD Million)
46. U.K. Graphene Market, By Application, 2020-2033 (USD Million)
47. U.K. Graphene Market, By End-user, 2020-2033 (USD Million)
48. Italy Graphene Market, By Product Type, 2020-2033 (USD Million)
49. Italy Graphene Market, By Application, 2020-2033 (USD Million)
50. Italy Graphene Market, By End-user, 2020-2033 (USD Million)
51. Spain Graphene Market, By Product Type, 2020-2033 (USD Million)
52. Spain Graphene Market, By Application, 2020-2033 (USD Million)
53. Spain Graphene Market, By End-user, 2020-2033 (USD Million)
54. Asia Pacific Graphene Market, By Product Type, 2020-2033 (USD Million)
55. Asia Pacific Graphene Market, By Application, 2020-2033 (USD Million)
56. Asia Pacific Graphene Market, By End-user, 2020-2033 (USD Million)
57. Japan Graphene Market, By Product Type, 2020-2033 (USD Million)
58. Japan Graphene Market, By Application, 2020-2033 (USD Million)
59. Japan Graphene Market, By End-user, 2020-2033 (USD Million)
60. China Graphene Market, By Product Type, 2020-2033 (USD Million)
61. China Graphene Market, By Application, 2020-2033 (USD Million)
62. China Graphene Market, By End-user, 2020-2033 (USD Million)
63. India Graphene Market, By Product Type, 2020-2033 (USD Million)
64. India Graphene Market, By Application, 2020-2033 (USD Million)
65. India Graphene Market, By End-user, 2020-2033 (USD Million)
66. South America Graphene Market, By Product Type, 2020-2033 (USD Million)
67. South America Graphene Market, By Application, 2020-2033 (USD Million)
68. South America Graphene Market, By End-user, 2020-2033 (USD Million)
69. Brazil Graphene Market, By Product Type, 2020-2033 (USD Million)
70. Brazil Graphene Market, By Application, 2020-2033 (USD Million)
71. Brazil Graphene Market, By End-user, 2020-2033 (USD Million)
72. Middle East and Africa Graphene Market, By Product Type, 2020-2033 (USD Million)
73. Middle East and Africa Graphene Market, By Application, 2020-2033 (USD Million)
74. Middle East and Africa Graphene Market, By End-user, 2020-2033 (USD Million)
75. UAE Graphene Market, By Product Type, 2020-2033 (USD Million)
76. UAE Graphene Market, By Application, 2020-2033 (USD Million)
77. UAE Graphene Market, By End-user, 2020-2033 (USD Million)
78. South Africa Graphene Market, By Product Type, 2020-2033 (USD Million)
79. South Africa Graphene Market, By Application, 2020-2033 (USD Million)
80. South Africa Graphene Market, By End-user, 2020-2033 (USD Million)
List of Figures
1. Global Graphene Market Segmentation
2. Graphene Market: Research Methodology
3. Market Size Estimation Methodology: Bottom-Up Approach
4. Market Size Estimation Methodology: Top-Down Approach
5. Data Triangulation
6. Porter’s Five Forces Analysis
7. Value Chain Analysis
8. Global Graphene Market Attractiveness Analysis by Product Type
9. Global Graphene Market Attractiveness Analysis by Application
10. Global Graphene Market Attractiveness Analysis by End-user
11. Global Graphene Market Attractiveness Analysis by Region
12. Global Graphene Market: Dynamics
13. Global Graphene Market Share by Product Type (2023 & 2033)
14. Global Graphene Market Share by Application (2023 & 2033)
15. Global Graphene Market Share by End-user (2023 & 2033)
16. Global Graphene Market Share by Regions (2023 & 2033)
17. Global Graphene Market Share by Company (2023)
This study forecasts revenue at global, regional, and country levels from 2020 to 2033. The Brainy Insights has segmented the global graphene market based on below mentioned segments:
Global Graphene Market by Product Type:
Global Graphene Market by Application:
Global Graphene Market by End-user:
Global Graphene Market by Region:
Research has its special purpose to undertake marketing efficiently. In this competitive scenario, businesses need information across all industry verticals; the information about customer wants, market demand, competition, industry trends, distribution channels etc. This information needs to be updated regularly because businesses operate in a dynamic environment. Our organization, The Brainy Insights incorporates scientific and systematic research procedures in order to get proper market insights and industry analysis for overall business success. The analysis consists of studying the market from a miniscule level wherein we implement statistical tools which helps us in examining the data with accuracy and precision.
Our research reports feature both; quantitative and qualitative aspects for any market. Qualitative information for any market research process are fundamental because they reveal the customer needs and wants, usage and consumption for any product/service related to a specific industry. This in turn aids the marketers/investors in knowing certain perceptions of the customers. Qualitative research can enlighten about the different product concepts and designs along with unique service offering that in turn, helps define marketing problems and generate opportunities. On the other hand, quantitative research engages with the data collection process through interviews, e-mail interactions, surveys and pilot studies. Quantitative aspects for the market research are useful to validate the hypotheses generated during qualitative research method, explore empirical patterns in the data with the help of statistical tools, and finally make the market estimations.
The Brainy Insights offers comprehensive research and analysis, based on a wide assortment of factual insights gained through interviews with CXOs and global experts and secondary data from reliable sources. Our analysts and industry specialist assume vital roles in building up statistical tools and analysis models, which are used to analyse the data and arrive at accurate insights with exceedingly informative research discoveries. The data provided by our organization have proven precious to a diverse range of companies, facilitating them to address issues such as determining which products/services are the most appealing, whether or not customers use the product in the manner anticipated, the purchasing intentions of the market and many others.
Our research methodology encompasses an idyllic combination of primary and secondary initiatives. Key phases involved in this process are listed below:

The phase involves the gathering and collecting of market data and its related information with the help of different sources & research procedures.

The data procurement stage involves in data gathering and collecting through various data sources.
This stage involves in extensive research. These data sources includes:
Purchased Database: Purchased databases play a crucial role in estimating the market sizes irrespective of the domain. Our purchased database includes:
Primary Research: The Brainy Insights interacts with leading companies and experts of the concerned domain to develop the analyst team’s market understanding and expertise. It improves and substantiates every single data presented in the market reports. Primary research mainly involves in telephonic interviews, E-mail interactions and face-to-face interviews with the raw material providers, manufacturers/producers, distributors, & independent consultants. The interviews that we conduct provides valuable data on market size and industry growth trends prevailing in the market. Our organization also conducts surveys with the various industry experts in order to gain overall insights of the industry/market. For instance, in healthcare industry we conduct surveys with the pharmacists, doctors, surgeons and nurses in order to gain insights and key information of a medical product/device/equipment which the customers are going to usage. Surveys are conducted in the form of questionnaire designed by our own analyst team. Surveys plays an important role in primary research because surveys helps us to identify the key target audiences of the market. Additionally, surveys helps to identify the key target audience engaged with the market. Our survey team conducts the survey by targeting the key audience, thus gaining insights from them. Based on the perspectives of the customers, this information is utilized to formulate market strategies. Moreover, market surveys helps us to understand the current competitive situation of the industry. To be precise, our survey process typically involve with the 360 analysis of the market. This analytical process begins by identifying the prospective customers for a product or service related to the market/industry to obtain data on how a product/service could fit into customers’ lives.

Secondary Research: The secondary data sources includes information published by the on-profit organizations such as World bank, WHO, company fillings, investor presentations, annual reports, national government documents, statistical databases, blogs, articles, white papers and others. From the annual report, we analyse a company’s revenue to understand the key segment and market share of that organization in a particular region. We analyse the company websites and adopt the product mapping technique which is important for deriving the segment revenue. In the product mapping method, we select and categorize the products offered by the companies catering to domain specific market, deduce the product revenue for each of the companies so as to get overall estimation of the market size. We also source data and analyses trends based on information received from supply side and demand side intermediaries in the value chain. The supply side denotes the data gathered from supplier, distributor, wholesaler and the demand side illustrates the data gathered from the end customers for respective market domain.

The supply side for a domain specific market is analysed by:
The demand side for the market is estimated through:
In-house Library: Apart from these third-party sources, we have our in-house library of qualitative and quantitative information. Our in-house database includes market data for various industry and domains. These data are updated on regular basis as per the changing market scenario. Our library includes, historic databases, internal audit reports and archives.
Sometimes there are instances where there is no metadata or raw data available for any domain specific market. For those cases, we use our expertise to forecast and estimate the market size in order to generate comprehensive data sets. Our analyst team adopt a robust research technique in order to produce the estimates:
Data Synthesis: This stage involves the analysis & mapping of all the information obtained from the previous step. It also involves in scrutinizing the data for any discrepancy observed while data gathering related to the market. The data is collected with consideration to the heterogeneity of sources. Robust scientific techniques are in place for synthesizing disparate data sets and provide the essential contextual information that can orient market strategies. The Brainy Insights has extensive experience in data synthesis where the data passes through various stages:


Market Deduction & Formulation: The final stage comprises of assigning data points at appropriate market spaces so as to deduce feasible conclusions. Analyst perspective & subject matter expert based holistic form of market sizing coupled with industry analysis also plays a crucial role in this stage.
This stage involves in finalization of the market size and numbers that we have collected from data integration step. With data interpolation, it is made sure that there is no gap in the market data. Successful trend analysis is done by our analysts using extrapolation techniques, which provide the best possible forecasts for the market.
Data Validation & Market Feedback: Validation is the most important step in the process. Validation & re-validation via an intricately designed process helps us finalize data-points to be used for final calculations.

The Brainy Insights interacts with leading companies and experts of the concerned domain to develop the analyst team’s market understanding and expertise. It improves and substantiates every single data presented in the market reports. The data validation interview and discussion panels are typically composed of the most experienced industry members. The participants include, however, are not limited to:
Moreover, we always validate our data and findings through primary respondents from all the major regions we are working on.


Free Customization
Fortune 500 Clients
Free Yearly Update On Purchase Of Multi/Corporate License
Companies Served Till Date