- +1-315-215-1633
- sales@thebrainyinsights.com

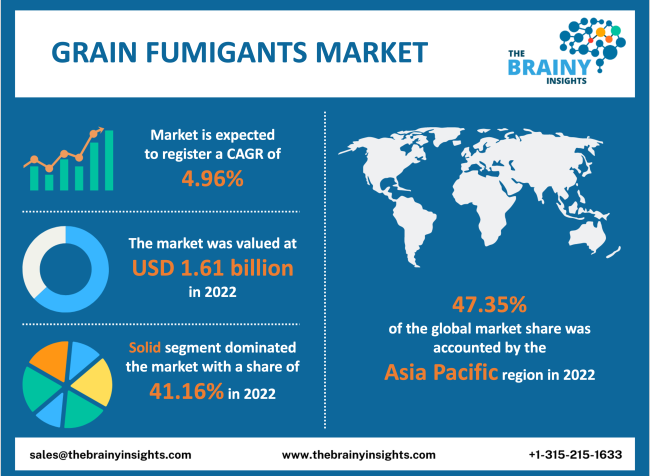
The global grain fumigants market was valued at USD 1.61 billion in 2022, increasing at a CAGR of 4.96% from 2022 to 2030 and anticipated to reach USD 2.37 billion by 2030. North America is expected to grow the fastest during the forecast period. Further, the adoption of improved agricultural practices and advancement in storage technology, along with the increasing usage of agricultural fumigants in food stock warehouses, are expected to drive market growth over the forecast period.
Fumigants are utilized for structural pest control, grain & food storage facilities, and regulatory pest control at ports of entry and state and national borders. Fumigation is a professional pest control technique that uses chemicals to control pests' growth. Fumigant's main disadvantages are that the therapy confers no residual security against reinfestation once the commodity is again exposed. The most effective fumigants are all highly toxic to humans and other non-target organisms. The grain fumigation method is carried out to exterminate pests in the grain warehouse or building. Fumigation is also carried out on products to be imported or exported to avoid products holding potentially dangerous pests or organisms, and this is usually called ship or container fumigation. Grain fumigation can deliver the answer early in the cycle, eliminating even very low initial pest infestation levels. Pest fumigation supports millers (bin fumigation), farmers (silo & stack fumigation), logistics firms (shipping and containers) and exporters/importers. Utilizing phosphine gas generated from magnesium phosphide or aluminium phosphide permits the safe fumigation of foods without harmful residues. This gas can also successfully permeate associated packaging, like cardboard, and leave the packaging intact.
Get an overview of this study by requesting a free sample
The rising demand for well-resourced grain storage units: The increasing health concerns and the need to maintain a healthy environment in the commercial and residential sector is one of the driving factors of the market growth. Further, the higher efficiency of fumigants in terms of application, and the ever-increasing demand for sulfuryl fluoride from the agriculture end-use industry are helping to stimulate market growth. Additionally, the shift in consumers' preferences toward fruits and green vegetables, rising demand for large-capacity storage, and increasing demand for agricultural commodities propel market growth.
The rising side-effects on crops: The fumigants can be in gaseous form; they may move from soil to air and may move off-site, which may cause adverse effects on the health conditions of the people, hampering the market growth. Moreover, the proliferation in the tolerance & proposed ban for methyl bromide and issues with licenses or special permits needed to handle fumigation services are expected to hinder the market growth. Some chemicals are highly effective & banned these fumigants to utilizing on crops because of their high toxicity level. Moreover, the stringent regulations & accumulation of residue during fumigation are anticipated to hamper the market growth.
The rising awareness about the need for pest control: The increasing awareness regarding the advantages of fumigation over the other traditional pest control techniques is the driving factor of the market growth. Further, strong product innovation among manufacturers with new product ranges is also helping boost the market growth during the forecast period. Moreover, the increasing input costs and the requirement for heavy investment in grain storage are driving the market growth over the forecast period. Apart from this, increasing resistance to chemicals among pest and the rising demand for agricultural produce are expected to drive market growth.
The regions analyzed for the market include Europe, South America, Asia Pacific, North America, the Middle East, and Africa. Asia Pacific emerged as the largest global grain fumigants market, with a 47.35% market revenue share in 2022. Asia Pacific dominates the grain fumigants market due to the rising awareness about the benefits of organic farming practices. Also, the increasing demand for phosphine fumigation for several applications, such as insect infestations, is propelling market growth in this region. However, the growing production and consumption of cereals and grains, along with the increasing adoption of advanced storage technologies in warehouses, are expected to drive market growth in this region during the forecast period. Additionally, the surge in demand for agricultural chemicals, along with the rising demand for products of superior quality, are stimulating market growth in this region over the forecast period. Additionally, North America is expected to grow the fastest during the forecast period due to the rapidly increasing usage of such agrochemicals in developing countries. Moreover, advancement in warehouse and storage facilities, coupled with raising awareness about the benefits of organic farming practices, is anticipated to propel market growth. Additionally, the technological advances in storage and agriculture, along with the increasing demand for grain storage from the world’s leading grain-producing countries, are helping to boost the market growth in this region during the forecast period.
Asia Pacific Region Grain Fumigants Market Share in 2022 - 47.35%
www.thebrainyinsights.com
Check the geographical analysis of this market by requesting a free sample
The form segment is divided into gas, solid, and liquid. The solid segment dominated, with a market share of around 41.16% in 2022. This growth is attributed to the increasing role of pest attacks on high-value crops and daily crops. Also, its eco-friendly nature & high effectiveness in warehouse fumigation over the gaseous & liquid form fumigants are supporting to boost the segment’s market growth. Further, by 2030, the liquid segment will likely dominate the market due to its high ability to reach insects in stored places.
The product type segment is divided into sulfuryl fluoride, phosphine, methyl bromide, and others. In 2022, the phosphine segment dominated the market, accounting for around 31.18% of global revenue. This growth is attributed to the technological advancement and growing availability of progressive mode of application of fumigation technology. Also, rising use as an alternative to methyl bromide in developing and developed nations is helping to stimulate the segment’s market growth. Phosphine fumigation can be done utilising phosphine gas, powder, pellets, and tablets, which can be spread, sprinkled, or placed to control insect infestation. Further, by 2030, the methyl bromide segment will likely dominate the market due to the vast application spectrum across stored product pest management and a pre-plant soil fumigant. Additionally, the methyl bromide has quick action, and the grains can be aerated after 12-24 hours of its application. However, methyl bromide is an odourless, colorless gas used to handle a wide variety of pests in agriculture & shipping, including weeds, fungi, insects, nematodes, and rodents.
The crop type segment is divided into oilseeds & pulses, cereals & grains, fruits & vegetables, and others. In 2022, cereals & grains dominated the market, accounting for around 29.21% of global revenue. This growth is attributed to the increasing availability of improved storage technologies.
| Attribute | Description |
|---|---|
| Market Size | Revenue (USD Billion) |
| Market size value in 2022 | USD 1.61 Billion |
| Market size value in 2030 | USD 2.37 Billion |
| CAGR (2022 to 2030) | 4.96% |
| Historical data | 2019-2020 |
| Base Year | 2021 |
| Forecast | 2022-2030 |
| Segments | Key Segments are form, product type, crop type, and regions |
| Regional Segments | The key regions are North America, South America, Europe, Asia Pacific, and Middle East & Africa. |
Asia Pacific region emerged as the largest market for grain fumigants.
The market's growth will be influenced by the high demand for enhanced-quality crops.
The stringent government regulations could hamper the market growth.
The rapid technological advancements in the agricultural sector will provide enormous opportunities for the market.
Key players Corteva Agriscience, UPL Limited, Douglas Products, Solvay, Noble Crop Science, Detia Degesch GmbH, Rollins, Inc. ECOTEC Fumigation, BASF SE, Royal Group, and among others.
1. Introduction
1.1. Objectives of the Study
1.2. Market Definition
1.3. Research Scope
1.4. Currency
1.5. Key Target Audience
2. Research Methodology and Assumptions
3. Executive Summary
4. Premium Insights
4.1. Porter’s Five Forces Analysis
4.2. Value Chain Analysis
4.3. Top Investment Pockets
4.3.1. Market Attractiveness Analysis By Form
4.3.2. Market Attractiveness Analysis By Product Type
4.3.3. Market Attractiveness Analysis By Crop Type
4.3.4. Market Attractiveness Analysis By Region
4.4. Industry Trends
5. Market Dynamics
5.1. Market Evaluation
5.2. Drivers
5.2.1. The growing agriculture industry
5.2.2. The high consumption of pesticides
5.2.3. The increase in awareness about the need for pest control
5.3. Restraints
5.3.1. The increasing side-effects on crops
5.4. Opportunities
5.4.1. The rapid technological advancements in the agricultural sector
6. Global Grain Fumigants Market Analysis and Forecast, By Form
6.1. Segment Overview
6.2. Gas
6.3. Solid
6.4. Liquid
7. Global Grain Fumigants Market Analysis and Forecast, By Product Type
7.1. Segment Overview
7.2. Sulfuryl Fluoride
7.3. Phosphine
7.4. Methyl Bromide
7.5. Others
8. Global Grain Fumigants Market Analysis and Forecast, By Crop Type
8.1. Segment Overview
8.2. Oilseeds & Pulses
8.3. Cereals & Grains
8.4. Fruits & Vegetables
8.5. Others
9. Global Grain Fumigants Market Analysis and Forecast, By Regional Analysis
9.1. Segment Overview
9.2. North America
9.2.1. U.S.
9.2.2. Canada
9.2.3. Mexico
9.3. Europe
9.3.1. Germany
9.3.2. France
9.3.3. U.K.
9.3.4. Italy
9.3.5. Spain
9.4. Asia-Pacific
9.4.1. Japan
9.4.2. China
9.4.3. India
9.5. South America
9.5.1. Brazil
9.6. Middle East and Africa
9.6.1. UAE
9.6.2. South Africa
10. Global Grain Fumigants Market-Competitive Landscape
10.1. Overview
10.2. Market Share of Key Players in Global Grain Fumigants Market
10.2.1. Global Company Market Share
10.2.2. North America Company Market Share
10.2.3. Europe Company Market Share
10.2.4. APAC Company Market Share
10.3. Competitive Situations and Trends
10.3.1. Product Launches and Developments
10.3.2. Partnerships, Collaborations, and Agreements
10.3.3. Mergers & Acquisitions
10.3.4. Expansions
11. Company Profiles
11.1. Corteva Agriscience
11.1.1. Business Overview
11.1.2. Company Snapshot
11.1.3. Company Market Share Analysis
11.1.4. Company Product Portfolio
11.1.5. Recent Developments
11.1.6. SWOT Analysis
11.2. UPL Limited
11.2.1. Business Overview
11.2.2. Company Snapshot
11.2.3. Company Market Share Analysis
11.2.4. Company Product Portfolio
11.2.5. Recent Developments
11.2.6. SWOT Analysis
11.3. Douglas Products
11.3.1. Business Overview
11.3.2. Company Snapshot
11.3.3. Company Market Share Analysis
11.3.4. Company Product Portfolio
11.3.5. Recent Developments
11.3.6. SWOT Analysis
11.4. Solvay
11.4.1. Business Overview
11.4.2. Company Snapshot
11.4.3. Company Market Share Analysis
11.4.4. Company Product Portfolio
11.4.5. Recent Developments
11.4.6. SWOT Analysis
11.5. Noble Crop Science
11.5.1. Business Overview
11.5.2. Company Snapshot
11.5.3. Company Market Share Analysis
11.5.4. Company Product Portfolio
11.5.5. Recent Developments
11.5.6. SWOT Analysis
11.6. Detia Degesch GmbH
11.6.1. Business Overview
11.6.2. Company Snapshot
11.6.3. Company Market Share Analysis
11.6.4. Company Product Portfolio
11.6.5. Recent Developments
11.6.6. SWOT Analysis
11.7. Rollins, Inc.
11.7.1. Business Overview
11.7.2. Company Snapshot
11.7.3. Company Market Share Analysis
11.7.4. Company Product Portfolio
11.7.5. Recent Developments
11.7.6. SWOT Analysis
11.8. ECOTEC Fumigation
11.8.1. Business Overview
11.8.2. Company Snapshot
11.8.3. Company Market Share Analysis
11.8.4. Company Product Portfolio
11.8.5. Recent Developments
11.8.6. SWOT Analysis
11.9. BASF SE
11.9.1. Business Overview
11.9.2. Company Snapshot
11.9.3. Company Market Share Analysis
11.9.4. Company Product Portfolio
11.9.5. Recent Developments
11.9.6. SWOT Analysis
11.10. Royal Group
11.10.1. Business Overview
11.10.2. Company Snapshot
11.10.3. Company Market Share Analysis
11.10.4. Company Product Portfolio
11.10.5. Recent Developments
11.10.6. SWOT Analysis
List of Table
1. Global Grain Fumigants Market, By Form, 2019-2030 (USD Billion)
2. Global Gas, Grain Fumigants Market, By Region, 2019-2030 (USD Billion)
3. Global Solid, Grain Fumigants Market, By Region, 2019-2030 (USD Billion)
4. Global Liquid, Grain Fumigants Market, By Region, 2019-2030 (USD Billion)
5. Global Grain Fumigants Market, By Product Type, 2019-2030 (USD Billion)
6. Global Sulfuryl Fluoride, Grain Fumigants Market, By Region, 2019-2030 (USD Billion)
7. Global Phosphine, Grain Fumigants Market, By Region, 2019-2030 (USD Billion)
8. Global Methyl Bromide, Grain Fumigants Market, By Region, 2019-2030 (USD Billion)
9. Global Others, Grain Fumigants Market, By Region, 2019-2030 (USD Billion)
10. Global Grain Fumigants Market, By Crop Type, 2019-2030 (USD Billion)
11. Global Oilseeds & Pulses, Grain Fumigants Market, By Region, 2019-2030 (USD Billion)
12. Global Cereals & Grains, Grain Fumigants Market, By Region, 2019-2030 (USD Billion)
13. Global Fruits & Vegetables, Grain Fumigants Market, By Region, 2019-2030 (USD Billion)
14. Global Others, Grain Fumigants Market, By Region, 2019-2030 (USD Billion)
15. North America Grain Fumigants Market, By Form, 2019-2030 (USD Billion)
16. North America Grain Fumigants Market, By Product Type, 2019-2030 (USD Billion)
17. North America Grain Fumigants Market, By Crop Type, 2019-2030 (USD Billion)
18. U.S. Grain Fumigants Market, By Form, 2019-2030 (USD Billion)
19. U.S. Grain Fumigants Market, By Product Type, 2019-2030 (USD Billion)
20. U.S. Grain Fumigants Market, By Crop Type, 2019-2030 (USD Billion)
21. Canada Grain Fumigants Market, By Form, 2019-2030 (USD Billion)
22. Canada Grain Fumigants Market, By Product Type, 2019-2030 (USD Billion)
23. Canada Grain Fumigants Market, By Crop Type, 2019-2030 (USD Billion)
24. Mexico Grain Fumigants Market, By Form, 2019-2030 (USD Billion)
25. Mexico Grain Fumigants Market, By Product Type, 2019-2030 (USD Billion)
26. Mexico Grain Fumigants Market, By Crop Type, 2019-2030 (USD Billion)
27. Europe Grain Fumigants Market, By Form, 2019-2030 (USD Billion)
28. Europe Grain Fumigants Market, By Product Type, 2019-2030 (USD Billion)
29. Europe Grain Fumigants Market, By Crop Type, 2019-2030 (USD Billion)
30. Germany Grain Fumigants Market, By Form, 2019-2030 (USD Billion)
31. Germany Grain Fumigants Market, By Product Type, 2019-2030 (USD Billion)
32. Germany Grain Fumigants Market, By Crop Type, 2019-2030 (USD Billion)
33. France Grain Fumigants Market, By Form, 2019-2030 (USD Billion)
34. France Grain Fumigants Market, By Product Type, 2019-2030 (USD Billion)
35. France Grain Fumigants Market, By Crop Type, 2019-2030 (USD Billion)
36. U.K. Grain Fumigants Market, By Form, 2019-2030 (USD Billion)
37. U.K. Grain Fumigants Market, By Product Type, 2019-2030 (USD Billion)
38. U.K. Grain Fumigants Market, By Crop Type, 2019-2030 (USD Billion)
39. Italy Grain Fumigants Market, By Form, 2019-2030 (USD Billion)
40. Italy Grain Fumigants Market, By Product Type, 2019-2030 (USD Billion)
41. Italy Grain Fumigants Market, By Crop Type, 2019-2030 (USD Billion)
42. Spain Grain Fumigants Market, By Form, 2019-2030 (USD Billion)
43. Spain Grain Fumigants Market, By Product Type, 2019-2030 (USD Billion)
44. Spain Grain Fumigants Market, By Crop Type, 2019-2030 (USD Billion)
45. Asia Pacific Grain Fumigants Market, By Form, 2019-2030 (USD Billion)
46. Asia Pacific Grain Fumigants Market, By Product Type, 2019-2030 (USD Billion)
47. Asia Pacific Grain Fumigants Market, By Crop Type, 2019-2030 (USD Billion)
48. Japan Grain Fumigants Market, By Form, 2019-2030 (USD Billion)
49. Japan Grain Fumigants Market, By Product Type, 2019-2030 (USD Billion)
50. Japan Grain Fumigants Market, By Crop Type, 2019-2030 (USD Billion)
51. China Grain Fumigants Market, By Form, 2019-2030 (USD Billion)
52. China Grain Fumigants Market, By Product Type, 2019-2030 (USD Billion)
53. China Grain Fumigants Market, By Crop Type, 2019-2030 (USD Billion)
54. India Grain Fumigants Market, By Form, 2019-2030 (USD Billion)
55. India Grain Fumigants Market, By Product Type, 2019-2030 (USD Billion)
56. India Grain Fumigants Market, By Crop Type, 2019-2030 (USD Billion)
57. South America Grain Fumigants Market, By Form, 2019-2030 (USD Billion)
58. South America Grain Fumigants Market, By Product Type, 2019-2030 (USD Billion)
59. South America Grain Fumigants Market, By Crop Type, 2019-2030 (USD Billion)
60. Brazil Grain Fumigants Market, By Form, 2019-2030 (USD Billion)
61. Brazil Grain Fumigants Market, By Product Type, 2019-2030 (USD Billion)
62. Brazil Grain Fumigants Market, By Crop Type, 2019-2030 (USD Billion)
63. Middle East and Africa Grain Fumigants Market, By Form, 2019-2030 (USD Billion)
64. Middle East and Africa Grain Fumigants Market, By Product Type, 2019-2030 (USD Billion)
65. Middle East and Africa Grain Fumigants Market, By Crop Type, 2019-2030 (USD Billion)
66. UAE Grain Fumigants Market, By Form, 2019-2030 (USD Billion)
67. UAE Grain Fumigants Market, By Product Type, 2019-2030 (USD Billion)
68. UAE Grain Fumigants Market, By Crop Type, 2019-2030 (USD Billion)
69. South Africa Grain Fumigants Market, By Form, 2019-2030 (USD Billion)
70. South Africa Grain Fumigants Market, By Product Type, 2019-2030 (USD Billion)
71. South Africa Grain Fumigants Market, By Crop Type, 2019-2030 (USD Billion)
List of Figures
1. Global Grain Fumigants Market Segmentation
2. Global Grain Fumigants Market: Research Methodology
3. Market Size Estimation Methodology: Bottom-Up Approach
4. Market Size Estimation Methodology: Top- Approach
5. Data Triangulation
6. Porter’s Five Forces Analysis
7. Value Chain Analysis
8. Global Grain Fumigants Market Attractiveness Analysis By Form
9. Global Grain Fumigants Market Attractiveness Analysis By Product Type
10. Global Grain Fumigants Market Attractiveness Analysis By Crop Type
11. Global Grain Fumigants Market Attractiveness Analysis By Region
12. Global Grain Fumigants Market: Dynamics
13. Global Grain Fumigants Market Share By Form (2022 & 2030)
14. Global Grain Fumigants Market Share By Product Type (2022 & 2030)
15. Global Grain Fumigants Market Share By Crop Type (2022 & 2030)
16. Global Grain Fumigants Market Share By Regions (2022 & 2030)
17. Global Grain Fumigants Market Share By Company (2021)
This study forecasts revenue at global, regional, and country levels from 2019 to 2030. The Brainy Insights has segmented the global grain fumigants based on below mentioned segments:
Global Grain Fumigants Market by Form:
Global Grain Fumigants Market by Product Type:
Global Grain Fumigants Market by Crop Type:
Global Grain Fumigants by Region:
Research has its special purpose to undertake marketing efficiently. In this competitive scenario, businesses need information across all industry verticals; the information about customer wants, market demand, competition, industry trends, distribution channels etc. This information needs to be updated regularly because businesses operate in a dynamic environment. Our organization, The Brainy Insights incorporates scientific and systematic research procedures in order to get proper market insights and industry analysis for overall business success. The analysis consists of studying the market from a miniscule level wherein we implement statistical tools which helps us in examining the data with accuracy and precision.
Our research reports feature both; quantitative and qualitative aspects for any market. Qualitative information for any market research process are fundamental because they reveal the customer needs and wants, usage and consumption for any product/service related to a specific industry. This in turn aids the marketers/investors in knowing certain perceptions of the customers. Qualitative research can enlighten about the different product concepts and designs along with unique service offering that in turn, helps define marketing problems and generate opportunities. On the other hand, quantitative research engages with the data collection process through interviews, e-mail interactions, surveys and pilot studies. Quantitative aspects for the market research are useful to validate the hypotheses generated during qualitative research method, explore empirical patterns in the data with the help of statistical tools, and finally make the market estimations.
The Brainy Insights offers comprehensive research and analysis, based on a wide assortment of factual insights gained through interviews with CXOs and global experts and secondary data from reliable sources. Our analysts and industry specialist assume vital roles in building up statistical tools and analysis models, which are used to analyse the data and arrive at accurate insights with exceedingly informative research discoveries. The data provided by our organization have proven precious to a diverse range of companies, facilitating them to address issues such as determining which products/services are the most appealing, whether or not customers use the product in the manner anticipated, the purchasing intentions of the market and many others.
Our research methodology encompasses an idyllic combination of primary and secondary initiatives. Key phases involved in this process are listed below:

The phase involves the gathering and collecting of market data and its related information with the help of different sources & research procedures.

The data procurement stage involves in data gathering and collecting through various data sources.
This stage involves in extensive research. These data sources includes:
Purchased Database: Purchased databases play a crucial role in estimating the market sizes irrespective of the domain. Our purchased database includes:
Primary Research: The Brainy Insights interacts with leading companies and experts of the concerned domain to develop the analyst team’s market understanding and expertise. It improves and substantiates every single data presented in the market reports. Primary research mainly involves in telephonic interviews, E-mail interactions and face-to-face interviews with the raw material providers, manufacturers/producers, distributors, & independent consultants. The interviews that we conduct provides valuable data on market size and industry growth trends prevailing in the market. Our organization also conducts surveys with the various industry experts in order to gain overall insights of the industry/market. For instance, in healthcare industry we conduct surveys with the pharmacists, doctors, surgeons and nurses in order to gain insights and key information of a medical product/device/equipment which the customers are going to usage. Surveys are conducted in the form of questionnaire designed by our own analyst team. Surveys plays an important role in primary research because surveys helps us to identify the key target audiences of the market. Additionally, surveys helps to identify the key target audience engaged with the market. Our survey team conducts the survey by targeting the key audience, thus gaining insights from them. Based on the perspectives of the customers, this information is utilized to formulate market strategies. Moreover, market surveys helps us to understand the current competitive situation of the industry. To be precise, our survey process typically involve with the 360 analysis of the market. This analytical process begins by identifying the prospective customers for a product or service related to the market/industry to obtain data on how a product/service could fit into customers’ lives.

Secondary Research: The secondary data sources includes information published by the on-profit organizations such as World bank, WHO, company fillings, investor presentations, annual reports, national government documents, statistical databases, blogs, articles, white papers and others. From the annual report, we analyse a company’s revenue to understand the key segment and market share of that organization in a particular region. We analyse the company websites and adopt the product mapping technique which is important for deriving the segment revenue. In the product mapping method, we select and categorize the products offered by the companies catering to domain specific market, deduce the product revenue for each of the companies so as to get overall estimation of the market size. We also source data and analyses trends based on information received from supply side and demand side intermediaries in the value chain. The supply side denotes the data gathered from supplier, distributor, wholesaler and the demand side illustrates the data gathered from the end customers for respective market domain.

The supply side for a domain specific market is analysed by:
The demand side for the market is estimated through:
In-house Library: Apart from these third-party sources, we have our in-house library of qualitative and quantitative information. Our in-house database includes market data for various industry and domains. These data are updated on regular basis as per the changing market scenario. Our library includes, historic databases, internal audit reports and archives.
Sometimes there are instances where there is no metadata or raw data available for any domain specific market. For those cases, we use our expertise to forecast and estimate the market size in order to generate comprehensive data sets. Our analyst team adopt a robust research technique in order to produce the estimates:
Data Synthesis: This stage involves the analysis & mapping of all the information obtained from the previous step. It also involves in scrutinizing the data for any discrepancy observed while data gathering related to the market. The data is collected with consideration to the heterogeneity of sources. Robust scientific techniques are in place for synthesizing disparate data sets and provide the essential contextual information that can orient market strategies. The Brainy Insights has extensive experience in data synthesis where the data passes through various stages:


Market Deduction & Formulation: The final stage comprises of assigning data points at appropriate market spaces so as to deduce feasible conclusions. Analyst perspective & subject matter expert based holistic form of market sizing coupled with industry analysis also plays a crucial role in this stage.
This stage involves in finalization of the market size and numbers that we have collected from data integration step. With data interpolation, it is made sure that there is no gap in the market data. Successful trend analysis is done by our analysts using extrapolation techniques, which provide the best possible forecasts for the market.
Data Validation & Market Feedback: Validation is the most important step in the process. Validation & re-validation via an intricately designed process helps us finalize data-points to be used for final calculations.

The Brainy Insights interacts with leading companies and experts of the concerned domain to develop the analyst team’s market understanding and expertise. It improves and substantiates every single data presented in the market reports. The data validation interview and discussion panels are typically composed of the most experienced industry members. The participants include, however, are not limited to:
Moreover, we always validate our data and findings through primary respondents from all the major regions we are working on.


Free Customization
Fortune 500 Clients
Free Yearly Update On Purchase Of Multi/Corporate License
Companies Served Till Date