- +1-315-215-1633
- sales@thebrainyinsights.com

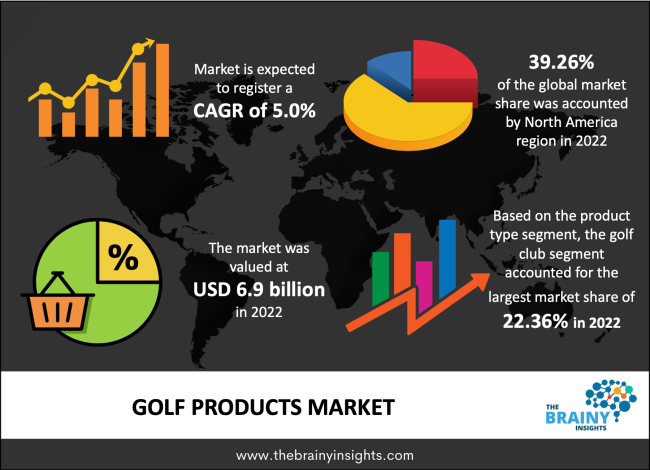
The global golf products market was valued at USD 6.9 billion in 2022 and is anticipated to grow at a CAGR of 5.0% from 2022 to 2030. The global golf products market is expected to reach USD 10.1 billion by 2030. Asia Pacific is expected to grow the fastest during the forecast period.
Get an overview of this study by requesting a free sample
Golf is a cross-country sport in which a player uses various clubs to hit a little ball into various holes on a course from various teeing grounds. The golfer who makes the fewest amount of putts is declared the winner. The goal is to use the fewest club swings or strokes possible to get the ball into the hole. People of all ages like playing golf, which is a very well-liked sport. Golf can be played for relaxation and to take in the outdoors, but it is commonly played in a competitive setting. Golf is an all-day sport that takes hours to complete in a single series. It is played slowly, allowing participants to appreciate the beautiful surroundings, the sunshine, and one another's companionship. Golf and leisure are easily merged into country clubs and golf courses. Many golf courses feature family-friendly amenities like restaurants, pools, and spas in addition to their lush surroundings. The golf tourism industry is expected to increase significantly over the next years, which will likely positively impact the worldwide gold equipment market. Additionally, there has been a global infrastructure spending surge to host and manage international golf competitions and tournaments. Additionally, participation in professional golf competitions has been increasing, especially among Millennials, which has boosted purchases of golf products during the forecast period. Sizable investments heavily influence the market in advertising and sales activities to reach a wide customer base. One of the main marketing tactics used by vendors to grow their market share and draw in customers is projected to be the considerable promotion of golf tournaments, competitions, and sponsorships on social media.
Increase in Number of Gold Courses – The number of golf courses has grown recently, especially in the top golfing nations, including the US, Germany, Canada, South Korea, Sweden, France, Japan, the UK, and Italy. These nations are among the most well-known golfing destinations in the world, and they are home to more than 50% of the world's golf courses. There are more than 30,000 golf courses around the globe, and more than 70% are public. More than 200 golf courses were expected to be under construction, and about 350 more would be in various construction stages by 2019. The global golf product market is expected to grow throughout the forecast period due to the rising number of golf courses and other golf-related facilities.
Inclination Towards Outdoor Sports – Despite the sport's gradual popularity worldwide over the years, golf's standing as a prominent sport or fitness activity has not yet been properly established. The most widely watched sports in the world continue to be basketball and American football in the United States, cricket and football in Asian countries like India, Pakistan, and Sri Lanka, football in European countries like Spain, Italy, France, and the United Kingdom, as well as South American countries like Brazil, Argentina, Colombia, and Uruguay. During the forecast period, it is projected that this factor will restrain the growth of the global golf product market.
Growing Participation of Women – Women now participate in a greater variety of activities than ever before, especially outdoor sports like golf. In addition, women make up one-third of the golfers who have enrolled in European countries, including Germany, Austria, Liechtenstein, and Switzerland. The second-through-fourth lowest percentages of female golfers are found in Wales, England, and Scotland, where they range from 12% to 13%. Only Albania in Europe, where only 3% of golfers are female, has a lower percentage of female golfers than the UK. To increase the number of female golfers, numerous governing golf bodies have been offering a variety of assistance. According to the National Golf Foundation, women make up about 19% of golfers today.
Growing Preferences for Outdoor Activities – It is anticipated that shifting customer preferences toward other outdoor sports will impede industry expansion. For instance, due to their capacity to enhance fitness and health, high-intensity sports like cricket, volleyball, football, and basketball have grown in popularity.
The regions analyzed for the market include North America, Europe, South America, Asia Pacific, the Middle East, and Africa. North America emerged as the largest market for the global golf products market, with a 39.26% share of the market revenue in 2022. The United States is a big participant and has a considerable impact on the region's expansion. The number of senior golfers has increased across the nation. The golf products market has also grown as a result of an increase in golf tourism. Additionally, 108 billion Americans participated in golf nationwide in 2019. The number of women who played golf on a course in 2019 was 5.7 billion, accounting for 23% of all on-course golfers and 44% of all off-course golfers. The sector has recently been propelled by a number of important factors, including the expanding popularity of golf and the development of golf tourism, which the expansion of golf courses across the nation has aided. In the United States, older adults currently dominate the sport.
Asia-Pacific is expected to be the fastest-growing region. The regional market is driven by Japan's participation. Japan is the second-largest golf market in the world after the United States. In addition, there are many golf courses since there are more young golfers and more people who are aware of the sport. The public's interest in golf has grown as a result of increased media coverage of international golf competitions. The rising interest in the sport among young people has increased sales of golf equipment in the nation.
North America Region Golf Products Market Share in 2022 - 39.26%
www.thebrainyinsights.com
Check the geographical analysis of this market by requesting a free sample
The product type segment is divided into golf clubs, golf balls, golf bags and accessories, apparel, and footwear. The golf club segment dominated, with a market share of around 22.36% in 2022. Consumers are starting to favor customized and diverse golf clubs, which is expected to increase demand for golf clubs over the forecast period. Consumer demand is increasing as a result of manufacturer innovation in clubs, such as hybrid clubs comprised of higher-lofted wood and iron that are becoming more and more popular. The extended longevity of iron clubs might have a significant impact on the product repurchase cycle, which is limiting the segment's growth.
The distribution channel segment is divided into offline retail stores and online retail stores. Over the forecast period, the offline retail stores segment is expected to grow at the fastest CAGR of 5.3%. Supermarkets and hypermarkets are among the most frequently visited retail facilities, mostly in big cities and metropolitan areas, due to their accessibility and proximity to residential areas. Due to these factors, suppliers of golf products showcase their product lines through these channels to connect with a larger audience of buyers. Speciality shops that sell golf products have focused on improving clients' tailored shopping experiences globally.
| Attribute | Description |
|---|---|
| Market Size | Revenue (USD Billion) |
| Market size value in 2022 | USD 6.9 billion |
| Market size value in 2030 | USD 10.1 billion |
| CAGR (2022 to 2030) | 5% |
| Historical data | 2019-2020 |
| Base Year | 2021 |
| Forecast | 2022-2030 |
| Segments | Product Type, Distribution Channel |
| Regional Segments | North America, Asia Pacific, Europe, Latin America, Middle East and Africa |
As per The Brainy Insights, the size of the golf products market was valued at USD 6.9 billion in 2022 to USD 10.1 billion by 2030.
The global golf products market is growing at a CAGR of 5% during the forecast period 2022-2030.
North America emerged as the largest market for golf products.
Key players in the golf products market are Callaway, SRI Sports Limited, Acushnet Holding Corp., Taylormade, Titleist, Clevaland, Mizuno, Wilson, Odyssey, Ping
1. Introduction
1.1. Objectives of the Study
1.2. Market Definition
1.3. Research Scope
1.4. Currency
1.5. Key Target Audience
2. Research Methodology and Assumptions
3. Executive Summary
4. Premium Insights
4.1. Porter’s Five Forces Analysis
4.2. Value Chain Analysis
4.3. Top Investment Pockets
4.3.1. Market Attractiveness Analysis By Product Type
4.3.2. Market Attractiveness Analysis By Distribution Channel
4.3.3. Market Attractiveness Analysis By Region
4.4. Industry Trends
5. Market Dynamics
5.1. Market Evaluation
5.2. Drivers
5.2.1. Increased Number of Golf Courses
5.3. Restraints
5.3.1. Inclination Towards Outdoor Sports
5.4. Opportunities
5.4.1. Growing Participation of Women
5.5. Challenges
5.5.1. Growing Preferences for Outdoor Activities
6. Global Golf Products Market Analysis and Forecast, By Product Type
6.1. Segment Overview
6.2. Golf Clubs
6.3. Golf Balls
6.4. Golf Bags and Accessories
6.5. Apparel
6.6. Footwear
7. Global Golf Products Market Analysis and Forecast, By Distribution Channel
7.1. Segment Overview
7.2. Offline Retail Stores
7.3. Online Retail Stores
8. Global Golf Products Market Analysis and Forecast, By Regional Analysis
8.1. Segment Overview
8.2. North America
8.2.1. U.S.
8.2.2. Canada
8.2.3. Mexico
8.3. Europe
8.3.1. Germany
8.3.2. France
8.3.3. U.K.
8.3.4. Italy
8.3.5. Spain
8.4. Asia-Pacific
8.4.1. Japan
8.4.2. China
8.4.3. India
8.5. South America
8.5.1. Brazil
8.6. Middle East and Africa
8.6.1. UAE
8.6.2. South Africa
9. Global Golf Products Market-Competitive Landscape
9.1. Overview
9.2. Market Share of Key Players in Global Golf Products Market
9.2.1. Global Company Market Share
9.2.2. North America Company Market Share
9.2.3. Europe Company Market Share
9.2.4. APAC Company Market Share
9.3. Competitive Situations and Trends
9.3.1. Product Launches and Developments
9.3.2. Partnerships, Collaborations, and Agreements
9.3.3. Mergers & Acquisitions
9.3.4. Expansions
10. Company Profiles
10.1. Callaway
10.1.1. Business Overview
10.1.2. Company Snapshot
10.1.3. Company Market Share Analysis
10.1.4. Company Product Portfolio
10.1.5. Recent Developments
10.1.6. SWOT Analysis
10.2. SRI Sports Limited
10.2.1. Business Overview
10.2.2. Company Snapshot
10.2.3. Company Market Share Analysis
10.2.4. Company Product Portfolio
10.2.5. Recent Developments
10.2.6. SWOT Analysis
10.3. Acushnet Holding Corp.E
10.3.1. Business Overview
10.3.2. Company Snapshot
10.3.3. Company Market Share Analysis
10.3.4. Company Product Portfolio
10.3.5. Recent Developments
10.3.6. SWOT Analysis
10.4. Taylormade
10.4.1. Business Overview
10.4.2. Company Snapshot
10.4.3. Company Market Share Analysis
10.4.4. Company Product Portfolio
10.4.5. Recent Developments
10.4.6. SWOT Analysis
10.5. Titleist
10.5.1. Business Overview
10.5.2. Company Snapshot
10.5.3. Company Market Share Analysis
10.5.4. Company Product Portfolio
10.5.5. Recent Developments
10.5.6. SWOT Analysis
10.6. Clevaland
10.6.1. Business Overview
10.6.2. Company Snapshot
10.6.3. Company Market Share Analysis
10.6.4. Company Product Portfolio
10.6.5. Recent Developments
10.6.6. SWOT Analysis
10.7. Mizuno
10.7.1. Business Overview
10.7.2. Company Snapshot
10.7.3. Company Market Share Analysis
10.7.4. Company Product Portfolio
10.7.5. Recent Developments
10.7.6. SWOT Analysis
10.8. Wilson
10.8.1. Business Overview
10.8.2. Company Snapshot
10.8.3. Company Market Share Analysis
10.8.4. Company Product Portfolio
10.8.5. Recent Developments
10.8.6. SWOT Analysis
10.9. Odyssey
10.9.1. Business Overview
10.9.2. Company Snapshot
10.9.3. Company Market Share Analysis
10.9.4. Company Product Portfolio
10.9.5. Recent Developments
10.9.6. SWOT Analysis
10.10. Ping
10.10.1. Business Overview
10.10.2. Company Snapshot
10.10.3. Company Market Share Analysis
10.10.4. Company Product Portfolio
10.10.5. Recent Developments
10.10.6. SWOT Analysis
List of Table
1. Global Golf Products Market, By Product Type, 2019-2030 (USD Billion)
2. Global Golf Clubs, Golf Products Market, By Region, 2019-2030 (USD Billion)
3. Global Golf Balls, Golf Products Market, By Region, 2019-2030 (USD Billion)
4. Global Golf Bags and Accessories, Golf Products Market, By Region, 2019-2030 (USD Billion)
5. Global Apparel, Golf Products Market, By Region, 2019-2030 (USD Billion)
6. Global Footwear, Golf Products Market, By Region, 2019-2030 (USD Billion)
7. Global Golf Products Market, By Distribution Channel, 2019-2030 (USD Billion)
8. Global Offline Retail Stores, Golf Products Market, By Region, 2019-2030 (USD Billion)
9. Global Online Retail Stores, Golf Products Market, By Region, 2019-2030 (USD Billion)
10. North America Golf Products Market, By Product Type, 2019-2030 (USD Billion)
11. North America Golf Products Market, By Distribution Channel, 2019-2030 (USD Billion)
12. U.S. Golf Products Market, By Product Type, 2019-2030 (USD Billion)
13. U.S. Golf Products Market, By Distribution Channel, 2019-2030 (USD Billion)
14. Canada Golf Products Market, By Product Type, 2019-2030 (USD Billion)
15. Canada Golf Products Market, By Distribution Channel, 2019-2030 (USD Billion)
16. Mexico Golf Products Market, By Product Type, 2019-2030 (USD Billion)
17. Mexico Golf Products Market, By Distribution Channel, 2019-2030 (USD Billion)
18. Europe Golf Products Market, By Product Type, 2019-2030 (USD Billion)
19. Europe Golf Products Market, By Distribution Channel, 2019-2030 (USD Billion)
20. Germany Golf Products Market, By Product Type, 2019-2030 (USD Billion)
21. Germany Golf Products Market, By Distribution Channel, 2019-2030 (USD Billion)
22. France Golf Products Market, By Product Type, 2019-2030 (USD Billion)
23. France Golf Products Market, By Distribution Channel, 2019-2030 (USD Billion)
24. U.K. Golf Products Market, By Product Type, 2019-2030 (USD Billion)
25. U.K. Golf Products Market, By Distribution Channel, 2019-2030 (USD Billion)
26. Italy Golf Products Market, By Product Type, 2019-2030 (USD Billion)
27. Italy Golf Products Market, By Distribution Channel, 2019-2030 (USD Billion)
28. Spain Golf Products Market, By Product Type, 2019-2030 (USD Billion)
29. Spain Golf Products Market, By Distribution Channel, 2019-2030 (USD Billion)
30. Asia Pacific Golf Products Market, By Product Type, 2019-2030 (USD Billion)
31. Asia Pacific Golf Products Market, By Distribution Channel, 2019-2030 (USD Billion)
32. Japan Golf Products Market, By Product Type, 2019-2030 (USD Billion)
33. Japan Golf Products Market, By Distribution Channel, 2019-2030 (USD Billion)
34. China Golf Products Market, By Product Type, 2019-2030 (USD Billion)
35. China Golf Products Market, By Distribution Channel, 2019-2030 (USD Billion)
36. India Golf Products Market, By Product Type, 2019-2030 (USD Billion)
37. India Golf Products Market, By Distribution Channel, 2019-2030 (USD Billion)
38. South America Golf Products Market, By Product Type, 2019-2030 (USD Billion)
39. South America Golf Products Market, By Distribution Channel, 2019-2030 (USD Billion)
40. Brazil Golf Products Market, By Product Type, 2019-2030 (USD Billion)
41. Brazil Golf Products Market, By Distribution Channel, 2019-2030 (USD Billion)
42. Middle East and Africa Golf Products Market, By Product Type, 2019-2030 (USD Billion)
43. Middle East and Africa Golf Products Market, By Distribution Channel, 2019-2030 (USD Billion)
44. UAE Golf Products Market, By Product Type, 2019-2030 (USD Billion)
45. UAE Golf Products Market, By Distribution Channel, 2019-2030 (USD Billion)
46. South Africa Golf Products Market, By Product Type, 2019-2030 (USD Billion)
47. South Africa Golf Products Market, By Distribution Channel, 2019-2030 (USD Billion)
List of Figures
1. Global Golf Products Market Segmentation
2. Global Golf Products Market: Research Methodology
3. Market Size Estimation Methodology: Bottom-Up Approach
4. Market Size Estimation Methodology: Top-Down Approach
5. Data Triangulation
6. Porter’s Five Forces Analysis
7. Value Chain Analysis
8. Global Golf Products Market Attractiveness Analysis By Product Type
9. Global Golf Products Market Attractiveness Analysis By Distribution Channel
10. Global Golf Products Market Attractiveness Analysis By Region
11. Global Golf Products Market: Dynamics
12. Global Golf Products Market Share By Product Type (2022 & 2030)
13. Global Golf Products Market Share By Distribution Channel (2022 & 2030)
14. Global Golf Products Market Share By Regions (2022 & 2030)
15. Global Golf Products Market Share By Company (2021)
This study forecasts global, regional, and country revenue from 2019 to 2030. Brainy Insights has segmented the global golf products market based on the below-mentioned segments:
Global Golf Products Market by Product Type:
Global Golf Products Market by Distribution Channel:
Global Golf Products Market by Region:
Research has its special purpose to undertake marketing efficiently. In this competitive scenario, businesses need information across all industry verticals; the information about customer wants, market demand, competition, industry trends, distribution channels etc. This information needs to be updated regularly because businesses operate in a dynamic environment. Our organization, The Brainy Insights incorporates scientific and systematic research procedures in order to get proper market insights and industry analysis for overall business success. The analysis consists of studying the market from a miniscule level wherein we implement statistical tools which helps us in examining the data with accuracy and precision.
Our research reports feature both; quantitative and qualitative aspects for any market. Qualitative information for any market research process are fundamental because they reveal the customer needs and wants, usage and consumption for any product/service related to a specific industry. This in turn aids the marketers/investors in knowing certain perceptions of the customers. Qualitative research can enlighten about the different product concepts and designs along with unique service offering that in turn, helps define marketing problems and generate opportunities. On the other hand, quantitative research engages with the data collection process through interviews, e-mail interactions, surveys and pilot studies. Quantitative aspects for the market research are useful to validate the hypotheses generated during qualitative research method, explore empirical patterns in the data with the help of statistical tools, and finally make the market estimations.
The Brainy Insights offers comprehensive research and analysis, based on a wide assortment of factual insights gained through interviews with CXOs and global experts and secondary data from reliable sources. Our analysts and industry specialist assume vital roles in building up statistical tools and analysis models, which are used to analyse the data and arrive at accurate insights with exceedingly informative research discoveries. The data provided by our organization have proven precious to a diverse range of companies, facilitating them to address issues such as determining which products/services are the most appealing, whether or not customers use the product in the manner anticipated, the purchasing intentions of the market and many others.
Our research methodology encompasses an idyllic combination of primary and secondary initiatives. Key phases involved in this process are listed below:

The phase involves the gathering and collecting of market data and its related information with the help of different sources & research procedures.

The data procurement stage involves in data gathering and collecting through various data sources.
This stage involves in extensive research. These data sources includes:
Purchased Database: Purchased databases play a crucial role in estimating the market sizes irrespective of the domain. Our purchased database includes:
Primary Research: The Brainy Insights interacts with leading companies and experts of the concerned domain to develop the analyst team’s market understanding and expertise. It improves and substantiates every single data presented in the market reports. Primary research mainly involves in telephonic interviews, E-mail interactions and face-to-face interviews with the raw material providers, manufacturers/producers, distributors, & independent consultants. The interviews that we conduct provides valuable data on market size and industry growth trends prevailing in the market. Our organization also conducts surveys with the various industry experts in order to gain overall insights of the industry/market. For instance, in healthcare industry we conduct surveys with the pharmacists, doctors, surgeons and nurses in order to gain insights and key information of a medical product/device/equipment which the customers are going to usage. Surveys are conducted in the form of questionnaire designed by our own analyst team. Surveys plays an important role in primary research because surveys helps us to identify the key target audiences of the market. Additionally, surveys helps to identify the key target audience engaged with the market. Our survey team conducts the survey by targeting the key audience, thus gaining insights from them. Based on the perspectives of the customers, this information is utilized to formulate market strategies. Moreover, market surveys helps us to understand the current competitive situation of the industry. To be precise, our survey process typically involve with the 360 analysis of the market. This analytical process begins by identifying the prospective customers for a product or service related to the market/industry to obtain data on how a product/service could fit into customers’ lives.

Secondary Research: The secondary data sources includes information published by the on-profit organizations such as World bank, WHO, company fillings, investor presentations, annual reports, national government documents, statistical databases, blogs, articles, white papers and others. From the annual report, we analyse a company’s revenue to understand the key segment and market share of that organization in a particular region. We analyse the company websites and adopt the product mapping technique which is important for deriving the segment revenue. In the product mapping method, we select and categorize the products offered by the companies catering to domain specific market, deduce the product revenue for each of the companies so as to get overall estimation of the market size. We also source data and analyses trends based on information received from supply side and demand side intermediaries in the value chain. The supply side denotes the data gathered from supplier, distributor, wholesaler and the demand side illustrates the data gathered from the end customers for respective market domain.

The supply side for a domain specific market is analysed by:
The demand side for the market is estimated through:
In-house Library: Apart from these third-party sources, we have our in-house library of qualitative and quantitative information. Our in-house database includes market data for various industry and domains. These data are updated on regular basis as per the changing market scenario. Our library includes, historic databases, internal audit reports and archives.
Sometimes there are instances where there is no metadata or raw data available for any domain specific market. For those cases, we use our expertise to forecast and estimate the market size in order to generate comprehensive data sets. Our analyst team adopt a robust research technique in order to produce the estimates:
Data Synthesis: This stage involves the analysis & mapping of all the information obtained from the previous step. It also involves in scrutinizing the data for any discrepancy observed while data gathering related to the market. The data is collected with consideration to the heterogeneity of sources. Robust scientific techniques are in place for synthesizing disparate data sets and provide the essential contextual information that can orient market strategies. The Brainy Insights has extensive experience in data synthesis where the data passes through various stages:


Market Deduction & Formulation: The final stage comprises of assigning data points at appropriate market spaces so as to deduce feasible conclusions. Analyst perspective & subject matter expert based holistic form of market sizing coupled with industry analysis also plays a crucial role in this stage.
This stage involves in finalization of the market size and numbers that we have collected from data integration step. With data interpolation, it is made sure that there is no gap in the market data. Successful trend analysis is done by our analysts using extrapolation techniques, which provide the best possible forecasts for the market.
Data Validation & Market Feedback: Validation is the most important step in the process. Validation & re-validation via an intricately designed process helps us finalize data-points to be used for final calculations.

The Brainy Insights interacts with leading companies and experts of the concerned domain to develop the analyst team’s market understanding and expertise. It improves and substantiates every single data presented in the market reports. The data validation interview and discussion panels are typically composed of the most experienced industry members. The participants include, however, are not limited to:
Moreover, we always validate our data and findings through primary respondents from all the major regions we are working on.


Free Customization
Fortune 500 Clients
Free Yearly Update On Purchase Of Multi/Corporate License
Companies Served Till Date