- +1-315-215-1633
- sales@thebrainyinsights.com

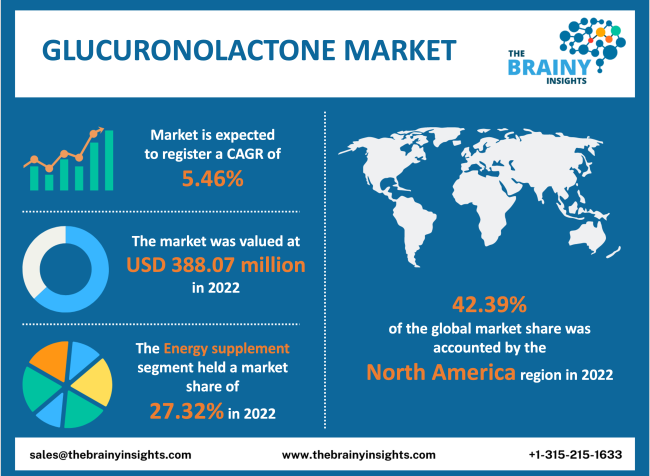
The global glucuronolactone market was valued at USD 388.07 million in 2022, increasing at a CAGR of 5.46% from 2022 to 2030 and anticipated to reach USD 593.76 million by 2030. Asia Pacific is expected to grow the fastest during the forecast period. Further, the increasing innovation by key companies and the ageing population's increasing spending on healthy diets are expected to propel the market growth during the forecast period.
Glucuronolactone (D-glucuronic-gamma-lactone) is an innately occurring solid white compound that has applications for exercise and bodybuilding. Glucuronolactone refers to a chemical that mainly finds usage in the manufacturing of energy drinks. Glucuronolactone is utilized as it can help enhance attention and improve athletic performance. Glucuronolactone is a naturally occurring substance and a critical component in nearly all connective tissues. In vitro, D-glucuronolactone can be metabolized by a dehydrogenase into D-Glucaro-1,4-Lactone (G14L), where D-glucuronolactone appears to metabolize into a dilactone (d-glucaric-1,4-3,6-dilactone) & then spontaneously degrade into G14L. Glucuronolactone is present in many commercial products as a mixture of active components. These cocktails have been investigated relatively well in mental and physical performance. Glucuronolactone is found in combined supplements together with taurine and caffeine. It can also be stacked with other pre-workout ingredients like creatine, beta-alanine, and citrulline. Glucuronolactone is known for physical energy & mental focus, and it is an ingredient found in some concentrated pre-workout supplements, pre-workout supplements, and fat-loss proteins.
Get an overview of this study by requesting a free sample
The rising demand for sports supplements: The increasing adoption of a sedentary lifestyle and growing consumption of an unhealthy diet are propelling market growth. Further, the increasing demand for instant energy-releasing products like Rockstar, Red Bull, and Monster is helping to boost the market growth. Further, a growing preference for healthy, active living and the rising demand for clean-label and plant-based products are helping to drive the market growth during the forecast period. Additionally, manufacturers' increasing use of social media platforms like Instagram and YouTube to promote sports products is expected to propel market growth over the forecast period. Moreover, the increasing disposable income of the consumers, and rising focus on sports nutrition encourage new product development, coupled with the rising awareness of sports nutrition are stimulating the market growth during the forthcoming year.
The stringent regulations on energy drinks: The glucuronolactone's unfavourable health effects are a restraining factor of the market growth. Furthermore, the high cost of nutritional supplements and the different side effects caused by dietary supplements hamper the market growth. Also, the main concern with energy drinks is the need for more safety regulations. The additives in the drinks (such as taurine, ginseng, and guarana) have yet to be well-studied and must be carefully regulated by the FDA. Moreover, energy drink firms sometimes label their products as "supplements" to avoid rules applied to other beverages. Thus, these factors are restraining the market growth.
The rise in the consumption of energy drinks: Energy drinks are distributed through supermarkets/hypermarkets, convenience stores, pharmacies/health stores, and online retailers. These energy drinks are packed in bottles, cans, and other. Additionally, energy drinks are carbonated drinks that contain sugar and caffeine to increase physical performance & mental alertness. Further, the high consumer purchasing power, rising health consciousness, changes in consumer lifestyle, and growing awareness of health and wellness products are helping to boost the market growth. Moreover, the ever-increasing living standards and the rising demand for alcoholic energy drinks propel the market growth during the forecast period.
The regions analyzed for the market include Europe, South America, Asia Pacific, North America, the Middle East, and Africa. North America emerged as the largest global glucuronolactone market, with a 42.39% market revenue share in 2022. North America dominates the glucuronolactone market due to the increasing demand for energy drinks and nutritional supplements. Further, the rising old age population coupled with a deskbound working lifestyle is also helping to propel the market growth in this region. Additionally, the increasing consumption of food and the rising awareness of the health benefits of antioxidants are helping to boost the market growth in this region. Asia Pacific is expected to grow the fastest during the forecast period due to the abundant product availability in China. Furthermore, government support, increasing investment in R&D, and the changing lifestyles of consumers are expected to drive market growth in this region. Apart from this, the changing demographics, consumers' tastes and drinking habits, and the growing awareness regarding health consciousness are expected to propel market growth over the forecast period.
North America Region Glucuronolactone Market Share in 2022 - 42.39%
www.thebrainyinsights.com
Check the geographical analysis of this market by requesting a free sample
The application segment is divided into processing aids & additives, preservatives, energy supplements, antioxidants, and others. The energy supplements segment dominated, with a market share of 27.32% in 2022. This growth is attributed to the rising awareness among consumers about health and fitness. Further, by 2030, the antioxidants segment will likely dominate the market due to the increasing requirement for the long shelf life of packaged food. Also, customer awareness of the health advantages of natural antioxidant consumption is helping to boost the segment's market growth.
The type segment is divided into liquid, powder, and tablet/capsule. In 2022, the powder segment dominated the market with the largest market share of 42.25% and market revenue of 163.96 million. This growth is attributed to the increasing health awareness among the populace. Further, by 2030, the liquid segment will likely dominate the market due to the rising disposable income.
The end-user segment is divided into energy drinks, dietary supplements, pharmaceuticals, functional food, and cosmetics. In 2022, the pharmaceutical segment dominated the market, accounting for around 29.19% of global revenue. This growth is attributed to the increasing usage of glucuronolactone-based tablets and supplements to cure arthritis, hepatitis, and hepatocirrhosis. Further, by 2030, the energy drinks segment will likely dominate the market due to the emergence of multiple players in the domestic and international industries with constant ingredients. However, energy drinks are a component of the broader soft drinks or non-alcoholic drinks industry, including carbonated drinks, sports drinks, fruit & vegetable juices, bottled water, caffeinated beverages, ready-to-drink coffee & tea, non-carbonated packaged drinks, and other functional beverages. Also, dietary supplements include vitamins, amino acids, enzymes, minerals, and herbs. These nutritional supplements are sold in forms like liquids, gel caps, tablets, capsules, soft gels, and powders.
| Attribute | Description |
|---|---|
| Market Size | Revenue (USD Million) |
| Market size value in 2022 | USD 388.07 Million |
| Market size value in 2030 | USD 593.76 Million |
| CAGR (2022 to 2030) | 5.46% |
| Historical data | 2019-2020 |
| Base Year | 2021 |
| Forecast | 2022-2030 |
| Segments | Key Segments are application, type, end-user, and regions |
| Regional Segments | The key regions are North America, South America, Europe, Asia Pacific, and Middle East & Africa. |
As per The Brainy Insights, the size of the glucuronolactone market was valued at USD 388.07 million in 2022 to USD 593.76 million by 2030.
The global glucuronolactone market is growing at a CAGR of 5.46% during the forecast period 2022-2030.
The global glucuronolactone market has been segmented based on application, type, end-user, and region. The energy supplements segment led the application segment in 2021. The powder segment led the type segment in 2021.
North America region emerged as the largest market for glucuronolactone.
1. Introduction
1.1. Objectives of the Study
1.2. Market Definition
1.3. Research Scope
1.4. Currency
1.5. Key Target Audience
2. Research Methodology and Assumptions
3. Executive Summary
4. Premium Insights
4.1. Porter’s Five Forces Analysis
4.2. Value Chain Analysis
4.3. Top Investment Pockets
4.3.1. Market Attractiveness Analysis By Application
4.3.2. Market Attractiveness Analysis By Type
4.3.3. Market Attractiveness Analysis By End-User
4.3.4. Market Attractiveness Analysis By Region
4.4. Industry Trends
5. Market Dynamics
5.1. Market Evaluation
5.2. Drivers
5.2.1. The high consumer purchasing power
5.2.2. The rising demand for sports supplements
5.2.3. The increasing investment in R&D
5.3. Restraints
5.3.1. The stringent regulations on energy drinks
5.3.2. The high glucuronolactone prices
5.4. Opportunities
5.4.1. The rapid technological advancements
6. Global Glucuronolactone Market Analysis and Forecast, By Application
6.1. Segment Overview
6.2. Processing Aids & Additives
6.3. Preservatives
6.4. Energy Supplements
6.5. Antioxidants
6.6. Others
7. Global Glucuronolactone Market Analysis and Forecast, By Type
7.1. Segment Overview
7.2. Liquid
7.3. Powder
7.4. Tablet/Capsule
8. Global Glucuronolactone Market Analysis and Forecast, By End-User
8.1. Segment Overview
8.2. Energy Drinks
8.3. Dietary Supplements
8.4. Pharmaceuticals
8.5. Functional Food
8.6. Cosmetics
9. Global Glucuronolactone Market Analysis and Forecast, By Regional Analysis
9.1. Segment Overview
9.2. North America
9.2.1. U.S.
9.2.2. Canada
9.2.3. Mexico
9.3. Europe
9.3.1. Germany
9.3.2. France
9.3.3. U.K.
9.3.4. Italy
9.3.5. Spain
9.4. Asia-Pacific
9.4.1. Japan
9.4.2. China
9.4.3. India
9.5. South America
9.5.1. Brazil
9.6. Middle East and Africa
9.6.1. UAE
9.6.2. South Africa
10. Global Glucuronolactone Market-Competitive Landscape
10.1. Overview
10.2. Market Share of Key Players in Global Glucuronolactone Market
10.2.1. Global Company Market Share
10.2.2. North America Company Market Share
10.2.3. Europe Company Market Share
10.2.4. APAC Company Market Share
10.3. Competitive Situations and Trends
10.3.1. Product Launches and Developments
10.3.2. Partnerships, Collaborations, and Agreements
10.3.3. Mergers & Acquisitions
10.3.4. Expansions
11. Company Profiles
11.1. Hubei Yitai Pharmaceutical Co.Ltd.
11.1.1. Business Overview
11.1.2. Company Snapshot
11.1.3. Company Market Share Analysis
11.1.4. Company Product Portfolio
11.1.5. Recent Developments
11.1.6. SWOT Analysis
11.2. Anhui Fubore Pharmaceutical & Chemical Co.Ltd.
11.2.1. Business Overview
11.2.2. Company Snapshot
11.2.3. Company Market Share Analysis
11.2.4. Company Product Portfolio
11.2.5. Recent Developments
11.2.6. SWOT Analysis
11.3. Shaoxing Marina Biotechnology Co.Ltd.
11.3.1. Business Overview
11.3.2. Company Snapshot
11.3.3. Company Market Share Analysis
11.3.4. Company Product Portfolio
11.3.5. Recent Developments
11.3.6. SWOT Analysis
11.4. Merck Millipore Corporation
11.4.1. Business Overview
11.4.2. Company Snapshot
11.4.3. Company Market Share Analysis
11.4.4. Company Product Portfolio
11.4.5. Recent Developments
11.4.6. SWOT Analysis
11.5. Jungbunzlauer
11.5.1. Business Overview
11.5.2. Company Snapshot
11.5.3. Company Market Share Analysis
11.5.4. Company Product Portfolio
11.5.5. Recent Developments
11.5.6. SWOT Analysis
11.6. Functional Food chem International Corporation
11.6.1. Business Overview
11.6.2. Company Snapshot
11.6.3. Company Market Share Analysis
11.6.4. Company Product Portfolio
11.6.5. Recent Developments
11.6.6. SWOT Analysis
11.7. Ceto Corporation
11.7.1. Business Overview
11.7.2. Company Snapshot
11.7.3. Company Market Share Analysis
11.7.4. Company Product Portfolio
11.7.5. Recent Developments
11.7.6. SWOT Analysis
11.8. Shandong Fuyuan Bio-Tech CO.LTD.
11.8.1. Business Overview
11.8.2. Company Snapshot
11.8.3. Company Market Share Analysis
11.8.4. Company Product Portfolio
11.8.5. Recent Developments
11.8.6. SWOT Analysis
11.9. Shandong Xinhong Pharmaceutical Co., Ltd.
11.9.1. Business Overview
11.9.2. Company Snapshot
11.9.3. Company Market Share Analysis
11.9.4. Company Product Portfolio
11.9.5. Recent Developments
11.9.6. SWOT Analysis
11.10. Roquette Frères
11.10.1. Business Overview
11.10.2. Company Snapshot
11.10.3. Company Market Share Analysis
11.10.4. Company Product Portfolio
11.10.5. Recent Developments
11.10.6. SWOT Analysis
11.11. Creative Compound
11.11.1. Business Overview
11.11.2. Company Snapshot
11.11.3. Company Market Share Analysis
11.11.4. Company Product Portfolio
11.11.5. Recent Developments
11.11.6. SWOT Analysis
11.12. Foodchem International
11.12.1. Business Overview
11.12.2. Company Snapshot
11.12.3. Company Market Share Analysis
11.12.4. Company Product Portfolio
11.12.5. Recent Developments
11.12.6. SWOT Analysis
11.13. Shandong Baisheng Biotechnology Co., Ltd.
11.13.1. Business Overview
11.13.2. Company Snapshot
11.13.3. Company Market Share Analysis
11.13.4. Company Product Portfolio
11.13.5. Recent Developments
11.13.6. SWOT Analysis
List of Table
1. Global Glucuronolactone Market, By Application, 2019-2030 (USD Million)
2. Global Processing Aids & Additives, Glucuronolactone Market, By Region, 2019-2030 (USD Million)
3. Global Preservatives, Glucuronolactone Market, By Region, 2019-2030 (USD Million)
4. Global Energy Supplements, Glucuronolactone Market, By Region, 2019-2030 (USD Million)
5. Global Antioxidants, Glucuronolactone Market, By Region, 2019-2030 (USD Million)
6. Global Others, Glucuronolactone Market, By Region, 2019-2030 (USD Million)
7. Global Glucuronolactone Market, By Type, 2019-2030 (USD Million)
8. Global Liquid, Glucuronolactone Market, By Region, 2019-2030 (USD Million)
9. Global Powder, Glucuronolactone Market, By Region, 2019-2030 (USD Million)
10. Global Tablet/Capsule, Glucuronolactone Market, By Region, 2019-2030 (USD Million)
11. Global Glucuronolactone Market, By End-User, 2019-2030 (USD Million)
12. Global Energy Drinks, Glucuronolactone Market, By Region, 2019-2030 (USD Million)
13. Global Dietary Supplements, Glucuronolactone Market, By Region, 2019-2030 (USD Million)
14. Global Pharmaceuticals, Glucuronolactone Market, By Region, 2019-2030 (USD Million)
15. Global Cosmetics, Glucuronolactone Market, By Region, 2019-2030 (USD Million)
16. Global Functional Food, Glucuronolactone Market, By Region, 2019-2030 (USD Million)
17. North America Glucuronolactone Market, By Application, 2019-2030 (USD Million)
18. North America Glucuronolactone Market, By Type, 2019-2030 (USD Million)
19. North America Glucuronolactone Market, By End-User, 2019-2030 (USD Million)
20. U.S. Glucuronolactone Market, By Application, 2019-2030 (USD Million)
21. U.S. Glucuronolactone Market, By Type, 2019-2030 (USD Million)
22. U.S. Glucuronolactone Market, By End-User, 2019-2030 (USD Million)
23. Canada Glucuronolactone Market, By Application, 2019-2030 (USD Million)
24. Canada Glucuronolactone Market, By Type, 2019-2030 (USD Million)
25. Canada Glucuronolactone Market, By End-User, 2019-2030 (USD Million)
26. Mexico Glucuronolactone Market, By Application, 2019-2030 (USD Million)
27. Mexico Glucuronolactone Market, By Type, 2019-2030 (USD Million)
28. Mexico Glucuronolactone Market, By End-User, 2019-2030 (USD Million)
29. Europe Glucuronolactone Market, By Application, 2019-2030 (USD Million)
30. Europe Glucuronolactone Market, By Type, 2019-2030 (USD Million)
31. Europe Glucuronolactone Market, By End-User, 2019-2030 (USD Million)
32. Germany Glucuronolactone Market, By Application, 2019-2030 (USD Million)
33. Germany Glucuronolactone Market, By Type, 2019-2030 (USD Million)
34. Germany Glucuronolactone Market, By End-User, 2019-2030 (USD Million)
35. France Glucuronolactone Market, By Application, 2019-2030 (USD Million)
36. France Glucuronolactone Market, By Type, 2019-2030 (USD Million)
37. France Glucuronolactone Market, By End-User, 2019-2030 (USD Million)
38. U.K. Glucuronolactone Market, By Application, 2019-2030 (USD Million)
39. U.K. Glucuronolactone Market, By Type, 2019-2030 (USD Million)
40. U.K. Glucuronolactone Market, By End-User, 2019-2030 (USD Million)
41. Italy Glucuronolactone Market, By Application, 2019-2030 (USD Million)
42. Italy Glucuronolactone Market, By Type, 2019-2030 (USD Million)
43. Italy Glucuronolactone Market, By End-User, 2019-2030 (USD Million)
44. Spain Glucuronolactone Market, By Application, 2019-2030 (USD Million)
45. Spain Glucuronolactone Market, By Type, 2019-2030 (USD Million)
46. Spain Glucuronolactone Market, By End-User, 2019-2030 (USD Million)
47. Asia Pacific Glucuronolactone Market, By Application, 2019-2030 (USD Million)
48. Asia Pacific Glucuronolactone Market, By Type, 2019-2030 (USD Million)
49. Asia Pacific Glucuronolactone Market, By End-User, 2019-2030 (USD Million)
50. Japan Glucuronolactone Market, By Application, 2019-2030 (USD Million)
51. Japan Glucuronolactone Market, By Type, 2019-2030 (USD Million)
52. Japan Glucuronolactone Market, By End-User, 2019-2030 (USD Million)
53. China Glucuronolactone Market, By Application, 2019-2030 (USD Million)
54. China Glucuronolactone Market, By Type, 2019-2030 (USD Million)
55. China Glucuronolactone Market, By End-User, 2019-2030 (USD Million)
56. India Glucuronolactone Market, By Application, 2019-2030 (USD Million)
57. India Glucuronolactone Market, By Type, 2019-2030 (USD Million)
58. India Glucuronolactone Market, By End-User, 2019-2030 (USD Million)
59. South America Glucuronolactone Market, By Application, 2019-2030 (USD Million)
60. South America Glucuronolactone Market, By Type, 2019-2030 (USD Million)
61. South America Glucuronolactone Market, By End-User, 2019-2030 (USD Million)
62. Brazil Glucuronolactone Market, By Application, 2019-2030 (USD Million)
63. Brazil Glucuronolactone Market, By Type, 2019-2030 (USD Million)
64. Brazil Glucuronolactone Market, By End-User, 2019-2030 (USD Million)
65. Middle East and Africa Glucuronolactone Market, By Application, 2019-2030 (USD Million)
66. Middle East and Africa Glucuronolactone Market, By Type, 2019-2030 (USD Million)
67. Middle East and Africa Glucuronolactone Market, By End-User, 2019-2030 (USD Million)
68. UAE Glucuronolactone Market, By Application, 2019-2030 (USD Million)
69. UAE Glucuronolactone Market, By Type, 2019-2030 (USD Million)
70. UAE Glucuronolactone Market, By End-User, 2019-2030 (USD Million)
71. South Africa Glucuronolactone Market, By Application, 2019-2030 (USD Million)
72. South Africa Glucuronolactone Market, By Type, 2019-2030 (USD Million)
73. South Africa Glucuronolactone Market, By End-User, 2019-2030 (USD Million)
List of Figures
1. Global Glucuronolactone Market Segmentation
2. Global Glucuronolactone Market: Research Methodology
3. Market Size Estimation Methodology: Bottom-Up Approach
4. Market Size Estimation Methodology: Top- Approach
5. Data Triangulation
6. Porter’s Five Forces Analysis
7. Value Chain Analysis
8. Global Glucuronolactone Market Attractiveness Analysis By Application
9. Global Glucuronolactone Market Attractiveness Analysis By Type
10. Global Glucuronolactone Market Attractiveness Analysis By End-User
11. Global Glucuronolactone Market Attractiveness Analysis By Region
12. Global Glucuronolactone Market: Dynamics
13. Global Glucuronolactone Market Share By Application (2022 & 2030)
14. Global Glucuronolactone Market Share By Type (2022 & 2030)
15. Global Glucuronolactone Market Share By End-User (2022 & 2030)
16. Global Glucuronolactone Market Share By Regions (2022 & 2030)
17. Global Glucuronolactone Market Share By Company (2021)
This study forecasts revenue at global, regional, and country levels from 2019 to 2030. The Brainy Insights has segmented the global glucuronolactone based on below mentioned segments:
Global Glucuronolactone Market by Application:
Global Glucuronolactone Market by Type:
Global Glucuronolactone Market by End-User:
Global Glucuronolactone by Region:
Research has its special purpose to undertake marketing efficiently. In this competitive scenario, businesses need information across all industry verticals; the information about customer wants, market demand, competition, industry trends, distribution channels etc. This information needs to be updated regularly because businesses operate in a dynamic environment. Our organization, The Brainy Insights incorporates scientific and systematic research procedures in order to get proper market insights and industry analysis for overall business success. The analysis consists of studying the market from a miniscule level wherein we implement statistical tools which helps us in examining the data with accuracy and precision.
Our research reports feature both; quantitative and qualitative aspects for any market. Qualitative information for any market research process are fundamental because they reveal the customer needs and wants, usage and consumption for any product/service related to a specific industry. This in turn aids the marketers/investors in knowing certain perceptions of the customers. Qualitative research can enlighten about the different product concepts and designs along with unique service offering that in turn, helps define marketing problems and generate opportunities. On the other hand, quantitative research engages with the data collection process through interviews, e-mail interactions, surveys and pilot studies. Quantitative aspects for the market research are useful to validate the hypotheses generated during qualitative research method, explore empirical patterns in the data with the help of statistical tools, and finally make the market estimations.
The Brainy Insights offers comprehensive research and analysis, based on a wide assortment of factual insights gained through interviews with CXOs and global experts and secondary data from reliable sources. Our analysts and industry specialist assume vital roles in building up statistical tools and analysis models, which are used to analyse the data and arrive at accurate insights with exceedingly informative research discoveries. The data provided by our organization have proven precious to a diverse range of companies, facilitating them to address issues such as determining which products/services are the most appealing, whether or not customers use the product in the manner anticipated, the purchasing intentions of the market and many others.
Our research methodology encompasses an idyllic combination of primary and secondary initiatives. Key phases involved in this process are listed below:

The phase involves the gathering and collecting of market data and its related information with the help of different sources & research procedures.

The data procurement stage involves in data gathering and collecting through various data sources.
This stage involves in extensive research. These data sources includes:
Purchased Database: Purchased databases play a crucial role in estimating the market sizes irrespective of the domain. Our purchased database includes:
Primary Research: The Brainy Insights interacts with leading companies and experts of the concerned domain to develop the analyst team’s market understanding and expertise. It improves and substantiates every single data presented in the market reports. Primary research mainly involves in telephonic interviews, E-mail interactions and face-to-face interviews with the raw material providers, manufacturers/producers, distributors, & independent consultants. The interviews that we conduct provides valuable data on market size and industry growth trends prevailing in the market. Our organization also conducts surveys with the various industry experts in order to gain overall insights of the industry/market. For instance, in healthcare industry we conduct surveys with the pharmacists, doctors, surgeons and nurses in order to gain insights and key information of a medical product/device/equipment which the customers are going to usage. Surveys are conducted in the form of questionnaire designed by our own analyst team. Surveys plays an important role in primary research because surveys helps us to identify the key target audiences of the market. Additionally, surveys helps to identify the key target audience engaged with the market. Our survey team conducts the survey by targeting the key audience, thus gaining insights from them. Based on the perspectives of the customers, this information is utilized to formulate market strategies. Moreover, market surveys helps us to understand the current competitive situation of the industry. To be precise, our survey process typically involve with the 360 analysis of the market. This analytical process begins by identifying the prospective customers for a product or service related to the market/industry to obtain data on how a product/service could fit into customers’ lives.

Secondary Research: The secondary data sources includes information published by the on-profit organizations such as World bank, WHO, company fillings, investor presentations, annual reports, national government documents, statistical databases, blogs, articles, white papers and others. From the annual report, we analyse a company’s revenue to understand the key segment and market share of that organization in a particular region. We analyse the company websites and adopt the product mapping technique which is important for deriving the segment revenue. In the product mapping method, we select and categorize the products offered by the companies catering to domain specific market, deduce the product revenue for each of the companies so as to get overall estimation of the market size. We also source data and analyses trends based on information received from supply side and demand side intermediaries in the value chain. The supply side denotes the data gathered from supplier, distributor, wholesaler and the demand side illustrates the data gathered from the end customers for respective market domain.

The supply side for a domain specific market is analysed by:
The demand side for the market is estimated through:
In-house Library: Apart from these third-party sources, we have our in-house library of qualitative and quantitative information. Our in-house database includes market data for various industry and domains. These data are updated on regular basis as per the changing market scenario. Our library includes, historic databases, internal audit reports and archives.
Sometimes there are instances where there is no metadata or raw data available for any domain specific market. For those cases, we use our expertise to forecast and estimate the market size in order to generate comprehensive data sets. Our analyst team adopt a robust research technique in order to produce the estimates:
Data Synthesis: This stage involves the analysis & mapping of all the information obtained from the previous step. It also involves in scrutinizing the data for any discrepancy observed while data gathering related to the market. The data is collected with consideration to the heterogeneity of sources. Robust scientific techniques are in place for synthesizing disparate data sets and provide the essential contextual information that can orient market strategies. The Brainy Insights has extensive experience in data synthesis where the data passes through various stages:


Market Deduction & Formulation: The final stage comprises of assigning data points at appropriate market spaces so as to deduce feasible conclusions. Analyst perspective & subject matter expert based holistic form of market sizing coupled with industry analysis also plays a crucial role in this stage.
This stage involves in finalization of the market size and numbers that we have collected from data integration step. With data interpolation, it is made sure that there is no gap in the market data. Successful trend analysis is done by our analysts using extrapolation techniques, which provide the best possible forecasts for the market.
Data Validation & Market Feedback: Validation is the most important step in the process. Validation & re-validation via an intricately designed process helps us finalize data-points to be used for final calculations.

The Brainy Insights interacts with leading companies and experts of the concerned domain to develop the analyst team’s market understanding and expertise. It improves and substantiates every single data presented in the market reports. The data validation interview and discussion panels are typically composed of the most experienced industry members. The participants include, however, are not limited to:
Moreover, we always validate our data and findings through primary respondents from all the major regions we are working on.


Free Customization
Fortune 500 Clients
Free Yearly Update On Purchase Of Multi/Corporate License
Companies Served Till Date