- +1-315-215-1633
- sales@thebrainyinsights.com

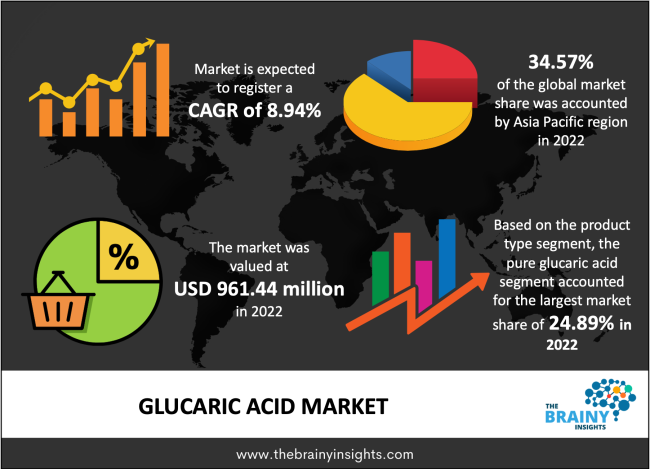
The global glucaric acid market was valued at USD 961.44 million in 2022 and growing at a CAGR of 8.94% from 2022 to 2030. The market is expected to reach USD 1,907.30 million by 2030. North America is expected to increase the fastest during the forecast period.
Glucaric acid, known as polyhydroxy dicarboxylic acid, is an aldaric acid produced organically by nitric acid oxidizing with polysaccharides, such as glucose. It is frequently employed in the production of bio-based compounds and other derivatives. It is biodegradable by nature and can also be taken from various vegetables and fruits, including apples, grapes, cabbage, broccoli, tomatoes, and bean sprouts. Consuming glucaric acid lowers cancer risk by preventing the body from producing beta-glucuronidase. Additionally, it serves as a chelating agent in industrial detergents. It is, therefore, commonly utilized in the production of medicines, corrosion inhibitors, de-icing agents, food and beverage additives, and liquid detergents. The US Department of Energy has identified glucaric acid as one of the most crucial chemical building blocks that can be transformed into several high-value, bio-based compounds. Glucaric acid is produced when glucose is oxidized. Throughout the projection period, this aspect is anticipated to fuel the global glucaric acid market's expansion. The growing environmental consciousness among the general public and the increased demand for sustainable products are the main factors driving the global glucaric acid market. Additionally, the market is expanding due to the widespread use of glucaric acid as a detergent additive in place of phosphates. It is a very effective cleaning agent because it traps complex water pollutants and stops them from foaming up soap scum. Accordingly, rising consumer preference for liquid detergents for laundry, dishwashing, and domestic cleaning is also boosting the market. Glucaric acid is also a growth-promoting agent in producing nylon and other polymers. Product manufacturers are using innovative technologies to produce acid from biomass with the least amount of trash possible. It is projected that further factors, such as increased consumer spending power and implementing pro-environment government policies, will propel the industry toward expansion. The growing need for the chemical in detergent applications to reduce the levels of magnesium and calcium in hard water and avoid its buildup is driving the market for glucaric acid. Additionally, glucaric acid is frequently utilized as a substitute for phosphate in cleaning products due to growing knowledge of the toxicity and potential risks of non-biodegradable compounds in phosphate-based cleaning products. Because of this and the increasing movement in consumer behaviour toward biodegradable products, the market growth for glucaric acid has increased. The market is growing since glucaric acid is increasingly and diversely used as a cleaning agent in liquid laundry detergents, dishwasher detergents, and household cleaning products. Additionally, because glucaric acid is made from oxidized sugar, it is considered an environmentally safe, renewable, and sustainable material. As a result, consumer demand for glucaric acid strongly propels market expansion. Additionally, since manufacturing glucaric acid only requires one step, its widespread and economical production is a significant factor in the market's development.
Get an overview of this study by requesting a free sample
Kalion gathered several tonnes of glucaric acid in November 2021 from its first large-scale fermentation, carried out by Evonik Industries. Applications for glucaric acid include boosting pharmaceutical ingredients, enhancing recycled cotton quality, and substituting phosphate corrosion inhibitors. It is among the 12 compounds the US Department of Energy has recognized as the foundation of a biobased materials economy. According to Kalion CEO Darcy Prather, buyers are prepared to sign contracts as soon as the company produces two more successful batches.
The development of glucaric acid using R&D- Utilizing renewable resources and science, glucaric acid producers can produce a plentiful and significantly more affordable supply of glucarate and its derivatives. Current market development for glucaric acid uses this compound to create specific polymers, mainly nylon. Additionally, producers are focusing on developing innovative procedures that help reduce the quantity of waste produced during production. Researchers are employing various techniques to create glucaric acid from biomass molecules. Glucose electrolysis was utilized to produce glucaric acid electrochemically and efficiently.
Market-related high costs- For the leading industry players in the glucaric acid market, expensive manufacturing processes, high labour costs, and a competitive market are some significant aspects that are projected to remain a big issue.
Increasing need for glucaric acid across various industries- To produce a significantly abundant and cost-effective supply of glucarate and its byproducts, the businesses engaged in producing glucaric acid are integrating scientific evidence into renewable resources. Numerous practical advantages of glucaric acid in the food, pharmaceutical, and polymer industries have led to favourable growth prospects for the market. The usage of glucaric acid is also anticipated to be encouraged by several initiatives supporting sustainability and environmental protection in several end-user sectors. Consumers' positive spending trends are predicted to boost expenditures in food, detergent, and other industries, which would indirectly help the sales of glucaric acid. These are some additional critical drivers of market growth over the forecast period.
Difficulties in glucaric acid manufacturing and barriers to its commercialization- Although glucaric acid can be processed in a single step, the production method relies on the application of nitric acid, which produces waste and dangerous NOx gas. This gas needs to be processed prior to being discharged into the atmosphere. As a result, the production of NOx hinders the widespread production of glucaric acid to some extent, which is predicted to hamper the anticipated expansion of the level of glucaric acid requirement. The production and sale of glucaric acid have been severely constrained by a lack of economically viable manufacturing techniques. Poor selectivity and low yields of conventional processing techniques, including nitric acid oxidation, drive manufacturing costs. Additionally, chemically produced glucaric acid requires careful purification. Both inexpensive and very pure glucaric acid can be made using a fermentation-based approach.
The regions analyzed for the market include North America, Europe, South America, Asia Pacific, the Middle East, and Africa. Asia Pacific emerged as the most significant global glucaric acid market, with a 34.57% market revenue share in 2022.
Asia Pacific, which accounted for 34.57% of the total revenue in the global glucaric acid market in 2022, led the market revenue share. This is due to the increasing demand for glucaric acid from the food and detergent industries, particularly in developing nations like China and India. This region is where glucaric acid is made most of the time. Compared to European and North American countries, China, India, and Taiwan are recognized to have plentiful raw material resources and less expensive labour. Consequently, big firms like Rivertop and Rennovia have established manufacturing plants in developing Asia Pacific nations.
Asia-Pacific Region Glucaric Acid Market Share in 2022 - 34.57%
www.thebrainyinsights.com
Check the geographical analysis of this market by requesting a free sample
The product segment is divided into calcium d-glucarate, d-glucaric acid-1,4-lactone, pure glucaric acid, potassium sodium d-glucarate, and others. The pure glucaric acid segment dominated the market, with a market share of around 24.89% in 2022. This is because they are more affordable and accessible than other products.
The application segment is divided into detergents, de-icing applications, food ingredients, corrosion inhibitors, and others. In 2022, the food ingredients segment dominated the market, accounting for around 27.55% of global revenue. Increased intake of regular meals has been a significant factor in expanding the demand because awareness of preserving the levels of critical nutrients has increased.
| Attribute | Description |
|---|---|
| Market Size | Revenue (USD Million) |
| Market size value in 2022 | USD 961.44 Million |
| Market size value in 2030 | USD 1,907.30 Million |
| CAGR (2022 to 2030) | 8.94% |
| Historical data | 2019-2020 |
| Base Year | 2021 |
| Forecast | 2022-2030 |
| Segments | Product, Application |
| Regional Segments | The regions analyzed for the market are Europe, Asia Pacific, North America, South America, and Middle East & Africa. |
As per The Brainy Insights, the size of the glucaric acid market was valued USD 961.44 million in 2022 & USD 1,907.30 million by 2030.
Global glucaric acid market is growing at a CAGR of 8.94% during the forecast period 2022-2030.
Asia Pacific region emerged as the largest market for the glucaric acid.
Market-related high costs hamper the market growth.
The market's growth will be challenged by difficulties in glucaric acid manufacturing and barriers to its commercialization.
Increasing need of glucaric acid across a variety of industries is providing huge opportunities to the market.
1. Introduction
1.1. Objective of the Study
1.2. Market Definition
1.3. Research Scope
1.4. Currency
1.5. Key Target Audience
2. Research Methodology and Assumptions
3. Executive Summary
4. Premium Insights
4.1. Porter’s Five Forces Analysis
4.2. Value Chain Analysis
4.3. Top Investment Pockets
4.3.1. Market Attractiveness Analysis By Product
4.3.2. Market Attractiveness Analysis By Application
4.3.3. Market Attractiveness Analysis By Region
4.4. Industry Trends
5. Market Dynamics
5.1. Market Evaluation
5.2. Drivers
5.2.1. The development of glucaric acid using R&D
5.3. Restraints
5.3.1. Market-related high costs
5.4. Opportunities
5.4.1. Increasing need of glucaric acid across a variety of industries
5.5. Challenges
5.5.1. Difficulties in glucaric acid manufacturing and barriers to its commercialization
6. Global Glucaric Acid Market Analysis and Forecast, By Product
6.1. Segment Overview
6.2. Calcium D-glucarate
6.3. D-glucaric Acid-1,4-lactone
6.4. Pure Glucaric Acid
6.5. Potassium Sodium D-glucarate
6.6. Others
7. Global Glucaric Acid Market Analysis and Forecast, By Application
7.1. Segment Overview
7.2. Detergents
7.3. De-icing Applications
7.4. Food Ingredients
7.5. Corrosion Inhibitors
7.6. Others
8. Global Glucaric Acid Market Analysis and Forecast, By Regional Analysis
8.1. Segment Overview
8.2. North America
8.2.1. U.S.
8.2.2. Canada
8.2.3. Mexico
8.3. Europe
8.3.1. Germany
8.3.2. France
8.3.3. U.K.
8.3.4. Italy
8.3.5. Spain
8.4. Asia-Pacific
8.4.1. Japan
8.4.2. China
8.4.3. India
8.5. South America
8.5.1. Brazil
8.6. Middle East and Africa
8.6.1. UAE
8.6.2. South Africa
9. Global Glucaric Acid Market-Competitive Landscape
9.1. Overview
9.2. Market Share of Key Players in the Glucaric Acid Market
9.2.1. Global Company Market Share
9.2.2. North America Company Market Share
9.2.3. Europe Company Market Share
9.2.4. APAC Company Market Share
9.3. Competitive Situations and Trends
9.3.1. Product Launches and Developments
9.3.2. Partnerships, Collaborations, and Agreements
9.3.3. Mergers & Acquisitions
9.3.4. Expansions
10. Company Profiles
10.1. BASF SE
10.1.1. Business Overview
10.1.2. Company Snapshot
10.1.3. Company Market Share Analysis
10.1.4. Company Product Portfolio
10.1.5. Recent Developments
10.1.6. SWOT Analysis
10.2. Kalion Inc.
10.2.1. Business Overview
10.2.2. Company Snapshot
10.2.3. Company Market Share Analysis
10.2.4. Company Product Portfolio
10.2.5. Recent Developments
10.2.6. SWOT Analysis
10.3. Biosynth Carbosynth
10.3.1. Business Overview
10.3.2. Company Snapshot
10.3.3. Company Market Share Analysis
10.3.4. Company Product Portfolio
10.3.5. Recent Developments
10.3.6. SWOT Analysis
10.4. Jungbunzlauer Suisse AG
10.4.1. Business Overview
10.4.2. Company Snapshot
10.4.3. Company Market Share Analysis
10.4.4. Company Product Portfolio
10.4.5. Recent Developments
10.4.6. SWOT Analysis
10.5. PMP Inc
10.5.1. Business Overview
10.5.2. Company Snapshot
10.5.3. Company Market Share Analysis
10.5.4. Company Product Portfolio
10.5.5. Recent Developments
10.5.6. SWOT Analysis
10.6. biofuels Digest
10.6.1. Business Overview
10.6.2. Company Snapshot
10.6.3. Company Market Share Analysis
10.6.4. Company Product Portfolio
10.6.5. Recent Developments
10.6.6. SWOT Analysis
10.7. Navozymes
10.7.1. Business Overview
10.7.2. Company Snapshot
10.7.3. Company Market Share Analysis
10.7.4. Company Product Portfolio
10.7.5. Recent Developments
10.7.6. SWOT Analysis
10.8. Haihang Industry
10.8.1. Business Overview
10.8.2. Company Snapshot
10.8.3. Company Market Share Analysis
10.8.4. Company Product Portfolio
10.8.5. Recent Developments
10.8.6. SWOT Analysis
10.9. CHEMOS GmbH & Co. KG
10.9.1. Business Overview
10.9.2. Company Snapshot
10.9.3. Company Market Share Analysis
10.9.4. Company Product Portfolio
10.9.5. Recent Developments
10.9.6. SWOT Analysis
10.10. AK Scientific Inc.
10.10.1. Business Overview
10.10.2. Company Snapshot
10.10.3. Company Market Share Analysis
10.10.4. Company Product Portfolio
10.10.5. Recent Developments
10.10.6. SWOT Analysis
10.11. Merck KGaA
10.11.1. Business Overview
10.11.2. Company Snapshot
10.11.3. Company Market Share Analysis
10.11.4. Company Product Portfolio
10.11.5. Recent Developments
10.11.6. SWOT Analysis
10.12. Alfa Aesar
10.12.1. Business Overview
10.12.2. Company Snapshot
10.12.3. Company Market Share Analysis
10.12.4. Company Product Portfolio
10.12.5. Recent Developments
10.12.6. SWOT Analysis
10.13. Occidental Petroleum Corporation
10.13.1. Business Overview
10.13.2. Company Snapshot
10.13.3. Company Market Share Analysis
10.13.4. Company Product Portfolio
10.13.5. Recent Developments
10.13.6. SWOT Analysis
10.14. Rivertop Renewables, Inc.
10.14.1. Business Overview
10.14.2. Company Snapshot
10.14.3. Company Market Share Analysis
10.14.4. Company Product Portfolio
10.14.5. Recent Developments
10.14.6. SWOT Analysis
10.15. The Archer-Daniels-Midland Company
10.15.1. Business Overview
10.15.2. Company Snapshot
10.15.3. Company Market Share Analysis
10.15.4. Company Product Portfolio
10.15.5. Recent Developments
10.15.6. SWOT Analysis
10.16. TCI Chemicals
10.16.1. Business Overview
10.16.2. Company Snapshot
10.16.3. Company Market Share Analysis
10.16.4. Company Product Portfolio
10.16.5. Recent Developments
10.16.6. SWOT Analysis
10.17. R-Biopharm
10.17.1. Business Overview
10.17.2. Company Snapshot
10.17.3. Company Market Share Analysis
10.17.4. Company Product Portfolio
10.17.5. Recent Developments
10.17.6. SWOT Analysis
10.18. Cayman Chemicals
10.18.1. Business Overview
10.18.2. Company Snapshot
10.18.3. Company Market Share Analysis
10.18.4. Company Product Portfolio
10.18.5. Recent Developments
10.18.6. SWOT Analysis
10.19. Roquette Freres
10.19.1. Business Overview
10.19.2. Company Snapshot
10.19.3. Company Market Share Analysis
10.19.4. Company Product Portfolio
10.19.5. Recent Developments
10.19.6. SWOT Analysis
List of Table
1. Global Glucaric Acid Market, By Product, 2019-2030 (USD Million)
2. Global Calcium D-glucarate, Glucaric Acid Market, By Region, 2019-2030 (USD Million)
3. Global D-glucaric Acid-1,4-lactone, Glucaric Acid Market, By Region, 2019-2030 (USD Million)
4. Global Pure Glucaric Acid, Glucaric Acid Market, By Region, 2019-2030 (USD Million)
5. Global Potassium Sodium D-glucarate, Glucaric Acid Market, By Region, 2019-2030 (USD Million)
6. Global Others, Glucaric Acid Market, By Region, 2019-2030 (USD Million)
7. Global Glucaric Acid Market, By Application, 2019-2030 (USD Million)
8. Global Detergents, Glucaric Acid Market, By Region, 2019-2030 (USD Million)
9. Global De-icing Applications, Glucaric Acid Market, By Region, 2019-2030 (USD Million)
10. Global Food Ingredients, Glucaric Acid Market, By Region, 2019-2030 (USD Million)
11. Global Corrosion Inhibitors, Glucaric Acid Market, By Region, 2019-2030 (USD Million)
12. Global Others, Glucaric Acid Market, By Region, 2019-2030 (USD Million)
13. Global Glucaric Acid Market, By Region, 2019-2030 (USD Million)
14. North America Glucaric Acid Market, By Product, 2019-2030 (USD Million)
15. North America Glucaric Acid Market, By Application, 2019-2030 (USD Million)
16. U.S. Glucaric Acid Market, By Product, 2019-2030 (USD Million)
17. U.S. Glucaric Acid Market, By Application, 2019-2030 (USD Million)
18. Canada Glucaric Acid Market, By Product, 2019-2030 (USD Million)
19. Canada Glucaric Acid Market, By Application, 2019-2030 (USD Million)
20. Mexico Glucaric Acid Market, By Product, 2019-2030 (USD Million)
21. Mexico Glucaric Acid Market, By Application, 2019-2030 (USD Million)
22. Europe Glucaric Acid Market, By Product, 2019-2030 (USD Million)
23. Europe Glucaric Acid Market, By Application, 2019-2030 (USD Million)
24. Germany Glucaric Acid Market, By Product, 2019-2030 (USD Million)
25. Germany Glucaric Acid Market, By Application, 2019-2030 (USD Million)
26. France Glucaric Acid Market, By Product, 2019-2030 (USD Million)
27. France Glucaric Acid Market, By Application, 2019-2030 (USD Million)
28. U.K. Glucaric Acid Market, By Product, 2019-2030 (USD Million)
29. U.K. Glucaric Acid Market, By Application, 2019-2030 (USD Million)
30. Italy Glucaric Acid Market, By Product, 2019-2030 (USD Million)
31. Italy Glucaric Acid Market, By Application, 2019-2030 (USD Million)
32. Spain Glucaric Acid Market, By Product, 2019-2030 (USD Million)
33. Spain Glucaric Acid Market, By Application, 2019-2030 (USD Million)
34. Asia Pacific Glucaric Acid Market, By Product, 2019-2030 (USD Million)
35. Asia Pacific Glucaric Acid Market, By Application, 2019-2030 (USD Million)
36. Japan Glucaric Acid Market, By Product, 2019-2030 (USD Million)
37. Japan Glucaric Acid Market, By Application, 2019-2030 (USD Million)
38. China Glucaric Acid Market, By Product, 2019-2030 (USD Million)
39. China Glucaric Acid Market, By Application, 2019-2030 (USD Million)
40. India Glucaric Acid Market, By Product, 2019-2030 (USD Million)
41. India Glucaric Acid Market, By Application, 2019-2030 (USD Million)
42. South America Glucaric Acid Market, By Product, 2019-2030 (USD Million)
43. South America Glucaric Acid Market, By Application, 2019-2030 (USD Million)
44. Brazil Glucaric Acid Market, By Product, 2019-2030 (USD Million)
45. Brazil Glucaric Acid Market, By Application, 2019-2030 (USD Million)
46. Middle East and Africa Glucaric Acid Market, By Product, 2019-2030 (USD Million)
47. Middle East and Africa Glucaric Acid Market, By Application, 2019-2030 (USD Million)
48. UAE Glucaric Acid Market, By Product, 2019-2030 (USD Million)
49. UAE Glucaric Acid Market, By Application, 2019-2030 (USD Million)
50. South Africa Glucaric Acid Market, By Product, 2019-2030 (USD Million)
51. South Africa Glucaric Acid Market, By Application, 2019-2030 (USD Million)
List of Figures
1. Global Glucaric Acid Market Segmentation
2. Glucaric Acid Market: Research Methodology
3. Market Size Estimation Methodology: Bottom-Up Approach
4. Market Size Estimation Methodology: Top-Down Approach
5. Data Triangulation
6. Porter’s Five Forces Analysis
7. Value Chain Analysis
8. Global Glucaric Acid Market Attractiveness Analysis By Product
9. Global Glucaric Acid Market Attractiveness Analysis By Application
10. Global Glucaric Acid Market Attractiveness Analysis By Region
11. Global Glucaric Acid Market: Dynamics
12. Global Glucaric Acid Market Share by Product (2022 & 2030)
13. Global Glucaric Acid Market Share by Application (2022 & 2030)
14. Global Glucaric Acid Market Share by Regions (2022 & 2030)
15. Global Glucaric Acid Market Share by Company (2021)
This study forecasts revenue at global, regional, and country levels from 2019 to 2030. The Brainy Insights has segmented the global glucaric acid market based on below mentioned segments:
Global Glucaric Acid Market by Product:
Global Glucaric Acid Market by Application:
Global Glucaric Acid Market by Region:
Research has its special purpose to undertake marketing efficiently. In this competitive scenario, businesses need information across all industry verticals; the information about customer wants, market demand, competition, industry trends, distribution channels etc. This information needs to be updated regularly because businesses operate in a dynamic environment. Our organization, The Brainy Insights incorporates scientific and systematic research procedures in order to get proper market insights and industry analysis for overall business success. The analysis consists of studying the market from a miniscule level wherein we implement statistical tools which helps us in examining the data with accuracy and precision.
Our research reports feature both; quantitative and qualitative aspects for any market. Qualitative information for any market research process are fundamental because they reveal the customer needs and wants, usage and consumption for any product/service related to a specific industry. This in turn aids the marketers/investors in knowing certain perceptions of the customers. Qualitative research can enlighten about the different product concepts and designs along with unique service offering that in turn, helps define marketing problems and generate opportunities. On the other hand, quantitative research engages with the data collection process through interviews, e-mail interactions, surveys and pilot studies. Quantitative aspects for the market research are useful to validate the hypotheses generated during qualitative research method, explore empirical patterns in the data with the help of statistical tools, and finally make the market estimations.
The Brainy Insights offers comprehensive research and analysis, based on a wide assortment of factual insights gained through interviews with CXOs and global experts and secondary data from reliable sources. Our analysts and industry specialist assume vital roles in building up statistical tools and analysis models, which are used to analyse the data and arrive at accurate insights with exceedingly informative research discoveries. The data provided by our organization have proven precious to a diverse range of companies, facilitating them to address issues such as determining which products/services are the most appealing, whether or not customers use the product in the manner anticipated, the purchasing intentions of the market and many others.
Our research methodology encompasses an idyllic combination of primary and secondary initiatives. Key phases involved in this process are listed below:

The phase involves the gathering and collecting of market data and its related information with the help of different sources & research procedures.

The data procurement stage involves in data gathering and collecting through various data sources.
This stage involves in extensive research. These data sources includes:
Purchased Database: Purchased databases play a crucial role in estimating the market sizes irrespective of the domain. Our purchased database includes:
Primary Research: The Brainy Insights interacts with leading companies and experts of the concerned domain to develop the analyst team’s market understanding and expertise. It improves and substantiates every single data presented in the market reports. Primary research mainly involves in telephonic interviews, E-mail interactions and face-to-face interviews with the raw material providers, manufacturers/producers, distributors, & independent consultants. The interviews that we conduct provides valuable data on market size and industry growth trends prevailing in the market. Our organization also conducts surveys with the various industry experts in order to gain overall insights of the industry/market. For instance, in healthcare industry we conduct surveys with the pharmacists, doctors, surgeons and nurses in order to gain insights and key information of a medical product/device/equipment which the customers are going to usage. Surveys are conducted in the form of questionnaire designed by our own analyst team. Surveys plays an important role in primary research because surveys helps us to identify the key target audiences of the market. Additionally, surveys helps to identify the key target audience engaged with the market. Our survey team conducts the survey by targeting the key audience, thus gaining insights from them. Based on the perspectives of the customers, this information is utilized to formulate market strategies. Moreover, market surveys helps us to understand the current competitive situation of the industry. To be precise, our survey process typically involve with the 360 analysis of the market. This analytical process begins by identifying the prospective customers for a product or service related to the market/industry to obtain data on how a product/service could fit into customers’ lives.

Secondary Research: The secondary data sources includes information published by the on-profit organizations such as World bank, WHO, company fillings, investor presentations, annual reports, national government documents, statistical databases, blogs, articles, white papers and others. From the annual report, we analyse a company’s revenue to understand the key segment and market share of that organization in a particular region. We analyse the company websites and adopt the product mapping technique which is important for deriving the segment revenue. In the product mapping method, we select and categorize the products offered by the companies catering to domain specific market, deduce the product revenue for each of the companies so as to get overall estimation of the market size. We also source data and analyses trends based on information received from supply side and demand side intermediaries in the value chain. The supply side denotes the data gathered from supplier, distributor, wholesaler and the demand side illustrates the data gathered from the end customers for respective market domain.

The supply side for a domain specific market is analysed by:
The demand side for the market is estimated through:
In-house Library: Apart from these third-party sources, we have our in-house library of qualitative and quantitative information. Our in-house database includes market data for various industry and domains. These data are updated on regular basis as per the changing market scenario. Our library includes, historic databases, internal audit reports and archives.
Sometimes there are instances where there is no metadata or raw data available for any domain specific market. For those cases, we use our expertise to forecast and estimate the market size in order to generate comprehensive data sets. Our analyst team adopt a robust research technique in order to produce the estimates:
Data Synthesis: This stage involves the analysis & mapping of all the information obtained from the previous step. It also involves in scrutinizing the data for any discrepancy observed while data gathering related to the market. The data is collected with consideration to the heterogeneity of sources. Robust scientific techniques are in place for synthesizing disparate data sets and provide the essential contextual information that can orient market strategies. The Brainy Insights has extensive experience in data synthesis where the data passes through various stages:


Market Deduction & Formulation: The final stage comprises of assigning data points at appropriate market spaces so as to deduce feasible conclusions. Analyst perspective & subject matter expert based holistic form of market sizing coupled with industry analysis also plays a crucial role in this stage.
This stage involves in finalization of the market size and numbers that we have collected from data integration step. With data interpolation, it is made sure that there is no gap in the market data. Successful trend analysis is done by our analysts using extrapolation techniques, which provide the best possible forecasts for the market.
Data Validation & Market Feedback: Validation is the most important step in the process. Validation & re-validation via an intricately designed process helps us finalize data-points to be used for final calculations.

The Brainy Insights interacts with leading companies and experts of the concerned domain to develop the analyst team’s market understanding and expertise. It improves and substantiates every single data presented in the market reports. The data validation interview and discussion panels are typically composed of the most experienced industry members. The participants include, however, are not limited to:
Moreover, we always validate our data and findings through primary respondents from all the major regions we are working on.


Free Customization
Fortune 500 Clients
Free Yearly Update On Purchase Of Multi/Corporate License
Companies Served Till Date