- +1-315-215-1633
- sales@thebrainyinsights.com

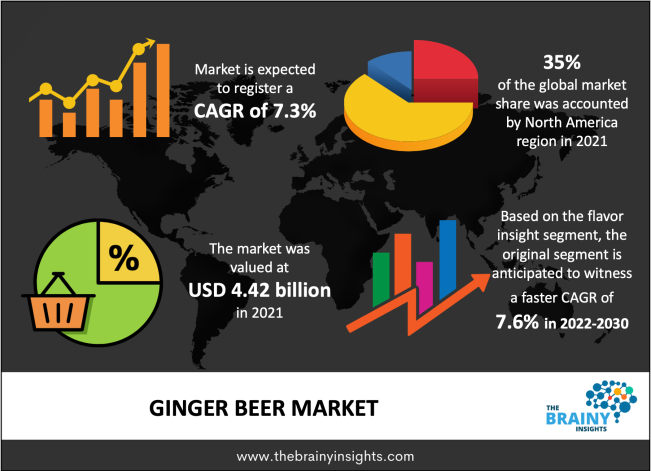
The ginger beer market size was valued at USD 4.42 billion in 2021 and is anticipated to grow at a CAGR of 7.3% from 2022 to 2030. The rising preference for no & low-alcoholic drinks is driving the demand among consumers. Ginger beer is made by fermentation of sugar, ginger, and water. It is usually a non-alcoholic beer, but alcoholic variants are also available in the market. Some of the key brands offering non-alcoholic ginger beer include James Squire, Amplys, Rusty Yak, and Stone. These players offer non-alcoholic versions of ginger beer with an ABV (alcohol by volume) content of 2%-5%.
The growing consumer preference for low-alcoholic drinks with claims such as organic, non-GMO, natural, no added sugar, gluten-free, and free from preservatives is anticipated to boost the market growth in coming years. The leading players in the market are offering products with such claims to fulfill consumer demand and requirements as per their dietary needs. For instance, John Barritt & Son Ltd offers gluten-free ginger beers as these are sweetened with cane sugar or high–fructose corn syrups. It also offers sugar-free ginger beers in both bottles and cans.
The increasing usage of ginger beer to make cocktails and mocktails is also expected to propel market growth. It is used as a mixer for a wide range of spirits including rum, vodka, gin, and whiskey. Cocktails such as Moscow Mule, Irish Mule, Ginger Rickey, and Margaritas are prepared from it. Further, the popularity of ginger beer among non-drinkers and the availability of it in various flavors such as pineapple, lemon, passionfruit, and lime is also likely to fuel the market.
Get an overview of this study by requesting a free sample
The sale of ginger beer was affected owing to the spread of Covid -19 pandemic. The closure of bars and clubs during the pandemic to control the spread of the virus negatively impacted the consumption of ginger through the on-trade channel. However, the demand through off-trade channels saw an upward trend as consumers opted for low & non-alcoholic drinks to stay healthy. Moreover, consumers were also experimenting with drinks and preparing their DIY cocktails & mocktails at home to kill boredom.
The alcoholic ginger beer is anticipated to register a higher CAGR of 8.2% during the forecast period. The growing trend of craft cocktails among millennials and Gen Z will drive the growth of this segment. In March 2022, Ampersand Projects introduced their low sugar & gluten-free alcoholic ginger beer, which is available at BWS and Dan Murphys. According to the company trends for old-flavors and healthy drinks is on the rise and are likely to stay for a longer period, which influenced them to launch a healthier version of alcoholic ginger beer.
The non-alcoholic ginger beer held a larger market share of more than 70% in 2021 and is expected to remain dominant in the forecasted years. The rising trend of healthy drinks is likely to accelerate the segment’s growth. The increasing product innovation and high demand for non-alcoholic ginger beer as a mixer is expected to boost the market. For instance, in May 2022 Spinifex Brewing Company launched a non-alcoholic ginger beer infused with Gubinge (Kakadu Plum) in Australia.
The original segment is anticipated to witness a faster CAGR of 7.6% from 2022-2030. The shifting trends toward aromatic flavors are expected to boost the segment’s growth. The consumption of original ginger beer is also increasing as ginger has antioxidant properties, thus, it helps in the prevention of heart diseases. Further, several studies suggest that ginger also helps control blood sugar levels. Some of the brands offering original ginger beer include Fentimans, Fever-Tree, Q Mixers, Reed’s, and Bundaberg.
The flavored ginger beer held a larger market share of more than 60% in 2021. The increasing consumer demand for flavorful healthy beverages is driving the growth of this segment. Flavors such as strawberry, lime, lemon, spicy pineapple, mango, and other aromatic flavors are popular in the ginger beer category. As ginger beer has a strong taste & flavor of ginger, consumers like to drink flavored ginger beer to mask the taste of ginger with some fruit. Moreover, the rising application of these drinks to create cocktails & mocktails is expected to increase their consumption in the coming years.
The off-trade distribution channel is expected to expand at a faster CAGR of 7.8% from 2022-2030. It includes supermarkets, hypermarkets, convenience stores, and online distribution channels. The rising popularity of ginger beer among consumers due to its health benefits is expected to drive sales through these channels. Rising consumer inclination to shop from online channels owing to the wide availability of brands and easy price comparisons is likely to propel the market growth.
Dun Murphys, Drizly, Big Basket, Amazon, and Instacart are some of the popular e-commerce platforms for purchasing ginger beer. Moreover, the rising popularity of the D2C channel is also expected to boost demand through off-trade distribution channels. For sentence, Gunsberg, an India-based company offers products including ginger beer through the D2C channel.
The on-trade distribution channel led the market accounting for a market share of more than 50% in 2021. The usage of ginger beer to prepare cocktails is likely to drive the market through on-trade distribution channels such as bars, clubs, and hotels. Further, as social gatherings are picking up steadily post the covid-19 outbreak, the demand for low-alcoholic drinks as well as cocktails is likely to increase. Such trends are expected to boost market growth.
North America led the market with a share of more than 35% in 2021. Ginger beer is a preferred drink in countries like the US and Canada. Further, health-conscious consumers are turning to healthy drinks with low or no alcohol. These trends are driving the market in this region. Moreover, the presence of a large number of brands both domestic & international along with product innovations & launches is expected to boost the demand further.
Moreover, strategic initiatives taken by companies are also likely to increase the demand for products. For instance, in February 2021, Reed’s Inc. partnered with Unique Foods Inc. to expand its presence in Canada. The partnerships increased the availability of Reed’s ginger beer in all flavors original & flavored.
The Asia Pacific region is expected to register the fastest growth rate during the forecast period owing to the rising adoption of western culture and increasing demand for non-alcoholic drinks among consumers. The expansion strategies of leading global players in the region are likely to provide new growth opportunities. For instance, in May 2021, Old Jamaica, the UK-based ginger beer brand in partnership with Beliv launched in China.
The key players in this market are engaged in product launches and partnerships for distribution and product innovation. The key companies are from the North American & European regions.
Segments Covered in the Report
1. Introduction
1.1. Objectives of the Study
1.2. Market Definition
1.3. Research Scope
1.4. Currency
1.5. Key Target Audience
2. Research Methodology and Assumptions
3. Executive Summary
4. Premium Insights
4.1. Porter’s Five Forces Analysis
4.2. Value Chain Analysis
4.3. Top Investment Pockets
4.3.1. Market Attractiveness Analysis by Type
4.3.2. Market Attractiveness Analysis by Flavor
4.3.3. Market Attractiveness Analysis by Distribution Channel
4.3.4. Market Attractiveness Analysis by Region
4.4. Industry Trends
5. Market Dynamics
5.1. Market Evaluation
5.2. Drivers
5.2.1. Rising preference for Non & low-alcoholic drinks
5.2.2. Increasing usage of ginger beer to make cocktails and mocktails
5.3. Restraints
5.3.1. Stringent regulations & Restrictions led by the government
5.4. Opportunities
5.4.1. Rise in awareness about the benefits of the ginger beer
5.4.2. Rise in disposable income
6. Global Ginger Beer Market Analysis and Forecast, By Type
6.1. Segment Overview
6.2. Non-Alcoholic
6.3. Alcoholic
7. Global Ginger Beer Market Analysis and Forecast, By Flavor
7.1. Segment Overview
7.2. Original
7.3. Flavored
8. Global Ginger Beer Market Analysis and Forecast, By Distribution Channel
8.1. Segment Overview
8.2. Off-Trade
8.3. On-Trade
9. Global Ginger Beer Market Analysis and Forecast, By Regional Analysis
9.1. Segment Overview
9.2. North America
9.2.1. U.S.
9.2.2. Canada
9.2.3. Mexico
9.3. Europe
9.3.1. Germany
9.3.2. France
9.3.3. U.K.
9.3.4. Italy
9.3.5. Spain
9.4. Asia-Pacific
9.4.1. Japan
9.4.2. China
9.4.3. India
9.5. South America
9.5.1. Brazil
9.6. Middle East and Africa
9.6.1. UAE
9.6.2. South Africa
10. Global Ginger Beer Market-Competitive Landscape
10.1. Overview
10.2. Market Share of Key Players in the Ginger Beer Market
10.2.1. Global Company Market Share
10.2.2. North America Company Market Share
10.2.3. Europe Company Market Share
10.2.4. APAC Company Market Share
10.3. Competitive Situations and Trends
10.3.1. Product Launches and Developments
10.3.2. Partnerships, Collaborations, and Agreements
10.3.3. Mergers & Acquisitions
10.3.4. Expansions
11. Company Profiles
11.1. Bundaberg Brewed Drinks
11.1.1. Business Overview
11.1.2. Company Snapshot
11.1.3. Company Market Share Analysis
11.1.4. Company Product Portfolio
11.1.5. Recent Developments
11.1.6. SWOT Analysis
11.2. Fever-Tree
11.2.1. Business Overview
11.2.2. Company Snapshot
11.2.3. Company Market Share Analysis
11.2.4. Company Product Portfolio
11.2.5. Recent Developments
11.2.6. SWOT Analysis
11.3. Fentimans
11.3.1. Business Overview
11.3.2. Company Snapshot
11.3.3. Company Market Share Analysis
11.3.4. Company Product Portfolio
11.3.5. Recent Developments
11.3.6. SWOT Analysis
11.4. Reeds inc.
11.4.1. Business Overview
11.4.2. Company Snapshot
11.4.3. Company Market Share Analysis
11.4.4. Company Product Portfolio
11.4.5. Recent Developments
11.4.6. SWOT Analysis
11.5. John Barritt & Son Ltd.
11.5.1. Business Overview
11.5.2. Company Snapshot
11.5.3. Company Market Share Analysis
11.5.4. Company Product Portfolio
11.5.5. Recent Developments
11.5.6. SWOT Analysis
11.6. Gunsberg
11.6.1. Business Overview
11.6.2. Company Snapshot
11.6.3. Company Market Share Analysis
11.6.4. Company Product Portfolio
11.6.5. Recent Developments
11.6.6. SWOT Analysis
11.7. Q Mixers
11.7.1. Business Overview
11.7.2. Company Snapshot
11.7.3. Company Market Share Analysis
11.7.4. Company Product Portfolio
11.7.5. Recent Developments
11.7.6. SWOT Analysis
11.8. Natrona Bottling Company
11.8.1. Business Overview
11.8.2. Company Snapshot
11.8.3. Company Market Share Analysis
11.8.4. Company Product Portfolio
11.8.5. Recent Developments
11.8.6. SWOT Analysis
11.9. Tribe Breweries
11.9.1. Business Overview
11.9.2. Company Snapshot
11.9.3. Company Market Share Analysis
11.9.4. Company Product Portfolio
11.9.5. Recent Developments
11.9.6. SWOT Analysis
11.10. Better Beer
11.10.1. Business Overview
11.10.2. Company Snapshot
11.10.3. Company Market Share Analysis
11.10.4. Company Product Portfolio
11.10.5. Recent Developments
11.10.6. SWOT Analysis
List of Table
1. Global Ginger Beer Market, By Type, 2019-2030 (USD Billion)
2. Global Non-Alcoholic Ginger Beer Market, By Region, 2019-2030 (USD Billion)
3. Global Alcoholic Ginger Beer Market, By Region, 2019-2030 (USD Billion)
4. Global Ginger Beer Market, By Flavor, 2019-2030 (USD Billion)
5. Global Original Ginger Beer Market, By Region, 2019-2030 (USD Billion)
6. Global Flavored Ginger Beer Market, By Region, 2019-2030 (USD Billion)
7. Global Ginger Beer Market, By Distribution Channel, 2019-2030 (USD Billion)
8. Global Off-Trade Ginger Beer Market, By Region, 2019-2030 (USD Billion)
9. Global On-Trade Ginger Beer Market, By Region, 2019-2030 (USD Billion)
10. Global Ginger Beer Market, By Region, 2019-2030 (USD Billion)
11. North America Ginger Beer Market, By Type, 2019-2030 (USD Billion)
12. North America Ginger Beer Market, By Flavor, 2019-2030 (USD Billion)
13. North America Ginger Beer Market, By Distribution Channel, 2019-2030 (USD Billion)
14. U.S. Ginger Beer Market, By Type, 2019-2030 (USD Billion)
15. U.S. Ginger Beer Market, By Flavor, 2019-2030 (USD Billion)
16. U.S. Ginger Beer Market, By Distribution Channel, 2019-2030 (USD Billion)
17. Canada Ginger Beer Market, By Type, 2019-2030 (USD Billion)
18. Canada Ginger Beer Market, By Flavor, 2019-2030 (USD Billion)
19. Canada Ginger Beer Market, By Distribution Channel, 2019-2030 (USD Billion)
20. Mexico Ginger Beer Market, By Type, 2019-2030 (USD Billion)
21. Mexico Ginger Beer Market, By Flavor, 2019-2030 (USD Billion)
22. Mexico Ginger Beer Market, By Distribution Channel, 2019-2030 (USD Billion)
23. Europe Ginger Beer Market, By Type, 2019-2030 (USD Billion)
24. Europe Ginger Beer Market, By Flavor, 2019-2030 (USD Billion)
25. Europe Ginger Beer Market, By Distribution Channel, 2019-2030 (USD Billion)
26. Germany Ginger Beer Market, By Type, 2019-2030 (USD Billion)
27. Germany Ginger Beer Market, By Flavor, 2019-2030 (USD Billion)
28. Germany Ginger Beer Market, By Distribution Channel, 2019-2030 (USD Billion)
29. France Ginger Beer Market, By Type, 2019-2030 (USD Billion)
30. France Ginger Beer Market, By Flavor, 2019-2030 (USD Billion)
31. France Ginger Beer Market, By Distribution Channel, 2019-2030 (USD Billion)
32. U.K. Ginger Beer Market, By Type, 2019-2030 (USD Billion)
33. U.K. Ginger Beer Market, By Flavor, 2019-2030 (USD Billion)
34. U.K. Ginger Beer Market, By Distribution Channel, 2019-2030 (USD Billion)
35. Italy Ginger Beer Market, By Type, 2019-2030 (USD Billion)
36. Italy Ginger Beer Market, By Flavor, 2019-2030 (USD Billion)
37. Italy Ginger Beer Market, By Distribution Channel, 2019-2030 (USD Billion)
38. Spain Ginger Beer Market, By Type, 2019-2030 (USD Billion)
39. Spain Ginger Beer Market, By Flavor, 2019-2030 (USD Billion)
40. Spain Ginger Beer Market, By Distribution Channel, 2019-2030 (USD Billion)
41. Asia Pacific Ginger Beer Market, By Type, 2019-2030 (USD Billion)
42. Asia Pacific Ginger Beer Market, By Flavor, 2019-2030 (USD Billion)
43. Asia Pacific Ginger Beer Market, By Distribution Channel, 2019-2030 (USD Billion)
44. Japan Ginger Beer Market, By Type, 2019-2030 (USD Billion)
45. Japan Ginger Beer Market, By Flavor, 2019-2030 (USD Billion)
46. Japan Ginger Beer Market, By Distribution Channel, 2019-2030 (USD Billion)
47. China Ginger Beer Market, By Type, 2019-2030 (USD Billion)
48. China Ginger Beer Market, By Flavor, 2019-2030 (USD Billion)
49. China Ginger Beer Market, By Distribution Channel, 2019-2030 (USD Billion)
50. India Ginger Beer Market, By Type, 2019-2030 (USD Billion)
51. India Ginger Beer Market, By Flavor, 2019-2030 (USD Billion)
52. India Ginger Beer Market, By Distribution Channel, 2019-2030 (USD Billion)
53. South America Ginger Beer Market, By Type, 2019-2030 (USD Billion)
54. South America Ginger Beer Market, By Flavor, 2019-2030 (USD Billion)
55. South America Ginger Beer Market, By Distribution Channel, 2019-2030 (USD Billion)
56. Brazil Ginger Beer Market, By Type, 2019-2030 (USD Billion)
57. Brazil Ginger Beer Market, By Flavor, 2019-2030 (USD Billion)
58. Brazil Ginger Beer Market, By Distribution Channel, 2019-2030 (USD Billion)
59. Middle East and Africa Ginger Beer Market, By Type, 2019-2030 (USD Billion)
60. Middle East and Africa Ginger Beer Market, By Flavor, 2019-2030 (USD Billion)
61. Middle East and Africa Ginger Beer Market, By Distribution Channel, 2019-2030 (USD Billion)
62. UAE Ginger Beer Market, By Type, 2019-2030 (USD Billion)
63. UAE Ginger Beer Market, By Flavor, 2019-2030 (USD Billion)
64. UAE Ginger Beer Market, By Distribution Channel, 2019-2030 (USD Billion)
65. South Africa Ginger Beer Market, By Type, 2019-2030 (USD Billion)
66. South Africa Ginger Beer Market, By Flavor, 2019-2030 (USD Billion)
67. South Africa Ginger Beer Market, By Distribution Channel, 2019-2030 (USD Billion)
List of Figures
1. Global Ginger Beer Market Segmentation
2. Ginger Beer Market: Research Methodology
3. Market Size Estimation Methodology: Bottom-Up Approach
4. Market Size Estimation Methodology: Top-Down Approach
5. Data Triangulation
6. Porter’s Five Forces Analysis
7. Value Chain Analysis
8. Global Ginger Beer Market Attractiveness Analysis by Type
9. Global Ginger Beer Market Attractiveness Analysis by Flavor
10. Global Ginger Beer Market Attractiveness Analysis by Distribution Channel
11. Global Ginger Beer Market Attractiveness Analysis by Region
12. Global Ginger Beer Market: Dynamics
13. Global Ginger Beer Market Share by Type (2022 & 2030)
14. Global Ginger Beer Market Share by Flavor (2022 & 2030)
15. Global Ginger Beer Market Share by Distribution Channel (2022 & 2030)
16. Global Ginger Beer Market Share by Regions (2022 & 2030)
17. Global Ginger Beer Market Share by Company (2021)
Segments Covered in the Report
Research has its special purpose to undertake marketing efficiently. In this competitive scenario, businesses need information across all industry verticals; the information about customer wants, market demand, competition, industry trends, distribution channels etc. This information needs to be updated regularly because businesses operate in a dynamic environment. Our organization, The Brainy Insights incorporates scientific and systematic research procedures in order to get proper market insights and industry analysis for overall business success. The analysis consists of studying the market from a miniscule level wherein we implement statistical tools which helps us in examining the data with accuracy and precision.
Our research reports feature both; quantitative and qualitative aspects for any market. Qualitative information for any market research process are fundamental because they reveal the customer needs and wants, usage and consumption for any product/service related to a specific industry. This in turn aids the marketers/investors in knowing certain perceptions of the customers. Qualitative research can enlighten about the different product concepts and designs along with unique service offering that in turn, helps define marketing problems and generate opportunities. On the other hand, quantitative research engages with the data collection process through interviews, e-mail interactions, surveys and pilot studies. Quantitative aspects for the market research are useful to validate the hypotheses generated during qualitative research method, explore empirical patterns in the data with the help of statistical tools, and finally make the market estimations.
The Brainy Insights offers comprehensive research and analysis, based on a wide assortment of factual insights gained through interviews with CXOs and global experts and secondary data from reliable sources. Our analysts and industry specialist assume vital roles in building up statistical tools and analysis models, which are used to analyse the data and arrive at accurate insights with exceedingly informative research discoveries. The data provided by our organization have proven precious to a diverse range of companies, facilitating them to address issues such as determining which products/services are the most appealing, whether or not customers use the product in the manner anticipated, the purchasing intentions of the market and many others.
Our research methodology encompasses an idyllic combination of primary and secondary initiatives. Key phases involved in this process are listed below:

The phase involves the gathering and collecting of market data and its related information with the help of different sources & research procedures.

The data procurement stage involves in data gathering and collecting through various data sources.
This stage involves in extensive research. These data sources includes:
Purchased Database: Purchased databases play a crucial role in estimating the market sizes irrespective of the domain. Our purchased database includes:
Primary Research: The Brainy Insights interacts with leading companies and experts of the concerned domain to develop the analyst team’s market understanding and expertise. It improves and substantiates every single data presented in the market reports. Primary research mainly involves in telephonic interviews, E-mail interactions and face-to-face interviews with the raw material providers, manufacturers/producers, distributors, & independent consultants. The interviews that we conduct provides valuable data on market size and industry growth trends prevailing in the market. Our organization also conducts surveys with the various industry experts in order to gain overall insights of the industry/market. For instance, in healthcare industry we conduct surveys with the pharmacists, doctors, surgeons and nurses in order to gain insights and key information of a medical product/device/equipment which the customers are going to usage. Surveys are conducted in the form of questionnaire designed by our own analyst team. Surveys plays an important role in primary research because surveys helps us to identify the key target audiences of the market. Additionally, surveys helps to identify the key target audience engaged with the market. Our survey team conducts the survey by targeting the key audience, thus gaining insights from them. Based on the perspectives of the customers, this information is utilized to formulate market strategies. Moreover, market surveys helps us to understand the current competitive situation of the industry. To be precise, our survey process typically involve with the 360 analysis of the market. This analytical process begins by identifying the prospective customers for a product or service related to the market/industry to obtain data on how a product/service could fit into customers’ lives.

Secondary Research: The secondary data sources includes information published by the on-profit organizations such as World bank, WHO, company fillings, investor presentations, annual reports, national government documents, statistical databases, blogs, articles, white papers and others. From the annual report, we analyse a company’s revenue to understand the key segment and market share of that organization in a particular region. We analyse the company websites and adopt the product mapping technique which is important for deriving the segment revenue. In the product mapping method, we select and categorize the products offered by the companies catering to domain specific market, deduce the product revenue for each of the companies so as to get overall estimation of the market size. We also source data and analyses trends based on information received from supply side and demand side intermediaries in the value chain. The supply side denotes the data gathered from supplier, distributor, wholesaler and the demand side illustrates the data gathered from the end customers for respective market domain.

The supply side for a domain specific market is analysed by:
The demand side for the market is estimated through:
In-house Library: Apart from these third-party sources, we have our in-house library of qualitative and quantitative information. Our in-house database includes market data for various industry and domains. These data are updated on regular basis as per the changing market scenario. Our library includes, historic databases, internal audit reports and archives.
Sometimes there are instances where there is no metadata or raw data available for any domain specific market. For those cases, we use our expertise to forecast and estimate the market size in order to generate comprehensive data sets. Our analyst team adopt a robust research technique in order to produce the estimates:
Data Synthesis: This stage involves the analysis & mapping of all the information obtained from the previous step. It also involves in scrutinizing the data for any discrepancy observed while data gathering related to the market. The data is collected with consideration to the heterogeneity of sources. Robust scientific techniques are in place for synthesizing disparate data sets and provide the essential contextual information that can orient market strategies. The Brainy Insights has extensive experience in data synthesis where the data passes through various stages:


Market Deduction & Formulation: The final stage comprises of assigning data points at appropriate market spaces so as to deduce feasible conclusions. Analyst perspective & subject matter expert based holistic form of market sizing coupled with industry analysis also plays a crucial role in this stage.
This stage involves in finalization of the market size and numbers that we have collected from data integration step. With data interpolation, it is made sure that there is no gap in the market data. Successful trend analysis is done by our analysts using extrapolation techniques, which provide the best possible forecasts for the market.
Data Validation & Market Feedback: Validation is the most important step in the process. Validation & re-validation via an intricately designed process helps us finalize data-points to be used for final calculations.

The Brainy Insights interacts with leading companies and experts of the concerned domain to develop the analyst team’s market understanding and expertise. It improves and substantiates every single data presented in the market reports. The data validation interview and discussion panels are typically composed of the most experienced industry members. The participants include, however, are not limited to:
Moreover, we always validate our data and findings through primary respondents from all the major regions we are working on.


Free Customization
Fortune 500 Clients
Free Yearly Update On Purchase Of Multi/Corporate License
Companies Served Till Date