- +1-315-215-1633
- sales@thebrainyinsights.com

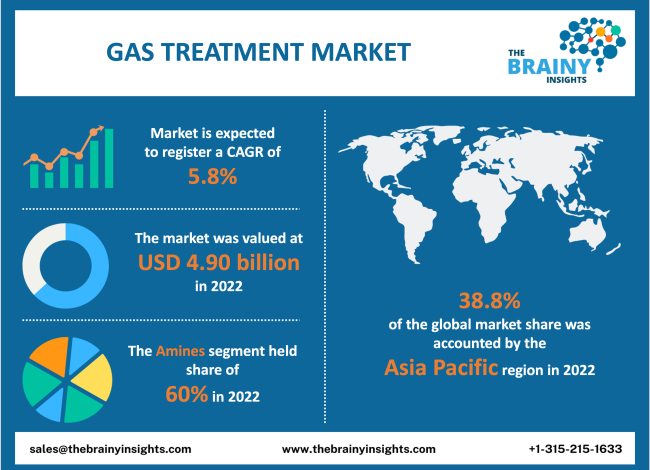
The global gas treatment market was valued at USD 4.90 billion in 2022 and is anticipated to growing at a CAGR of 5.8% from 2023 to 2032. The global gas treatment market is expected to reach USD 8.61 billion by 2032. North America is expected to grow the fastest during the forecast period.
Gas treatment is the process of removing harmful compounds from gas to enhance its quality. To eliminate dangerous components like carbon, varnish, and other pollutants, the gas treatment adds cleaning agents to the gas. Gas treatment may involve amphetamines or non-amines. Dehydration and the elimination of acid gases are two uses for gas treatment. A process called gas treatment, commonly referred to as gas conditioning, uses amine solutions to absorb unwelcome acid gases present in the atmosphere, such as carbon dioxide and hydrogen sulfide. The gas treatment application removes carbon dioxide and hydrogen sulfide gases from crude oil and natural gas watercourses during the refining process. The justification for gas treatment will be strengthened by the rising demand for natural gas in many regions worldwide. Urbanization and economic growth are causing an increase in the need for power, which makes natural gas a more attractive fuel option due to its minimal environmental impact and ease of supply to satisfy the growing demand.
Get an overview of this study by requesting a free sample
Increasing need to reduce environmental pollution- The gas treatment market is anticipated to grow over the forecast period due to driving factors, including strict regulations for minimizing air pollution and rising natural gas demand. As natural gas is used more frequently as an energy source in many applications and industries, there is an increasing need for gas treatment. Removing carbon dioxide and hydrogen sulfide complies with environmental requirements and can be used as a clean energy source. The sector expands with little adverse influence on the environment thanks to the increasing demand for natural gas. As a market driver, industrial filters and electrostatic precipitators are growing in popularity. Additionally, the increased rigor of air pollution control laws increases market participants' sales and profits.
Risk of Health-related Issues- The gas treatment improves the performance of liquefied petroleum gas by removing sour gases. On the other hand, natural gas has a high proportion of hydrogen sulfide and emits carbon dioxide, both of which are unhealthy. Other symptoms of carbon dioxide include headaches, vertigo, and trembling. Its high concentration (>100000 ppm) might result in unconsciousness, convulsions, and other health issues. In addition to being extraordinarily explosive and deadly, hydrogen sulfide irritates the eyes, nose, and throat. Processing may be lowered due to various health effects, which can lessen the requirement for gas treatment.
Growing need for Renewable Energy- The U.S. Energy Information Administration projects that natural gas output will increase to 384.9 billion cubic meters (bcm), or more than half of the nation's total production (EIA). As a result, the electrical industry uses around 38% of all the natural gas consumed in the United States. Additionally, according to data from the India Brand Equity Foundation (IBEF), India generated 127.01 billion renewable power units in FY20. The Indian government, therefore, intends to produce 523 GW of renewable energy capacity by 2030. India intends to spend $500 billion on alternative energy sources by 2028. As a result, increasing the power generation scenario is anticipated to require gas treatment.
High Cost- The high cost of specialized raw materials for gas extraction is the main challenge for the market. Additionally, several challenges related to the gas extraction process will challenge market expansion during the forecast period.
The regions analyzed for the market include North America, Europe, South America, Asia Pacific, the Middle East, and Africa. Asia Pacific emerged as the largest global gas treatment market, with a 38.8% share of the market revenue in 2022.
Asia Pacific currently dominates the gas treatment market. The market is backed by a sizable industrial base in the area and rising gas treatment demand from the oil and gas sector. Additionally, the market is anticipated to grow due to various initiatives by governments of different countries to attract investments from numerous multinational businesses over the forecast period. The two main economic forces in the area are China and India. Over the forecast period, the gas treatment market is anticipated to grow due to the expansion of industries, expanding global population, rapid urbanization, easy access to low-cost labor, and low prices for raw materials. The increase in coal-fired power plants in China and India is driving the industry in the region.
The North American market is expected to rise in the forecast period. Because, particularly in the United States and Canada, industrial filters and electrostatic precipitators are increasing. Due to its easy and sophisticated production of electronic devices with high-quality materials and its expanding government initiatives for gas treatment in the region.
Asia Pacific Region Gas Treatment Market Share in 2022 - 38.8%
www.thebrainyinsights.com
Check the geographical analysis of this market by requesting a free sample
The type segment is divided into non-amines and amines. The amines segment dominated the market, with a market share of around 60% in 2022. Because major end-use industries are increasingly requesting acid gas treatment. The gas (typically natural gas) is treated to help eliminate carbon dioxide and hydrogen sulfide, improving its quality and making it safe for consumption and transit. Additionally, amines are more affordable than other gas treatments, and amine systems are simple to integrate with other technologies to create hybrid systems for various projects. These elements are anticipated to support market expansion during the forecast period.
The application segment is divided into refineries, sugar, metal & mining, power plants, oil & gas, pulp & paper, acid gas removal, and food & beverages. Over the forecast period, the acid gas segment is expected to grow at the fastest CAGR of 6.4%. The gas treatment stops the emissions of carbon dioxide and hydrogen sulfide from the gas mixture and crude oil during the refining process. Amines are the most used gas treatment chemicals for acid gas removal (AGR) activities. Acid gas removal uses amines as hydrogen donors. It involves the transfer of a proton to produce ammonia or amine species that serve as intermediates in various reactions with hydrocarbon molecules found in the acidic plant feedstock. The most popular acid gas removal applications include flaring and processing waste gases from petrochemical plants, natural gas processing units, refineries, oil & gas producing facilities, and other facilities.
| Attribute | Description |
|---|---|
| Market Size | Revenue (USD Billion) |
| Market size value in 2022 | USD 4.90 billion |
| Market size value in 2032 | USD 8.61 billion |
| CAGR (2023 to 2032) | 5.8% |
| Historical data | 2019-2021 |
| Base Year | 2022 |
| Forecast | 2023-2032 |
| Regional Segments | North America, Asia Pacific, Europe, Latin America, Middle East and Africa |
| Segments | Type, Application |
As per The Brainy Insights, the size of the gas treatment market was valued at USD 4.90 billion in 2022 to USD 8.61 billion by 2032.
The global gas treatment market is growing at a CAGR of 5.8% during the forecast period 2023-2032.
Asia Pacific emerged as the largest market for gas treatment.
Key players in the gas treatment market are BASF SE, Huntsman International LLC, Ecolab Inc., Berryman Chemical Inc., Clariant International Ltd., DuPont, SAMSON CONTROLS INC, Amines & Plasticizers Ltd, and Eunisell Chemicals.
1. Introduction
1.1. Objectives of the Study
1.2. Market Definition
1.3. Research Scope
1.4. Currency
1.5. Key Target Audience
2. Research Methodology and Assumptions
3. Executive Summary
4. Premium Insights
4.1. Porter’s Five Forces Analysis
4.2. Value Chain Analysis
4.3. Top Investment Pockets
4.3.1. Market Attractiveness Analysis By Type
4.3.2. Market Attractiveness Analysis By Application
4.3.3. Market Attractiveness Analysis By Region
4.4. Industry Trends
5. Market Dynamics
5.1. Market Evaluation
5.2. Drivers
5.2.1. The increasing need to reduce environmental pollution
5.3. Restraints
5.3.1. Risk of health-related issues
5.4. Opportunities
5.4.1. Growing need for renewable energy
5.5. Challenges
5.5.1. High cost
6. Global Gas Treatment Market Analysis and Forecast, By Type
6.1. Segment Overview
6.2. Non-Amines
6.3. Amines
7. Global Gas Treatment Market Analysis and Forecast, By Application
7.1. Segment Overview
7.2. Refineries
7.3. Sugar
7.4. Metal & Mining
7.5. Power Plants
7.6. Oil & Gas
7.7. Pulp & Paper
7.8. Acid Gas Removal
7.9. Food & Beverages
8. Global Gas Treatment Market Analysis and Forecast, By Regional Analysis
8.1. Segment Overview
8.2. North America
8.2.1. U.S.
8.2.2. Canada
8.2.3. Mexico
8.3. Europe
8.3.1. Germany
8.3.2. France
8.3.3. U.K.
8.3.4. Italy
8.3.5. Spain
8.4. Asia-Pacific
8.4.1. Japan
8.4.2. China
8.4.3. India
8.5. South America
8.5.1. Brazil
8.6. Middle East and Africa
8.6.1. UAE
8.6.2. South Africa
9. Global Gas Treatment Market-Competitive Landscape
9.1. Overview
9.2. Market Share of Key Players in Global Gas Treatment Market
9.2.1. Global Company Market Share
9.2.2. North America Company Market Share
9.2.3. Europe Company Market Share
9.2.4. APAC Company Market Share
9.3. Competitive Situations and Trends
9.3.1. Product Launches and Developments
9.3.2. Partnerships, Collaborations, and Agreements
9.3.3. Mergers & Acquisitions
9.3.4. Expansions
10. Company Profiles
10.1. BASF SE
10.1.1. Business Overview
10.1.2. Company Snapshot
10.1.3. Company Market Share Analysis
10.1.4. Company Product Portfolio
10.1.5. Recent Developments
10.1.6. SWOT Analysis
10.2. Huntsman International LLC
10.2.1. Business Overview
10.2.2. Company Snapshot
10.2.3. Company Market Share Analysis
10.2.4. Company Product Portfolio
10.2.5. Recent Developments
10.2.6. SWOT Analysis
10.3. Ecolab Inc.
10.3.1. Business Overview
10.3.2. Company Snapshot
10.3.3. Company Market Share Analysis
10.3.4. Company Product Portfolio
10.3.5. Recent Developments
10.3.6. SWOT Analysis
10.4. DuPont
10.4.1. Business Overview
10.4.2. Company Snapshot
10.4.3. Company Market Share Analysis
10.4.4. Company Product Portfolio
10.4.5. Recent Developments
10.4.6. SWOT Analysis
10.5. Berryman Chemical Inc.
10.5.1. Business Overview
10.5.2. Company Snapshot
10.5.3. Company Market Share Analysis
10.5.4. Company Product Portfolio
10.5.5. Recent Developments
10.5.6. SWOT Analysis
10.6. Clariant International Ltd.
10.6.1. Business Overview
10.6.2. Company Snapshot
10.6.3. Company Market Share Analysis
10.6.4. Company Product Portfolio
10.6.5. Recent Developments
10.6.6. SWOT Analysis
10.7. SAMSON CONTROLS INC
10.7.1. Business Overview
10.7.2. Company Snapshot
10.7.3. Company Market Share Analysis
10.7.4. Company Product Portfolio
10.7.5. Recent Developments
10.7.6. SWOT Analysis
10.8. Amines & Plasticizers Ltd
10.8.1. Business Overview
10.8.2. Company Snapshot
10.8.3. Company Market Share Analysis
10.8.4. Company Product Portfolio
10.8.5. Recent Developments
10.8.6. SWOT Analysis
10.9. Eunisell Chemicals
10.9.1. Business Overview
10.9.2. Company Snapshot
10.9.3. Company Market Share Analysis
10.9.4. Company Product Portfolio
10.9.5. Recent Developments
10.9.6. SWOT Analysis
List of Table
1. Global Gas Treatment Market, Type, 2019-2032 (USD Billion)
2. Global Non-Amines, Gas Treatment Market, By Region, 2019-2032 (USD Billion)
3. Global Amines, Gas Treatment Market, By Region, 2019-2032 (USD Billion)
4. Global Gas Treatment Market, By Application, 2019-2032 (USD Billion)
5. Global Refineries, Gas Treatment Market, By Region, 2019-2032 (USD Billion)
6. Global Sugar, Gas Treatment Market, By Region, 2019-2032 (USD Billion)
7. Global Metal & Mining, Gas Treatment Market, By Region, 2019-2032 (USD Billion)
8. Global Power Plants, Gas Treatment Market, By Region, 2019-2032 (USD Billion)
9. Global Oil & Gas, Gas Treatment Market, By Region, 2019-2032 (USD Billion)
10. Global Pulp & Paper, Gas Treatment Market, By Region, 2019-2032 (USD Billion)
11. Global Acid Gas Removal, Gas Treatment Market, By Region, 2019-2032 (USD Billion)
12. Global Food & Beverages, Gas Treatment Market, By Region, 2019-2032 (USD Billion)
13. North America Gas Treatment Market, Type, 2019-2032 (USD Billion)
14. North America Gas Treatment Market, By Application, 2019-2032 (USD Billion)
15. U.S. Gas Treatment Market, Type, 2019-2032 (USD Billion)
16. U.S. Gas Treatment Market, By Application, 2019-2032 (USD Billion)
17. Canada Gas Treatment Market, Type, 2019-2032 (USD Billion)
18. Canada Gas Treatment Market, By Application, 2019-2032 (USD Billion)
19. Mexico Gas Treatment Market, Type, 2019-2032 (USD Billion)
20. Mexico Gas Treatment Market, By Application, 2019-2032 (USD Billion)
21. Europe Gas Treatment Market, Type, 2019-2032 (USD Billion)
22. Europe Gas Treatment Market, By Application, 2019-2032 (USD Billion)
23. Germany Gas Treatment Market, Type, 2019-2032 (USD Billion)
24. Germany Gas Treatment Market, By Application, 2019-2032 (USD Billion)
25. France Gas Treatment Market, Type, 2019-2032 (USD Billion)
26. France Gas Treatment Market, By Application, 2019-2032 (USD Billion)
27. U.K. Gas Treatment Market, Type, 2019-2032 (USD Billion)
28. U.K. Gas Treatment Market, By Application, 2019-2032 (USD Billion)
29. Italy Gas Treatment Market, Type, 2019-2032 (USD Billion)
30. Italy Gas Treatment Market, By Application, 2019-2032 (USD Billion)
31. Spain Gas Treatment Market, Type, 2019-2032 (USD Billion)
32. Spain Gas Treatment Market, By Application, 2019-2032 (USD Billion)
33. Asia Pacific Gas Treatment Market, Type, 2019-2032 (USD Billion)
34. Asia Pacific Gas Treatment Market, By Application, 2019-2032 (USD Billion)
35. Japan Gas Treatment Market, Type, 2019-2032 (USD Billion)
36. Japan Gas Treatment Market, By Application, 2019-2032 (USD Billion)
37. China Gas Treatment Market, Type, 2019-2032 (USD Billion)
38. China Gas Treatment Market, By Application, 2019-2032 (USD Billion)
39. India Gas Treatment Market, Type, 2019-2032 (USD Billion)
40. India Gas Treatment Market, By Application, 2019-2032 (USD Billion)
41. South America Gas Treatment Market, Type, 2019-2032 (USD Billion)
42. South America Gas Treatment Market, By Application, 2019-2032 (USD Billion)
43. Brazil Gas Treatment Market, Type, 2019-2032 (USD Billion)
44. Brazil Gas Treatment Market, By Application, 2019-2032 (USD Billion)
45. Middle East and Africa Gas Treatment Market, Type, 2019-2032 (USD Billion)
46. Middle East and Africa Gas Treatment Market, By Application, 2019-2032 (USD Billion)
47. UAE Gas Treatment Market, Type, 2019-2032 (USD Billion)
48. UAE Gas Treatment Market, By Application, 2019-2032 (USD Billion)
49. South Africa Gas Treatment Market, Type, 2019-2032 (USD Billion)
50. South Africa Gas Treatment Market, By Application, 2019-2032 (USD Billion)
List of Figures
1. Global Gas Treatment Market Segmentation
2. Global Gas Treatment Market: Research Methodology
3. Market Size Estimation Methodology: Bottom-Up Approach
4. Market Size Estimation Methodology: Top-Down Approach
5. Data Triangulation
6. Porter’s Five Forces Analysis
7. Value Chain Analysis
8. Global Gas Treatment Market Attractiveness Analysis Type
9. Global Gas Treatment Market Attractiveness Analysis By Application
10. Global Gas Treatment Market Attractiveness Analysis By Region
11. Global Gas Treatment Market: Dynamics
12. Global Gas Treatment Market Share Type (2023 & 2032)
13. Global Gas Treatment Market Share By Application (2023 & 2032)
14. Global Gas Treatment Market Share By Regions (2023 & 2032)
15. Global Gas Treatment Market Share By Company (2022)
This study forecasts global, regional, and country revenue from 2019 to 2032. Brainy Insights has segmented the global gas treatment market based on the below-mentioned segments:
Global Gas Treatment Market by Type:
Global Gas Treatment Market by Application:
Global Gas Treatment Market by Region:
Research has its special purpose to undertake marketing efficiently. In this competitive scenario, businesses need information across all industry verticals; the information about customer wants, market demand, competition, industry trends, distribution channels etc. This information needs to be updated regularly because businesses operate in a dynamic environment. Our organization, The Brainy Insights incorporates scientific and systematic research procedures in order to get proper market insights and industry analysis for overall business success. The analysis consists of studying the market from a miniscule level wherein we implement statistical tools which helps us in examining the data with accuracy and precision.
Our research reports feature both; quantitative and qualitative aspects for any market. Qualitative information for any market research process are fundamental because they reveal the customer needs and wants, usage and consumption for any product/service related to a specific industry. This in turn aids the marketers/investors in knowing certain perceptions of the customers. Qualitative research can enlighten about the different product concepts and designs along with unique service offering that in turn, helps define marketing problems and generate opportunities. On the other hand, quantitative research engages with the data collection process through interviews, e-mail interactions, surveys and pilot studies. Quantitative aspects for the market research are useful to validate the hypotheses generated during qualitative research method, explore empirical patterns in the data with the help of statistical tools, and finally make the market estimations.
The Brainy Insights offers comprehensive research and analysis, based on a wide assortment of factual insights gained through interviews with CXOs and global experts and secondary data from reliable sources. Our analysts and industry specialist assume vital roles in building up statistical tools and analysis models, which are used to analyse the data and arrive at accurate insights with exceedingly informative research discoveries. The data provided by our organization have proven precious to a diverse range of companies, facilitating them to address issues such as determining which products/services are the most appealing, whether or not customers use the product in the manner anticipated, the purchasing intentions of the market and many others.
Our research methodology encompasses an idyllic combination of primary and secondary initiatives. Key phases involved in this process are listed below:

The phase involves the gathering and collecting of market data and its related information with the help of different sources & research procedures.

The data procurement stage involves in data gathering and collecting through various data sources.
This stage involves in extensive research. These data sources includes:
Purchased Database: Purchased databases play a crucial role in estimating the market sizes irrespective of the domain. Our purchased database includes:
Primary Research: The Brainy Insights interacts with leading companies and experts of the concerned domain to develop the analyst team’s market understanding and expertise. It improves and substantiates every single data presented in the market reports. Primary research mainly involves in telephonic interviews, E-mail interactions and face-to-face interviews with the raw material providers, manufacturers/producers, distributors, & independent consultants. The interviews that we conduct provides valuable data on market size and industry growth trends prevailing in the market. Our organization also conducts surveys with the various industry experts in order to gain overall insights of the industry/market. For instance, in healthcare industry we conduct surveys with the pharmacists, doctors, surgeons and nurses in order to gain insights and key information of a medical product/device/equipment which the customers are going to usage. Surveys are conducted in the form of questionnaire designed by our own analyst team. Surveys plays an important role in primary research because surveys helps us to identify the key target audiences of the market. Additionally, surveys helps to identify the key target audience engaged with the market. Our survey team conducts the survey by targeting the key audience, thus gaining insights from them. Based on the perspectives of the customers, this information is utilized to formulate market strategies. Moreover, market surveys helps us to understand the current competitive situation of the industry. To be precise, our survey process typically involve with the 360 analysis of the market. This analytical process begins by identifying the prospective customers for a product or service related to the market/industry to obtain data on how a product/service could fit into customers’ lives.

Secondary Research: The secondary data sources includes information published by the on-profit organizations such as World bank, WHO, company fillings, investor presentations, annual reports, national government documents, statistical databases, blogs, articles, white papers and others. From the annual report, we analyse a company’s revenue to understand the key segment and market share of that organization in a particular region. We analyse the company websites and adopt the product mapping technique which is important for deriving the segment revenue. In the product mapping method, we select and categorize the products offered by the companies catering to domain specific market, deduce the product revenue for each of the companies so as to get overall estimation of the market size. We also source data and analyses trends based on information received from supply side and demand side intermediaries in the value chain. The supply side denotes the data gathered from supplier, distributor, wholesaler and the demand side illustrates the data gathered from the end customers for respective market domain.

The supply side for a domain specific market is analysed by:
The demand side for the market is estimated through:
In-house Library: Apart from these third-party sources, we have our in-house library of qualitative and quantitative information. Our in-house database includes market data for various industry and domains. These data are updated on regular basis as per the changing market scenario. Our library includes, historic databases, internal audit reports and archives.
Sometimes there are instances where there is no metadata or raw data available for any domain specific market. For those cases, we use our expertise to forecast and estimate the market size in order to generate comprehensive data sets. Our analyst team adopt a robust research technique in order to produce the estimates:
Data Synthesis: This stage involves the analysis & mapping of all the information obtained from the previous step. It also involves in scrutinizing the data for any discrepancy observed while data gathering related to the market. The data is collected with consideration to the heterogeneity of sources. Robust scientific techniques are in place for synthesizing disparate data sets and provide the essential contextual information that can orient market strategies. The Brainy Insights has extensive experience in data synthesis where the data passes through various stages:


Market Deduction & Formulation: The final stage comprises of assigning data points at appropriate market spaces so as to deduce feasible conclusions. Analyst perspective & subject matter expert based holistic form of market sizing coupled with industry analysis also plays a crucial role in this stage.
This stage involves in finalization of the market size and numbers that we have collected from data integration step. With data interpolation, it is made sure that there is no gap in the market data. Successful trend analysis is done by our analysts using extrapolation techniques, which provide the best possible forecasts for the market.
Data Validation & Market Feedback: Validation is the most important step in the process. Validation & re-validation via an intricately designed process helps us finalize data-points to be used for final calculations.

The Brainy Insights interacts with leading companies and experts of the concerned domain to develop the analyst team’s market understanding and expertise. It improves and substantiates every single data presented in the market reports. The data validation interview and discussion panels are typically composed of the most experienced industry members. The participants include, however, are not limited to:
Moreover, we always validate our data and findings through primary respondents from all the major regions we are working on.


Free Customization
Fortune 500 Clients
Free Yearly Update On Purchase Of Multi/Corporate License
Companies Served Till Date