- +1-315-215-1633
- sales@thebrainyinsights.com

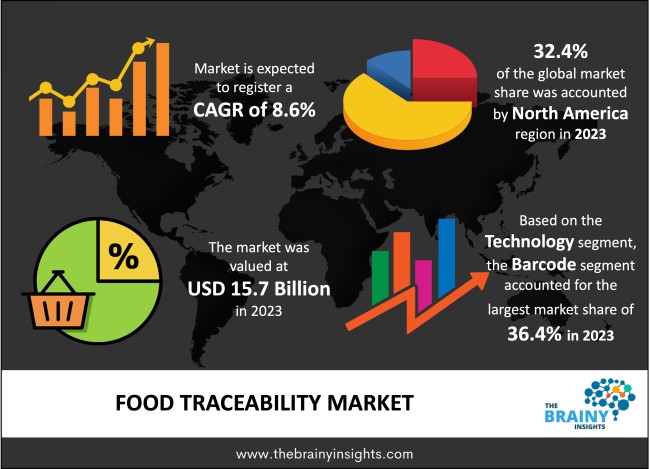
The Food Traceability Market was valued at USD 15.7 billion in 2023 and grew at a CAGR of 8.6% from 2024 to 2033. Traceability solutions are becoming more and more popular because of the strict rules and guidelines governing the safety and traceability of food that are established by international organizations and governmental agencies. Producers must abide by these rules in order to guarantee the security of their goods and keep the confidence of customers. Traceability system adoption is mostly driven by rising consumer knowledge and a growing desire for openness in food sourcing. Businesses are reacting to consumer demand for product origin knowledge by putting traceability technologies in place to offer comprehensive details about the products' journey through farm to table.
The increasing frequency of foodborne illnesses and food fraud incidents globally, technological developments, the food industry's growing digitization, strict government and international organization-established food safety and traceability standards, and an increase in product recalls owing to food contamination are the main factors driving this market's growth. The absence of infrastructure in developing nations to facilitate food traceability and other data privacy concerns associated with food traceability, however, limit the market's expansion. Furthermore, it is anticipated that the increase in food transparency would present substantial expansion prospects for the food traceability industry's stakeholders. However, a significant obstacle impeding market expansion is the absence of harmonization and standards in food traceability systems.
Get an overview of this study by requesting a free sample
The growing consciousness among customers about food safety, authenticity, and quality has fueled the need for traceability solutions. Food origins are becoming more and more important to consumers, who want to know specifics like where their food was grown, processed, and packaged. Additionally, producers of food, manufacturers, and retailers are required to install traceability systems due to strict laws and standards enforced by global regulatory organizations and government bodies. The objectives of these policies are to guarantee supply chain transparency, improve food safety, and reduce foodborne illnesses.
Customers are calling for more openness in the food supply chain due to growing concerns about food safety, authenticity, and sustainability. Consumer trust is increased via traceability, which gives assurance regarding the provenance and quality of food goods. In order to guarantee food safety and quality, governments all over the world are also putting strict rules into place that require traceability mechanisms throughout the food supply chain. Adoption of traceability systems by food producers, processors, and distributors is largely influenced by compliance with these rules.
There are chances to improve food traceability systems as long as blockchain, the Internet of Things (IoT), artificial intelligence (AI), and machine learning continue to progress. With the use of these technologies, supply chain transparency, real-time monitoring, and data accuracy may all be increased, leading to more efficient traceability solutions. Furthermore, food traceability can provide value-added services to supply chain participants beyond just complying with regulations. For instance, shelf-life prediction, inventory management, supply chain optimization, and quality control can all benefit from the use of traceability data. Businesses that provide all-inclusive traceability solutions together with extra data and insights have a better chance of gaining market share.
North America led the market in 2023 with the largest market share of 32.4%. Due to a combination of industry collaboration, customer needs, technology infrastructure, legislative initiatives, and a strong emphasis on the quality and safety of food, North America leads the world in food traceability. The area is positioned as a pioneer in guaranteeing accountability and transparency across the food supply chain due to its proactive commitment towards adopting and expanding traceability solutions. Businesses in North America have been leading the way in using technology advancements in traceability. Businesses in the area frequently use cutting-edge technologies to improve the effectiveness, precision, and general efficiency within their traceability systems.
North America Region Food Tech Market Share in 2023 - 32.4%
www.thebrainyinsights.com
Check the geographical analysis of this market by requesting a free sample
The barcodes segment dominated the global market in 2023 with a market share of 36.4%. The cost-effectiveness of barcode technology in comparison to certain other traceability technologies is responsible for the segment's rise. Due to their ease of use, barcodes are available to a broad spectrum of firms, particularly small and medium-sized food industry businesses. While other technologies, like blockchain and RFID, are also crucial to food traceability, barcodes are a popular and preferred option for many companies involved in the intricate and dynamic food supply chain due to their affordability, ease of use, and broad acceptance.
The Supply chain management (SCM) segment dominated the global market in 2023 with a market share of 38.7%. The market leadership of supply chain management (SCM) technology is attributed to its capacity to offer complete visibility, facilitate smooth integration with traceability solutions, guarantee regulatory compliance, and enhance multiple facets of supply chain operations. Because of its extensive functionality, supply chain management (SCM) software is positioned as a key component in attaining efficient and dependable traceability in the intricate and dynamic food supply chain. Supply chain management (SCM) software enhances the overall effectiveness of operations by improving resource use, cutting down on delays, and streamlining supply chain procedures. This efficiency also applies to traceability initiatives, since a well-managed supply chain improves the precision and dependability of traceability data.
The fish, meat, and seafood segment dominated the global market in 2023 with a market share of 26.1%. Fish, meat, and seafood items may be tracked all the way back to their source thanks to traceability systems, which also provide details about the farms, aquaculture facilities, and fishing vessels used to harvest or raise the products. Customers can use this information to make well-informed judgments regarding the sustainability, freshness, and quality of the goods they buy. Furthermore, the fish, meat, and seafood sector must adhere to strict laws pertaining to food safety, sustainability, and labeling. Traceability systems keep accurate records of product origin, handling procedures, and traceability, which assists stakeholders in adhering to these rules. This involves adhering to laws like the Common Fisheries Policy (CFP) of the European Union and the Seafood Import Monitoring Program (SIMP) in the United States.
| Attribute | Description |
|---|---|
| Market Size | Revenue (USD Billion) |
| Market size value in 2023 | USD 15.7 Billion |
| Market size value in 2033 | USD 35.8 Billion |
| CAGR (2024 to 2033) | 8.6% |
| Historical data | 2020-2022 |
| Base Year | 2023 |
| Forecast | 2024-2033 |
| Region | The regions analyzed for the market are Asia Pacific, Europe, South America, North America, and Middle East & Africa. Furthermore, the regions are further analyzed at the country level. |
| Segments | Technology, Software, End User |
As per The Brainy Insights, the size of the food traceability market was valued at USD 15.7 billion in 2023 to USD 35.8 billion by 2033.
The global food traceability market is growing at a CAGR of 8.6% during the forecast period 2024-2033.
The North America region emerged as the largest market for the food traceability.
The increasing consumer demand for transparency will influence the market's growth.
1. Introduction
1.1. Objectives of the Study
1.2. Market Definition
1.3. Research Scope
1.4. Currency
1.5. Key Target Audience
2. Research Methodology and Assumptions
3. Executive Summary
4. Premium Insights
4.1. Porter’s Five Forces Analysis
4.2. Value Chain Analysis
4.3. Top Investment Pockets
4.3.1. Market Attractiveness Analysis by Technology
4.3.2. Market Attractiveness Analysis by Software
4.3.3. Market Attractiveness Analysis by End User
4.3.4. Market Attractiveness Analysis by Region
4.4. Industry Trends
5. Market Dynamics
5.1. Market Evaluation
5.2. Drivers
5.2.1. Increasing consumer demand for transparency
5.3. Restraints
5.3.1. Cost of Implementation
5.4. Opportunities
5.4.1. Technological Advancements
5.5. Challenges
5.5.1. Data Privacy and Security Concerns
6. Global Food Traceability Market Analysis and Forecast, By Technology
6.1. Segment Overview
6.2. Radio Frequency Identification
6.3. Barcodes
6.4. Infrared
6.5. Biometrics
6.6. Global Positioning Systems
6.7. Others
7. Global Food Traceability Market Analysis and Forecast, By Software
7.1. Segment Overview
7.2. Enterprise Resources Planning (ERP)
7.3. Friction Welding
7.4. Laboratory Information Systems
7.5. Warehouse Software
7.6. Supply Chain Management (SCM)
7.7. Others
8. Global Food Traceability Market Analysis and Forecast, By End User
8.1. Segment Overview
8.2. Fruits & Vegetables
8.3. Fruit Pulp & Concentrates
8.4. Dairy Products
8.5. Fish, Meat, and Seafood
8.6. Processed Food
8.7. Bakery & Confectionary
8.8. Others
9. Global Food Traceability Market Analysis and Forecast, By Regional Analysis
9.1. Segment Overview
9.2. North America
9.2.1. U.S.
9.2.2. Canada
9.2.3. Mexico
9.3. Europe
9.3.1. Germany
9.3.2. France
9.3.3. U.K.
9.3.4. Italy
9.3.5. Spain
9.4. Asia-Pacific
9.4.1. Japan
9.4.2. China
9.4.3. India
9.5. South America
9.5.1. Brazil
9.6. Middle East and Africa
9.6.1. UAE
9.6.2. South Africa
10. Global Food Traceability Market-Competitive Landscape
10.1. Overview
10.2. Market Share of Key Players in the Food Traceability Market
10.2.1. Global Company Market Share
10.2.2. North America Company Market Share
10.2.3. Europe Company Market Share
10.2.4. APAC Company Market Share
10.3. Competitive Situations and Trends
10.3.1. Product Launches and Developments
10.3.2. Partnerships, Collaborations, and Agreements
10.3.3. Mergers & Acquisitions
10.3.4. Expansions
11. Company Profiles
11.1. Merit-Trax
11.1.1. Business Overview
11.1.2. Company Snapshot
11.1.3. Company Market Share Analysis
11.1.4. Company Product Portfolio
11.1.5. Recent Developments
11.1.6. SWOT Analysis
11.2. FoodLogiQ
11.2.1. Business Overview
11.2.2. Company Snapshot
11.2.3. Company Market Share Analysis
11.2.4. Company Product Portfolio
11.2.5. Recent Developments
11.2.6. SWOT Analysis
11.3. Safe Traces
11.3.1. Business Overview
11.3.2. Company Snapshot
11.3.3. Company Market Share Analysis
11.3.4. Company Product Portfolio
11.3.5. Recent Developments
11.3.6. SWOT Analysis
11.4. Food Forensics
11.4.1. Business Overview
11.4.2. Company Snapshot
11.4.3. Company Market Share Analysis
11.4.4. Company Product Portfolio
11.4.5. Recent Developments
11.4.6. SWOT Analysis
11.5. Bext360
11.5.1. Business Overview
11.5.2. Company Snapshot
11.5.3. Company Market Share Analysis
11.5.4. Company Product Portfolio
11.5.5. Recent Developments
11.5.6. SWOT Analysis
11.6. rfxcel
11.6.1. Business Overview
11.6.2. Company Snapshot
11.6.3. Company Market Share Analysis
11.6.4. Company Product Portfolio
11.6.5. Recent Developments
11.6.6. SWOT Analysis
11.7. Covectra
11.7.1. Business Overview
11.7.2. Company Snapshot
11.7.3. Company Market Share Analysis
11.7.4. Company Product Portfolio
11.7.5. Recent Developments
11.7.6. SWOT Analysis
11.8. Bar Code Integrators
11.8.1. Business Overview
11.8.2. Company Snapshot
11.8.3. Company Market Share Analysis
11.8.4. Company Product Portfolio
11.8.5. Recent Developments
11.8.6. SWOT Analysis
11.9. C.H. Robinson
11.9.1. Business Overview
11.9.2. Company Snapshot
11.9.3. Company Market Share Analysis
11.9.4. Company Product Portfolio
11.9.5. Recent Developments
11.9.6. SWOT Analysis
11.10. Cognex
11.10.1. Business Overview
11.10.2. Company Snapshot
11.10.3. Company Market Share Analysis
11.10.4. Company Product Portfolio
11.10.5. Recent Developments
11.10.6. SWOT Analysis
11.11. Honeywell International Inc
11.11.1. Business Overview
11.11.2. Company Snapshot
11.11.3. Company Market Share Analysis
11.11.4. Company Product Portfolio
11.11.5. Recent Developments
11.11.6. SWOT Analysis
11.12. SGS SA
11.12.1. Business Overview
11.12.2. Company Snapshot
11.12.3. Company Market Share Analysis
11.12.4. Company Product Portfolio
11.12.5. Recent Developments
11.12.6. SWOT Analysis
11.13. Zebra Technologies
11.13.1. Business Overview
11.13.2. Company Snapshot
11.13.3. Company Market Share Analysis
11.13.4. Company Product Portfolio
11.13.5. Recent Developments
11.13.6. SWOT Analysis
11.14. Carlisle
11.14.1. Business Overview
11.14.2. Company Snapshot
11.14.3. Company Market Share Analysis
11.14.4. Company Product Portfolio
11.14.5. Recent Developments
11.14.6. SWOT Analysis
List of Table
1. Global Food Traceability Market, By Technology, 2020-2033 (USD Billion)
2. Global Radio Frequency Identification Food Traceability Market, By Region, 2020-2033 (USD Billion)
3. Global Barcodes Food Traceability Market, By Region, 2020-2033 (USD Billion)
4. Global Infrared Food Traceability Market, By Region, 2020-2033 (USD Billion)
5. Global Biometrics Food Traceability Market, By Region, 2020-2033 (USD Billion)
6. Global, Global Positioning Systems Food Traceability Market, By Region, 2020-2033 (USD Billion)
7. Global Others Food Traceability Market, By Region, 2020-2033 (USD Billion)
8. Global Food Traceability Market, By Software, 2020-2033 (USD Billion)
9. Global Enterprise Resources Planning (ERP) Food Traceability Market, By Region, 2020-2033 (USD Billion)
10. Global Friction Welding Food Traceability Market, By Region, 2020-2033 (USD Billion)
11. Global Laboratory Information Systems Food Traceability Market, By Region, 2020-2033 (USD Billion)
12. Global Warehouse Software Food Traceability Market, By Region, 2020-2033 (USD Billion)
13. Global Supply Chain Management (SCM) Food Traceability Market, By Region, 2020-2033 (USD Billion)
14. Global Others Food Traceability Market, By Region, 2020-2033 (USD Billion)
15. Global Food Traceability Market, By End User, 2020-2033 (USD Billion)
16. Global Fruits & Vegetables Food Traceability Market, By Region, 2020-2033 (USD Billion)
17. Global Fruit Pulp & Concentrates Food Traceability Market, By Region, 2020-2033 (USD Billion)
18. Global Dairy Products Food Traceability Market, By Region, 2020-2033 (USD Billion)
19. Global Fish, Meat, and Seafood Food Traceability Market, By Region, 2020-2033 (USD Billion)
20. Global Processed Food, Food Traceability Market, By Region, 2020-2033 (USD Billion)
21. Global Bakery & Confectionary Traceability Market, By Region, 2020-2033 (USD Billion)
22. Global Others Traceability Market, By Region, 2020-2033 (USD Billion)
23. Global Food Traceability Market, By Region, 2020-2033 (USD Billion)
24. North America Food Traceability Market, By Technology, 2020-2033 (USD Billion)
25. North America Food Traceability Market, By Software, 2020-2033 (USD Billion)
26. North America Food Traceability Market, By End User, 2020-2033 (USD Billion)
27. U.S. Food Traceability Market, By Technology, 2020-2033 (USD Billion)
28. U.S. Food Traceability Market, By Software, 2020-2033 (USD Billion)
29. U.S. Food Traceability Market, By End User, 2020-2033 (USD Billion)
30. Canada Food Traceability Market, By Technology, 2020-2033 (USD Billion)
31. Canada Food Traceability Market, By Software, 2020-2033 (USD Billion)
32. Canada Food Traceability Market, By End User, 2020-2033 (USD Billion)
33. Mexico Food Traceability Market, By Technology, 2020-2033 (USD Billion)
34. Mexico Food Traceability Market, By Software, 2020-2033 (USD Billion)
35. Mexico Food Traceability Market, By End User, 2020-2033 (USD Billion)
36. Europe Food Traceability Market, By Technology, 2020-2033 (USD Billion)
37. Europe Food Traceability Market, By Software, 2020-2033 (USD Billion)
38. Europe Food Traceability Market, By End User, 2020-2033 (USD Billion)
39. Germany Food Traceability Market, By Technology, 2020-2033 (USD Billion)
40. Germany Food Traceability Market, By Software, 2020-2033 (USD Billion)
41. Germany Food Traceability Market, By End User, 2020-2033 (USD Billion)
42. France Food Traceability Market, By Technology, 2020-2033 (USD Billion)
43. France Food Traceability Market, By Software, 2020-2033 (USD Billion)
44. France Food Traceability Market, By End User, 2020-2033 (USD Billion)
45. U.K. Food Traceability Market, By Technology, 2020-2033 (USD Billion)
46. U.K. Food Traceability Market, By Software, 2020-2033 (USD Billion)
47. U.K. Food Traceability Market, By End User, 2020-2033 (USD Billion)
48. Italy Food Traceability Market, By Technology, 2020-2033 (USD Billion)
49. Italy Food Traceability Market, By Software, 2020-2033 (USD Billion)
50. Italy Food Traceability Market, By End User, 2020-2033 (USD Billion)
51. Spain Food Traceability Market, By Technology, 2020-2033 (USD Billion)
52. Spain Food Traceability Market, By Software, 2020-2033 (USD Billion)
53. Spain Food Traceability Market, By End User, 2020-2033 (USD Billion)
54. Asia Pacific Food Traceability Market, By Technology, 2020-2033 (USD Billion)
55. Asia Pacific Food Traceability Market, By Software, 2020-2033 (USD Billion)
56. Asia Pacific Food Traceability Market, By End User, 2020-2033 (USD Billion)
57. Japan Food Traceability Market, By Technology, 2020-2033 (USD Billion)
58. Japan Food Traceability Market, By Software, 2020-2033 (USD Billion)
59. Japan Food Traceability Market, By End User, 2020-2033 (USD Billion)
60. China Food Traceability Market, By Technology, 2020-2033 (USD Billion)
61. China Food Traceability Market, By Software, 2020-2033 (USD Billion)
62. China Food Traceability Market, By End User, 2020-2033 (USD Billion)
63. India Food Traceability Market, By Technology, 2020-2033 (USD Billion)
64. India Food Traceability Market, By Software, 2020-2033 (USD Billion)
65. India Food Traceability Market, By End User, 2020-2033 (USD Billion)
66. South America Food Traceability Market, By Technology, 2020-2033 (USD Billion)
67. South America Food Traceability Market, By Software, 2020-2033 (USD Billion)
68. South America Food Traceability Market, By End User, 2020-2033 (USD Billion)
69. Brazil Food Traceability Market, By Technology, 2020-2033 (USD Billion)
70. Brazil Food Traceability Market, By Software, 2020-2033 (USD Billion)
71. Brazil Food Traceability Market, By End User, 2020-2033 (USD Billion)
72. Middle East and Africa Food Traceability Market, By Technology, 2020-2033 (USD Billion)
73. Middle East and Africa Food Traceability Market, By Software, 2020-2033 (USD Billion)
74. Middle East and Africa Food Traceability Market, By End User, 2020-2033 (USD Billion)
75. UAE Food Traceability Market, By Technology, 2020-2033 (USD Billion)
76. UAE Food Traceability Market, By Software, 2020-2033 (USD Billion)
77. UAE Food Traceability Market, By End User, 2020-2033 (USD Billion)
78. South Africa Food Traceability Market, By Technology, 2020-2033 (USD Billion)
79. South Africa Food Traceability Market, By Software, 2020-2033 (USD Billion)
80. South Africa Food Traceability Market, By End User, 2020-2033 (USD Billion)
List of Figures
1. Global Food Traceability Market Segmentation
2. Food Traceability Market: Research Methodology
3. Market Size Estimation Methodology: Bottom-Up Approach
4. Market Size Estimation Methodology: Top-Down Approach
5. Data Triangulation
6. Porter’s Five Forces Analysis
7. Value Chain Analysis
8. Global Food Traceability Market Attractiveness Analysis by Technology
9. Global Food Traceability Market Attractiveness Analysis by Software
10. Global Food Traceability Market Attractiveness Analysis by End User
11. Global Food Traceability Market Attractiveness Analysis by Region
12. Global Food Traceability Market: Dynamics
13. Global Food Traceability Market Share by Technology (2023 & 2033)
14. Global Food Traceability Market Share by Software (2023 & 2033)
15. Global Food Traceability Market Share by End User (2023 & 2033)
16. Global Food Traceability Market Share by Regions (2023 & 2033)
17. Global Food Traceability Market Share by Company (2023)
This study forecasts revenue at global, regional, and country levels from 2020 to 2033. The Brainy Insights has segmented the global food traceability market based on below-mentioned segments:
Global Food Traceability Market by Technology:
Global Food Traceability Market by Software:
Global Food Traceability Market by End User:
Global Food Traceability Market by Region:
Research has its special purpose to undertake marketing efficiently. In this competitive scenario, businesses need information across all industry verticals; the information about customer wants, market demand, competition, industry trends, distribution channels etc. This information needs to be updated regularly because businesses operate in a dynamic environment. Our organization, The Brainy Insights incorporates scientific and systematic research procedures in order to get proper market insights and industry analysis for overall business success. The analysis consists of studying the market from a miniscule level wherein we implement statistical tools which helps us in examining the data with accuracy and precision.
Our research reports feature both; quantitative and qualitative aspects for any market. Qualitative information for any market research process are fundamental because they reveal the customer needs and wants, usage and consumption for any product/service related to a specific industry. This in turn aids the marketers/investors in knowing certain perceptions of the customers. Qualitative research can enlighten about the different product concepts and designs along with unique service offering that in turn, helps define marketing problems and generate opportunities. On the other hand, quantitative research engages with the data collection process through interviews, e-mail interactions, surveys and pilot studies. Quantitative aspects for the market research are useful to validate the hypotheses generated during qualitative research method, explore empirical patterns in the data with the help of statistical tools, and finally make the market estimations.
The Brainy Insights offers comprehensive research and analysis, based on a wide assortment of factual insights gained through interviews with CXOs and global experts and secondary data from reliable sources. Our analysts and industry specialist assume vital roles in building up statistical tools and analysis models, which are used to analyse the data and arrive at accurate insights with exceedingly informative research discoveries. The data provided by our organization have proven precious to a diverse range of companies, facilitating them to address issues such as determining which products/services are the most appealing, whether or not customers use the product in the manner anticipated, the purchasing intentions of the market and many others.
Our research methodology encompasses an idyllic combination of primary and secondary initiatives. Key phases involved in this process are listed below:

The phase involves the gathering and collecting of market data and its related information with the help of different sources & research procedures.

The data procurement stage involves in data gathering and collecting through various data sources.
This stage involves in extensive research. These data sources includes:
Purchased Database: Purchased databases play a crucial role in estimating the market sizes irrespective of the domain. Our purchased database includes:
Primary Research: The Brainy Insights interacts with leading companies and experts of the concerned domain to develop the analyst team’s market understanding and expertise. It improves and substantiates every single data presented in the market reports. Primary research mainly involves in telephonic interviews, E-mail interactions and face-to-face interviews with the raw material providers, manufacturers/producers, distributors, & independent consultants. The interviews that we conduct provides valuable data on market size and industry growth trends prevailing in the market. Our organization also conducts surveys with the various industry experts in order to gain overall insights of the industry/market. For instance, in healthcare industry we conduct surveys with the pharmacists, doctors, surgeons and nurses in order to gain insights and key information of a medical product/device/equipment which the customers are going to usage. Surveys are conducted in the form of questionnaire designed by our own analyst team. Surveys plays an important role in primary research because surveys helps us to identify the key target audiences of the market. Additionally, surveys helps to identify the key target audience engaged with the market. Our survey team conducts the survey by targeting the key audience, thus gaining insights from them. Based on the perspectives of the customers, this information is utilized to formulate market strategies. Moreover, market surveys helps us to understand the current competitive situation of the industry. To be precise, our survey process typically involve with the 360 analysis of the market. This analytical process begins by identifying the prospective customers for a product or service related to the market/industry to obtain data on how a product/service could fit into customers’ lives.

Secondary Research: The secondary data sources includes information published by the on-profit organizations such as World bank, WHO, company fillings, investor presentations, annual reports, national government documents, statistical databases, blogs, articles, white papers and others. From the annual report, we analyse a company’s revenue to understand the key segment and market share of that organization in a particular region. We analyse the company websites and adopt the product mapping technique which is important for deriving the segment revenue. In the product mapping method, we select and categorize the products offered by the companies catering to domain specific market, deduce the product revenue for each of the companies so as to get overall estimation of the market size. We also source data and analyses trends based on information received from supply side and demand side intermediaries in the value chain. The supply side denotes the data gathered from supplier, distributor, wholesaler and the demand side illustrates the data gathered from the end customers for respective market domain.

The supply side for a domain specific market is analysed by:
The demand side for the market is estimated through:
In-house Library: Apart from these third-party sources, we have our in-house library of qualitative and quantitative information. Our in-house database includes market data for various industry and domains. These data are updated on regular basis as per the changing market scenario. Our library includes, historic databases, internal audit reports and archives.
Sometimes there are instances where there is no metadata or raw data available for any domain specific market. For those cases, we use our expertise to forecast and estimate the market size in order to generate comprehensive data sets. Our analyst team adopt a robust research technique in order to produce the estimates:
Data Synthesis: This stage involves the analysis & mapping of all the information obtained from the previous step. It also involves in scrutinizing the data for any discrepancy observed while data gathering related to the market. The data is collected with consideration to the heterogeneity of sources. Robust scientific techniques are in place for synthesizing disparate data sets and provide the essential contextual information that can orient market strategies. The Brainy Insights has extensive experience in data synthesis where the data passes through various stages:


Market Deduction & Formulation: The final stage comprises of assigning data points at appropriate market spaces so as to deduce feasible conclusions. Analyst perspective & subject matter expert based holistic form of market sizing coupled with industry analysis also plays a crucial role in this stage.
This stage involves in finalization of the market size and numbers that we have collected from data integration step. With data interpolation, it is made sure that there is no gap in the market data. Successful trend analysis is done by our analysts using extrapolation techniques, which provide the best possible forecasts for the market.
Data Validation & Market Feedback: Validation is the most important step in the process. Validation & re-validation via an intricately designed process helps us finalize data-points to be used for final calculations.

The Brainy Insights interacts with leading companies and experts of the concerned domain to develop the analyst team’s market understanding and expertise. It improves and substantiates every single data presented in the market reports. The data validation interview and discussion panels are typically composed of the most experienced industry members. The participants include, however, are not limited to:
Moreover, we always validate our data and findings through primary respondents from all the major regions we are working on.


Free Customization
Fortune 500 Clients
Free Yearly Update On Purchase Of Multi/Corporate License
Companies Served Till Date