- +1-315-215-1633
- sales@thebrainyinsights.com

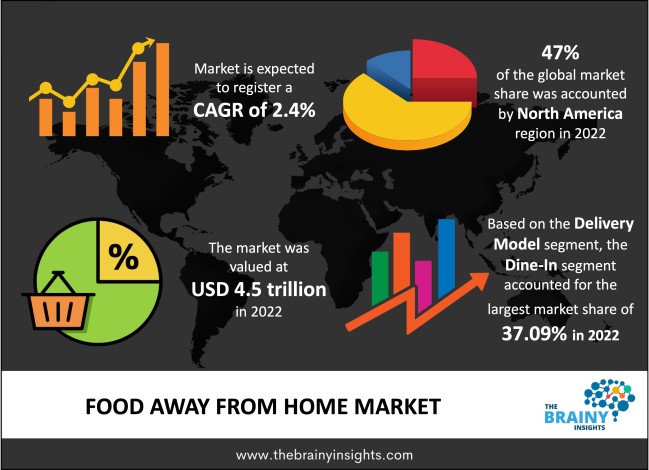
The global food away from home market is expected to reach USD 5.4 trillion by 2032, at a CAGR of 2.4% during the forecast period 2023 to 2032. Asia Pacific is expected to grow the fastest during the forecast period.
The worldwide food away from home market is seeing significant value growth due to the increased global population, more disposable income, rising junk food chain penetration, the increased popularity of cloud kitchens, and changes in consumer food tastes. Furthermore, as fast-food chains become more prevalent in developing countries, the worldwide FAFH market is expected to expand significantly over the forecast period. Prominent worldwide fast-food corporations such as Yum Brands, Subway, McDonald's, Dunkin' Donuts, and KFC rapidly increase their market share in nations such as India, Brazil, Indonesia, and China. The fast-food restaurant business is expected to grow in popularity in the coming years as rural areas become more urbanized. Furthermore, growth in women's employment, rising disposable income, a busy and chaotic lifestyle, and easy availability of the desired junk food are the key factors expected to boost consumer demand for fast food.
Get an overview of this study by requesting a free sample
Hectic Schedule- Due to the hectic schedules of both parents in a family, which results in less time for cooking and purchasing veggies, the rapid increase in the female workforce is predicted to drive the food away from home market growth. According to the Department of Labor Statistics, women's labour force participation in 2019 was 57.4%, up from 57.1% in 2018. According to the NITI (National Institute for Transforming India) Aayog study, female labour force participation climbed from 23.1 to 27.9% in the two years from 2018 to 2020. This increase in female labour force participation, combined with rapid urbanization, is expected to drive food away from home market growth during the forecast period, as more female labour force participation results in more consumers. All these factors are the primary reasons for the rising FAFH market demand.
Expensive- One of the primary disadvantages of food away from home market is the cost. When ordering food for more than one person, the price is frequently the same as eating at a fine restaurant every night. Several food ordering systems exceed $20 per person per day. Several other food ordering systems are much pricier. Food away from home is frequently too expensive for people on a tight budget.
Rising Popularity of Cuisines- The rising trend of eating various cuisines is fueling the expansion of food away from the home sector. Globalization and the free movement of information around the globe via the internet have expanded global public understanding of international cuisines. Globally, Chinese and Thai cuisine has been an enormous success. Furthermore, the number of restaurants, bars, cafes, and food trucks has increased significantly in developed and developing countries over the last decade. Subway, for example, had around 41,600 locations globally in 2019. Similarly, Restaurant Brands International, McDonald's, Pizza Hut, Starbucks, KFC, and Dunkin Donuts had 25,809, 37,855, 18,515, 30,000, and 9,200 international stores, respectively. The big junk food chains have been aggressively investing in business expansion in various locations to reach many customers, encouraging the total growth of the food away from home industry.
Quality May Suffer- One of the main issues with food ordering systems is the reduced quality of food served. It is because when food is transported over long distances, essential nutrients, vitamins, and minerals can be lost. Additionally, when the food is served, it is often packaged in plastic containers. It has a different visual appeal than freshly prepared food and is presented on a plate in a restaurant.
The regions analysed for the market include North America, Europe, South America, Asia Pacific, the Middle East, and Africa. North America emerged as the most significant global food away from home, with a 47% market revenue share in 2022.
North America dominates the food away from home market with a 47% market revenue share in 2022 due to the increased penetration of prominent restaurant chains in the region and the popularity of the eating-out culture. In the United States, well-known restaurant chains such as Carrabba's Italian Grill, KFC, Texas Roadhouse, McDonald's, The Cheesecake Factory, and Olive Garden may be found. The development of restaurant chains across the country, high disposable income, the incredible popularity of the dining-out lifestyle, and the growing use of online meal delivery services are significant drivers of the expansion of North American food away from home.
Asia Pacific is expected to witness the fastest growth during the forecast period. The increased demand for fast food items such as sandwiches, pizza, and burgers, among others, in developing countries such as India, China, and Australia is a significant reason for the rise of the FAFH market in Asia-Pacific. The changing lifestyle of the region is the primary reason for this. Furthermore, many midsize and small food manufacturing companies are increasing their investments in developing countries, assisting the market's expansion. Consumer tastes and preferences, high population density, and the growing number of fast-food restaurants and trucks drive regional market growth and development.
North America Region Food Away From Home Market Share in 2022 - 47%
www.thebrainyinsights.com
Check the geographical analysis of this market by requesting a free sample
The delivery model segment is divided into dine-in, home delivery and takeaway. The dine-in segment dominated the market, with a share of around 37.09% in 2022. Dine-in is the most popular and traditional delivery strategy worldwide, which is a primary reason for this segment's dominance in the industry. Dine-in allows restaurants to provide their consumers with the best service, atmosphere, and food while facilitating good guest experiences. Some primary factors that affect or attract customers to the dine-in delivery model include restaurant service, food quality, price, location, and ambience.
The application segment is divided into restaurants, hotels and motels, schools and colleges, retail stores and vending, and others. The restaurant segment dominated the market, with a market share of around 45.89% in 2022. It is primarily due to the spread of many full-service and limited-service restaurants. The rise in popularity of the dining-out culture, along with rising female labour-force participation, has dramatically boosted the market growth of the restaurant category. Furthermore, people's shifting food habits and hectic lifestyles are increasing the need for fast food. The largest global fast-food companies are making significant expenditures to develop their businesses in various countries as a result of this. The increased presence of popular fast-food franchises such as KFC, Pizza Hut, and Subway will likely drive restaurant expansion in the future.
| Attribute | Description |
|---|---|
| Market Size | Revenue (USD Trillion) |
| Market size value in 2022 | USD 4.5 trillion |
| Market size value in 2032 | USD 5.4 trillion |
| CAGR (2023 to 2032) | 2.4% |
| Historical data | 2019-2021 |
| Base Year | 2022 |
| Forecast | 2023-2032 |
| Regional Segments | North America, Asia Pacific, Europe, Latin America, Middle East and Africa |
| Segments | Delivery Model, Application |
As per The Brainy Insights, the size of the food away from home market was valued at USD 4.5 trillion in 2022 to USD 5.4 trillion by 2032.
The global food away from home market is growing at a CAGR of 2.4% during the forecast period 2023-2032.
North America emerged as the largest food away from home market.
1. Introduction
1.1. Objectives of the Study
1.2. Market Definition
1.3. Research Scope
1.4. Currency
1.5. Key Target Audience
2. Research Methodology and Assumptions
3. Executive Summary
4. Premium Insights
4.1. Porter’s Five Forces Analysis
4.2. Value Chain Analysis
4.3. Top Investment Pockets
4.3.1. Market Attractiveness Analysis by Delivery Model
4.3.2. Market Attractiveness Analysis by Application
4.3.3. Market Attractiveness Analysis by Region
4.4. Industry Trends
5. Market Dynamics
5.1. Market Evaluation
5.2. Drivers
5.2.1. Hectic Schedule
5.3. Restraints
5.3.1. Expensive
5.4. Opportunities
5.4.1. Rising Popularity of Cuisines
5.5. Challenges
5.5.1. Quality May Suffer
6. Global Food Away From Home Market Analysis and Forecast, By Delivery Model
6.1. Segment Overview
6.2. Dine In
6.3. Home Delivery
6.4. Take Away
7. Global Food Away From Home Market Analysis and Forecast, By Application
7.1. Segment Overview
7.2. Restaurants
7.3. Hotels and Motels
7.4. Schools and Colleges
7.5. Retail Stores and Vending
7.6. Others
8. Global Food Away From Home Market Analysis and Forecast, By Regional Analysis
8.1. Segment Overview
8.2. North America
8.2.1. U.S.
8.2.2. Canada
8.2.3. Mexico
8.3. Europe
8.3.1. Germany
8.3.2. France
8.3.3. U.K.
8.3.4. Italy
8.3.5. Spain
8.4. Asia-Pacific
8.4.1. Japan
8.4.2. China
8.4.3. India
8.5. South America
8.5.1. Brazil
8.6. Middle East and Africa
8.6.1. UAE
8.6.2. South Africa
9. Global Food Away From Home Market-Competitive Landscape
9.1. Overview
9.2. Market Share of Key Players in Global Food Away From Home Market
9.2.1. Global Company Market Share
9.2.2. North America Company Market Share
9.2.3. Europe Company Market Share
9.2.4. APAC Company Market Share
9.3. Competitive Situations and Trends
9.3.1. Product Launches and Developments
9.3.2. Partnerships, Collaborations, and Agreements
9.3.3. Mergers & Acquisitions
9.3.4. Expansions
10. Company Profiles
10.1. Chipotle Mexican Grill
10.1.1. Business Overview
10.1.2. Company Snapshot
10.1.3. Company Market Share Analysis
10.1.4. Company Product Portfolio
10.1.5. Recent Developments
10.1.6. SWOT Analysis
10.2. Yum Brands, Inc.
10.2.1. Business Overview
10.2.2. Company Snapshot
10.2.3. Company Market Share Analysis
10.2.4. Company Product Portfolio
10.2.5. Recent Developments
10.2.6. SWOT Analysis
10.3. Darden Concepts, Inc.
10.3.1. Business Overview
10.3.2. Company Snapshot
10.3.3. Company Market Share Analysis
10.3.4. Company Product Portfolio
10.3.5. Recent Developments
10.3.6. SWOT Analysis
10.4. Jubilant FoodWorks Limited
10.4.1. Business Overview
10.4.2. Company Snapshot
10.4.3. Company Market Share Analysis
10.4.4. Company Product Portfolio
10.4.5. Recent Developments
10.4.6. SWOT Analysis
10.5. Sysco Corporation
10.5.1. Business Overview
10.5.2. Company Snapshot
10.5.3. Company Market Share Analysis
10.5.4. Company Product Portfolio
10.5.5. Recent Developments
10.5.6. SWOT Analysis
10.6. Zensho Holdings Co., Ltd.
10.6.1. Business Overview
10.6.2. Company Snapshot
10.6.3. Company Market Share Analysis
10.6.4. Company Product Portfolio
10.6.5. Recent Developments
10.6.6. SWOT Analysis
10.7. Compass Group PLC
10.7.1. Business Overview
10.7.2. Company Snapshot
10.7.3. Company Market Share Analysis
10.7.4. Company Product Portfolio
10.7.5. Recent Developments
10.7.6. SWOT Analysis
10.8. SSP Group Plc
10.8.1. Business Overview
10.8.2. Company Snapshot
10.8.3. Company Market Share Analysis
10.8.4. Company Product Portfolio
10.8.5. Recent Developments
10.8.6. SWOT Analysis
10.9. Burger King Corporation
10.9.1. Business Overview
10.9.2. Company Snapshot
10.9.3. Company Market Share Analysis
10.9.4. Company Product Portfolio
10.9.5. Recent Developments
10.9.6. SWOT Analysis
10.10. Bid Corporation
10.10.1. Business Overview
10.10.2. Company Snapshot
10.10.3. Company Market Share Analysis
10.10.4. Company Product Portfolio
10.10.5. Recent Developments
10.10.6. SWOT Analysis
10.11. Aramark
10.11.1. Business Overview
10.11.2. Company Snapshot
10.11.3. Company Market Share Analysis
10.11.4. Company Product Portfolio
10.11.5. Recent Developments
10.11.6. SWOT Analysis
10.12. SATS Ltd.
10.12.1. Business Overview
10.12.2. Company Snapshot
10.12.3. Company Market Share Analysis
10.12.4. Company Product Portfolio
10.12.5. Recent Developments
10.12.6. SWOT Analysis
10.13. Sodexo
10.13.1. Business Overview
10.13.2. Company Snapshot
10.13.3. Company Market Share Analysis
10.13.4. Company Product Portfolio
10.13.5. Recent Developments
10.13.6. SWOT Analysis
List of Table
1. Global Food Away From Home Market, By Delivery Model, 2019-2032 (USD Trillion)
2. Global Dine In, Food Away From Home Market, By Region, 2019-2032 (USD Trillion)
3. Global Home Delivery, Food Away From Home Market, By Region, 2019-2032 (USD Trillion)
4. Global Take Away, Food Away From Home Market, By Region, 2019-2032 (USD Trillion)
5. Global Food Away From Home Market, By Application, 2019-2032 (USD Trillion)
6. Global Restaurants, Food Away From Home Market, By Region, 2019-2032 (USD Trillion)
7. Global Hotels and Motels, Food Away From Home Market, By Region, 2019-2032 (USD Trillion)
8. Global Schools and Colleges, Food Away From Home Market, By Region, 2019-2032 (USD Trillion)
9. Global Retail Stores and Vending, Food Away From Home Market, By Region, 2019-2032 (USD Trillion)
10. Global Others, Food Away From Home Market, By Region, 2019-2032 (USD Trillion)
11. North America Food Away From Home Market, By Delivery Model, 2019-2032 (USD Trillion)
12. North America Food Away From Home Market, By Application, 2019-2032 (USD Trillion)
13. U.S. Food Away From Home Market, By Delivery Model, 2019-2032 (USD Trillion)
14. U.S. Food Away From Home Market, By Application, 2019-2032 (USD Trillion)
15. Canada Food Away From Home Market, By Delivery Model, 2019-2032 (USD Trillion)
16. Canada Food Away From Home Market, By Application, 2019-2032 (USD Trillion)
17. Mexico Food Away From Home Market, By Delivery Model, 2019-2032 (USD Trillion)
18. Mexico Food Away From Home Market, By Application, 2019-2032 (USD Trillion)
19. Europe Food Away From Home Market, By Delivery Model, 2019-2032 (USD Trillion)
20. Europe Food Away From Home Market, By Application, 2019-2032 (USD Trillion)
21. Germany Food Away From Home Market, By Delivery Model, 2019-2032 (USD Trillion)
22. Germany Food Away From Home Market, By Application, 2019-2032 (USD Trillion)
23. France Food Away From Home Market, By Delivery Model, 2019-2032 (USD Trillion)
24. France Food Away From Home Market, By Application, 2019-2032 (USD Trillion)
25. U.K. Food Away From Home Market, By Delivery Model, 2019-2032 (USD Trillion)
26. U.K. Food Away From Home Market, By Application, 2019-2032 (USD Trillion)
27. Italy Food Away From Home Market, By Delivery Model, 2019-2032 (USD Trillion)
28. Italy Food Away From Home Market, By Application, 2019-2032 (USD Trillion)
29. Spain Food Away From Home Market, By Delivery Model, 2019-2032 (USD Trillion)
30. Spain Food Away From Home Market, By Application, 2019-2032 (USD Trillion)
31. Asia Pacific Food Away From Home Market, By Delivery Model, 2019-2032 (USD Trillion)
32. Asia Pacific Food Away From Home Market, By Application, 2019-2032 (USD Trillion)
33. Japan Food Away From Home Market, By Delivery Model, 2019-2032 (USD Trillion)
34. Japan Food Away From Home Market, By Application, 2019-2032 (USD Trillion)
35. China Food Away From Home Market, By Delivery Model, 2019-2032 (USD Trillion)
36. China Food Away From Home Market, By Application, 2019-2032 (USD Trillion)
37. India Food Away From Home Market, By Delivery Model, 2019-2032 (USD Trillion)
38. India Food Away From Home Market, By Application, 2019-2032 (USD Trillion)
39. South America Food Away From Home Market, By Delivery Model, 2019-2032 (USD Trillion)
40. South America Food Away From Home Market, By Application, 2019-2032 (USD Trillion)
41. Brazil Food Away From Home Market, By Delivery Model, 2019-2032 (USD Trillion)
42. Brazil Food Away From Home Market, By Application, 2019-2032 (USD Trillion)
43. Middle East and Africa Food Away From Home Market, By Delivery Model, 2019-2032 (USD Trillion)
44. Middle East and Africa Food Away From Home Market, By Application, 2019-2032 (USD Trillion)
45. UAE Food Away From Home Market, By Delivery Model, 2019-2032 (USD Trillion)
46. UAE Food Away From Home Market, By Application, 2019-2032 (USD Trillion)
47. South Africa Food Away From Home Market, By Delivery Model, 2019-2032 (USD Trillion)
48. South Africa Food Away From Home Market, By Application, 2019-2032 (USD Trillion)
List of Figures
1. Global Food Away From Home Market Segmentation
2. Global Food Away From Home Market: Research Methodology
3. Market Size Estimation Methodology: Bottom-Up Approach
4. Market Size Estimation Methodology: Top-Down Approach
5. Data Triangulation
6. Porter’s Five Forces Analysis
7. Value Chain Analysis
8. Global Food Away From Home Market Attractiveness Analysis by Delivery Model
9. Global Food Away From Home Market Attractiveness Analysis by Application
10. Global Food Away From Home Market Attractiveness Analysis by Region
11. Global Food Away From Home Market: Dynamics
12. Global Food Away From Home Market Share by Delivery Model (2023 & 2032)
13. Global Food Away From Home Market Share by Application (2023 & 2032)
14. Global Food Away From Home Market Share by Regions (2023 & 2032)
15. Global Food Away From Home Market Share by Company (2022)
This study forecasts global, regional, and country revenue from 2019 to 2032. The Brainy Insights has segmented the global food away from home market based on the below-mentioned segments:
Global Food Away From Home Market By Delivery Model:
Global Food Away From Home Market By Application:
Global Food Away From Home Market By Region:
Research has its special purpose to undertake marketing efficiently. In this competitive scenario, businesses need information across all industry verticals; the information about customer wants, market demand, competition, industry trends, distribution channels etc. This information needs to be updated regularly because businesses operate in a dynamic environment. Our organization, The Brainy Insights incorporates scientific and systematic research procedures in order to get proper market insights and industry analysis for overall business success. The analysis consists of studying the market from a miniscule level wherein we implement statistical tools which helps us in examining the data with accuracy and precision.
Our research reports feature both; quantitative and qualitative aspects for any market. Qualitative information for any market research process are fundamental because they reveal the customer needs and wants, usage and consumption for any product/service related to a specific industry. This in turn aids the marketers/investors in knowing certain perceptions of the customers. Qualitative research can enlighten about the different product concepts and designs along with unique service offering that in turn, helps define marketing problems and generate opportunities. On the other hand, quantitative research engages with the data collection process through interviews, e-mail interactions, surveys and pilot studies. Quantitative aspects for the market research are useful to validate the hypotheses generated during qualitative research method, explore empirical patterns in the data with the help of statistical tools, and finally make the market estimations.
The Brainy Insights offers comprehensive research and analysis, based on a wide assortment of factual insights gained through interviews with CXOs and global experts and secondary data from reliable sources. Our analysts and industry specialist assume vital roles in building up statistical tools and analysis models, which are used to analyse the data and arrive at accurate insights with exceedingly informative research discoveries. The data provided by our organization have proven precious to a diverse range of companies, facilitating them to address issues such as determining which products/services are the most appealing, whether or not customers use the product in the manner anticipated, the purchasing intentions of the market and many others.
Our research methodology encompasses an idyllic combination of primary and secondary initiatives. Key phases involved in this process are listed below:

The phase involves the gathering and collecting of market data and its related information with the help of different sources & research procedures.

The data procurement stage involves in data gathering and collecting through various data sources.
This stage involves in extensive research. These data sources includes:
Purchased Database: Purchased databases play a crucial role in estimating the market sizes irrespective of the domain. Our purchased database includes:
Primary Research: The Brainy Insights interacts with leading companies and experts of the concerned domain to develop the analyst team’s market understanding and expertise. It improves and substantiates every single data presented in the market reports. Primary research mainly involves in telephonic interviews, E-mail interactions and face-to-face interviews with the raw material providers, manufacturers/producers, distributors, & independent consultants. The interviews that we conduct provides valuable data on market size and industry growth trends prevailing in the market. Our organization also conducts surveys with the various industry experts in order to gain overall insights of the industry/market. For instance, in healthcare industry we conduct surveys with the pharmacists, doctors, surgeons and nurses in order to gain insights and key information of a medical product/device/equipment which the customers are going to usage. Surveys are conducted in the form of questionnaire designed by our own analyst team. Surveys plays an important role in primary research because surveys helps us to identify the key target audiences of the market. Additionally, surveys helps to identify the key target audience engaged with the market. Our survey team conducts the survey by targeting the key audience, thus gaining insights from them. Based on the perspectives of the customers, this information is utilized to formulate market strategies. Moreover, market surveys helps us to understand the current competitive situation of the industry. To be precise, our survey process typically involve with the 360 analysis of the market. This analytical process begins by identifying the prospective customers for a product or service related to the market/industry to obtain data on how a product/service could fit into customers’ lives.

Secondary Research: The secondary data sources includes information published by the on-profit organizations such as World bank, WHO, company fillings, investor presentations, annual reports, national government documents, statistical databases, blogs, articles, white papers and others. From the annual report, we analyse a company’s revenue to understand the key segment and market share of that organization in a particular region. We analyse the company websites and adopt the product mapping technique which is important for deriving the segment revenue. In the product mapping method, we select and categorize the products offered by the companies catering to domain specific market, deduce the product revenue for each of the companies so as to get overall estimation of the market size. We also source data and analyses trends based on information received from supply side and demand side intermediaries in the value chain. The supply side denotes the data gathered from supplier, distributor, wholesaler and the demand side illustrates the data gathered from the end customers for respective market domain.

The supply side for a domain specific market is analysed by:
The demand side for the market is estimated through:
In-house Library: Apart from these third-party sources, we have our in-house library of qualitative and quantitative information. Our in-house database includes market data for various industry and domains. These data are updated on regular basis as per the changing market scenario. Our library includes, historic databases, internal audit reports and archives.
Sometimes there are instances where there is no metadata or raw data available for any domain specific market. For those cases, we use our expertise to forecast and estimate the market size in order to generate comprehensive data sets. Our analyst team adopt a robust research technique in order to produce the estimates:
Data Synthesis: This stage involves the analysis & mapping of all the information obtained from the previous step. It also involves in scrutinizing the data for any discrepancy observed while data gathering related to the market. The data is collected with consideration to the heterogeneity of sources. Robust scientific techniques are in place for synthesizing disparate data sets and provide the essential contextual information that can orient market strategies. The Brainy Insights has extensive experience in data synthesis where the data passes through various stages:


Market Deduction & Formulation: The final stage comprises of assigning data points at appropriate market spaces so as to deduce feasible conclusions. Analyst perspective & subject matter expert based holistic form of market sizing coupled with industry analysis also plays a crucial role in this stage.
This stage involves in finalization of the market size and numbers that we have collected from data integration step. With data interpolation, it is made sure that there is no gap in the market data. Successful trend analysis is done by our analysts using extrapolation techniques, which provide the best possible forecasts for the market.
Data Validation & Market Feedback: Validation is the most important step in the process. Validation & re-validation via an intricately designed process helps us finalize data-points to be used for final calculations.

The Brainy Insights interacts with leading companies and experts of the concerned domain to develop the analyst team’s market understanding and expertise. It improves and substantiates every single data presented in the market reports. The data validation interview and discussion panels are typically composed of the most experienced industry members. The participants include, however, are not limited to:
Moreover, we always validate our data and findings through primary respondents from all the major regions we are working on.


Free Customization
Fortune 500 Clients
Free Yearly Update On Purchase Of Multi/Corporate License
Companies Served Till Date