- +1-315-215-1633
- sales@thebrainyinsights.com

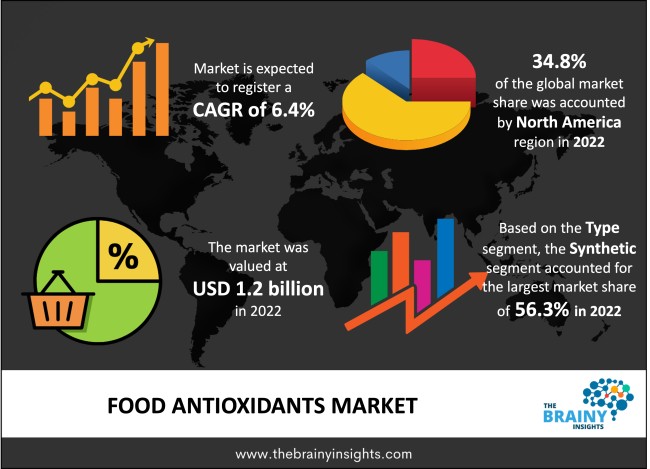
The global food antioxidants market was valued at USD 1.2 billion in 2022 and grew at a CAGR of 6.4% from 2023 to 2032. Food antioxidants are compounds that assist in preventing or reducing the oxidative damage brought on by free radicals in the body. Antioxidants are essential for increasing the shelf life of food goods, keeping flavor and color, and retaining the food's nutritional value. In recent years, the market for food antioxidants has been steadily expanding. The market is expanding as a result of factors such as increased disposable incomes in emerging nations, greater consumer awareness of the health advantages of antioxidants, and growing demand for natural food additives.
Antioxidants are compounds that stop the cellular oxidation process, which may damage organisms' cells and generate free radicals. They can be obtained naturally from a range of fruits and vegetables, such as raspberries, spinach, and eggplant, or they can be created chemically and utilized as additives for a variety of applications. It is widely used as a gasoline additive, plasticizer, and latex stabilizer in addition to being a preservative in many processed food products. A lot of pharmaceutical and cosmetic products also depend on it in important ways. During the anticipated time, the world's expanding population and the strong demand for processed goods, which fuels an accelerated rise in prices, will both contribute to the market's expansion.
Get an overview of this study by requesting a free sample
Consumers are becoming more and more aware of the value of a balanced diet and the contribution of antioxidants to sustaining overall health. To support their dietary objectives and avoid chronic illnesses, consumers are looking for food items with extra health advantages, such as antioxidants. Additionally, antioxidants are well known for their prospective health advantages, such as their capacity to squelch free radicals and lessen oxidative stress. As the world's population ages, the importance of preserving good health and avoiding age-related health problems has increased. This increases the demand for food products that are antioxidant-enriched.
Natural antioxidants obtained from vegetables, fruits, and other organic sources typically cost more than their synthetic or semi-synthetic alternatives. This price difference may restrict the use of organic antioxidants in the food sector, particularly in underdeveloped nations where consumers are more sensitive to price.
A means for food antioxidant suppliers to reach a larger customer base is made possible by the expansion of e-commerce platforms and direct-to-consumer channels. Direct interaction with customers improves the public's understanding of the advantages of antioxidants and opens up markets for specialized and niche antioxidant goods.
The Asia Pacific region dominated the market in 2022 with a market share of 34.8%. The high percentage can be attributed to nations like India, Japan, and China having growing populations. China produced 1.56 trillion USD worth of food, making it the world's top food producer, according to the Food and Agriculture Organization (FAO). The nation's expanding population is the main driver of the Chinese food business. The fact that India is the second most populated nation in Asia also adds to the rise in food consumption. The COVID-19 strike has had a significant influence on several locations, including Asia Pacific. The regional demand for healthy food products has grown as a result of the health issue. Over the forecast period, a combination of an expanding population and rising food consumption is anticipated to increase the demand for food antioxidants.
Asia Pacific Region Food Antioxidants Share in 2022 - 34.8%
www.thebrainyinsights.com
Check the geographical analysis of this market by requesting a free sample
The dry segment is likely to dominate the global market, with the highest CAGR of 8.1% over the forecast period. The significant portion can be attributed to the rising use of powder-based antioxidants in food items. Powders of a technical grade are widely used in many food items. The powder lessens the negative effects of free radicals and may significantly reduce the damage that radicals can do. The majority of dietary antioxidants come in powder, tablet, flakes, and granular forms. Because dry antioxidants are so simple to use, store, and supply, they are highly favored by customers. Over the forecast period, a growing prepared food sector is anticipated to fuel demand for dry antioxidants around the globe.
The synthetic category dominated the market in 2022 with a market share of 56.3%. To produce a variety of food items, butylated hydroxyanisole (BHA), butylated hydroxytoluene (BHT), tert-butylhydroquinone (TBHQ), and propyl gallate (PG) are increasingly used. Synthetic antioxidants are made by a conventional industrial process using a variety of ingredients. As a result, its use as an addition is subject to certain strict rules from the governments of several nations. Synthetic antioxidants are frequently used to extend the shelf life of food goods and improve their texture, color, and smell.
The meat and poultry segment dominated the global market in 2022 with a market share of 33.8%. The rise is being driven by increased global consumption of meat and associated food products. Meat and poultry are considered excellent sources of protein, which people require for a balanced diet. Consumption of meat and poultry products offers necessary protein to human bodies. Red meat, such as hog, lamb, and beef, is often included in the meat portion. The increased popularity of chicken meat due to its low price is predicted to be the primary driver of the poultry market's growth. Meat and poultry items are also sold in packed form, which may be stored for a long time and consumed as needed, which will help the market grow.
| Attribute | Description |
|---|---|
| Market Size | Revenue (USD Billion) |
| Market size value in 2022 | USD 1.2 Billion |
| Market size value in 2032 | USD 2.2 Billion |
| CAGR (2023 to 2032) | 6.4% |
| Historical data | 2019-2021 |
| Base Year | 2022 |
| Forecast | 2023-2032 |
| Regional Segments | The regions analyzed for the market are Asia Pacific, Europe, South America, North America, and Middle East & Africa. Furthermore, the regions are further analyzed at the country level. |
| Segments | Form, Type, Application |
As per The Brainy Insights, the size of the food antioxidants market was valued at USD 1.2 billion in 2022 to USD 2.2 billion by 2032.
The global food antioxidants market is growing at a CAGR of 6.4% during the forecast period 2023-2032.
The Asia Pacific region emerged as the largest market for the food antioxidants.
Rising Consumer awareness will influence the market's growth.
1. Introduction
1.1. Objectives of the Study
1.2. Market Definition
1.3. Research Scope
1.4. Currency
1.5. Key Target Audience
2. Research Methodology and Assumptions
3. Executive Summary
4. Premium Insights
4.1. Porter’s Five Forces Analysis
4.2. Value Chain Analysis
4.3. Top Investment Pockets
4.3.1. Market Attractiveness Analysis by Form
4.3.2. Market Attractiveness Analysis by Type
4.3.3. Market Attractiveness Analysis by Application
4.3.4. Market Attractiveness Analysis by Region
4.4. Industry Trends
5. Market Dynamics
5.1. Market Evaluation
5.2. Drivers
5.2.1. Rising Consumer awareness
5.3. Restraints
5.3.1. High Cost
5.4. Opportunities
5.4.1. Expansion of e-commerce platforms
6. Global Food Antioxidants Market Analysis and Forecast, By Form
6.1. Segment Overview
6.2. Liquid
6.3. Dry
7. Global Food Antioxidants Market Analysis and Forecast, By Type
7.1. Segment Overview
7.2. Synthetic
7.3. Natural
8. Global Food Antioxidants Market Analysis and Forecast, By Application
8.1. Segment Overview
8.2. Meat & Poultry
8.3. Bakery & Confectionery
8.4. Fats & Oil
8.5. Fish
9. Global Food Antioxidants Market Analysis and Forecast, By Regional Analysis
9.1. Segment Overview
9.2. North America
9.2.1. U.S.
9.2.2. Canada
9.2.3. Mexico
9.3. Europe
9.3.1. Germany
9.3.2. France
9.3.3. U.K.
9.3.4. Italy
9.3.5. Spain
9.4. Asia-Pacific
9.4.1. Japan
9.4.2. China
9.4.3. India
9.5. South America
9.5.1. Brazil
9.6. Middle East and Africa
9.6.1. UAE
9.6.2. South Africa
10. Global Food Antioxidants Market-Competitive Landscape
10.1. Overview
10.2. Market Share of Key Players in the Food Antioxidants Market
10.2.1. Global Company Market Share
10.2.2. North America Company Market Share
10.2.3. Europe Company Market Share
10.2.4. APAC Company Market Share
10.3. Competitive Situations and Trends
10.3.1. Product Launches and Developments
10.3.2. Partnerships, Collaborations, and Agreements
10.3.3. Mergers & Acquisitions
10.3.4. Expansions
11. Company Profiles
11.1. Camlin Fine Sciences
11.1.1. Business Overview
11.1.2. Company Snapshot
11.1.3. Company Market Share Analysis
11.1.4. Company Product Portfolio
11.1.5. Recent Developments
11.1.6. SWOT Analysis
11.2. 3A Antioxidants
11.2.1. Business Overview
11.2.2. Company Snapshot
11.2.3. Company Market Share Analysis
11.2.4. Company Product Portfolio
11.2.5. Recent Developments
11.2.6. SWOT Analysis
11.3. Eastman Chemical Company
11.3.1. Business Overview
11.3.2. Company Snapshot
11.3.3. Company Market Share Analysis
11.3.4. Company Product Portfolio
11.3.5. Recent Developments
11.3.6. SWOT Analysis
11.4. Frutarom Ltd
11.4.1. Business Overview
11.4.2. Company Snapshot
11.4.3. Company Market Share Analysis
11.4.4. Company Product Portfolio
11.4.5. Recent Developments
11.4.6. SWOT Analysis
11.5. Barentz Group
11.5.1. Business Overview
11.5.2. Company Snapshot
11.5.3. Company Market Share Analysis
11.5.4. Company Product Portfolio
11.5.5. Recent Developments
11.5.6. SWOT Analysis
11.6. Vitablend Nederland BV
11.6.1. Business Overview
11.6.2. Company Snapshot
11.6.3. Company Market Share Analysis
11.6.4. Company Product Portfolio
11.6.5. Recent Developments
11.6.6. SWOT Analysis
11.7. Crystal Quinone Pvt Ltd
11.7.1. Business Overview
11.7.2. Company Snapshot
11.7.3. Company Market Share Analysis
11.7.4. Company Product Portfolio
11.7.5. Recent Developments
11.7.6. SWOT Analysis
11.8. Sasol Limited
11.8.1. Business Overview
11.8.2. Company Snapshot
11.8.3. Company Market Share Analysis
11.8.4. Company Product Portfolio
11.8.5. Recent Developments
11.8.6. SWOT Analysis
11.9. Naturex
11.9.1. Business Overview
11.9.2. Company Snapshot
11.9.3. Company Market Share Analysis
11.9.4. Company Product Portfolio
11.9.5. Recent Developments
11.9.6. SWOT Analysis
11.10. BASF SE
11.10.1. Business Overview
11.10.2. Company Snapshot
11.10.3. Company Market Share Analysis
11.10.4. Company Product Portfolio
11.10.5. Recent Developments
11.10.6. SWOT Analysis
11.11. Archer Daniels Midland Company (ADM)
11.11.1. Business Overview
11.11.2. Company Snapshot
11.11.3. Company Market Share Analysis
11.11.4. Company Product Portfolio
11.11.5. Recent Developments
11.11.6. SWOT Analysis
11.12. DuPont
11.12.1. Business Overview
11.12.2. Company Snapshot
11.12.3. Company Market Share Analysis
11.12.4. Company Product Portfolio
11.12.5. Recent Developments
11.12.6. SWOT Analysis
11.13. Kalsec Inc.
11.13.1. Business Overview
11.13.2. Company Snapshot
11.13.3. Company Market Share Analysis
11.13.4. Company Product Portfolio
11.13.5. Recent Developments
11.13.6. SWOT Analysis
11.14. Kemin Industries
11.14.1. Business Overview
11.14.2. Company Snapshot
11.14.3. Company Market Share Analysis
11.14.4. Company Product Portfolio
11.14.5. Recent Developments
11.14.6. SWOT Analysis
List of Table
1. Global Food Antioxidants Market, By Form, 2019-2032 (USD Billion)
2. Global Liquid, Food Antioxidants Market, By Region, 2019-2032 (USD Billion)
3. Global Dry, Food Antioxidants Market, By Region, 2019-2032 (USD Billion)
4. Global Food Antioxidants Market, By Type, 2019-2032 (USD Billion)
5. Global Synthetic, Food Antioxidants Market, By Region, 2019-2032 (USD Billion)
6. Global Natural, Food Antioxidants Market, By Region, 2019-2032 (USD Billion)
7. Global Food Antioxidants Market, By Application, 2019-2032 (USD Billion)
8. Global Meat & Poultry, Food Antioxidants Market, By Region, 2019-2032 (USD Billion)
9. Global Bakery & Confectionery, Food Antioxidants Market, By Region, 2019-2032 (USD Billion)
10. Global Fats & Oil, Food Antioxidants Market, By Region, 2019-2032 (USD Billion)
11. Global Fish, Antioxidants Market, By Region, 2019-2032 (USD Billion)
12. North America Food Antioxidants Market, By Form, 2019-2032 (USD Billion)
13. North America Food Antioxidants Market, By Type, 2019-2032 (USD Billion)
14. North America Food Antioxidants Market, By Application, 2019-2032 (USD Billion)
15. U.S. Food Antioxidants Market, By Form, 2019-2032 (USD Billion)
16. U.S. Food Antioxidants Market, By Type, 2019-2032 (USD Billion)
17. U.S. Food Antioxidants Market, By Application, 2019-2032 (USD Billion)
18. Canada Food Antioxidants Market, By Form, 2019-2032 (USD Billion)
19. Canada Food Antioxidants Market, By Type, 2019-2032 (USD Billion)
20. Canada Food Antioxidants Market, By Application, 2019-2032 (USD Billion)
21. Mexico Food Antioxidants Market, By Form, 2019-2032 (USD Billion)
22. Mexico Food Antioxidants Market, By Type, 2019-2032 (USD Billion)
23. Mexico Food Antioxidants Market, By Application, 2019-2032 (USD Billion)
24. Europe Food Antioxidants Market, By Form, 2019-2032 (USD Billion)
25. Europe Food Antioxidants Market, By Type, 2019-2032 (USD Billion)
26. Europe Food Antioxidants Market, By Application, 2019-2032 (USD Billion)
27. Germany Food Antioxidants Market, By Form, 2019-2032 (USD Billion)
28. Germany Food Antioxidants Market, By Type, 2019-2032 (USD Billion)
29. Germany Food Antioxidants Market, By Application, 2019-2032 (USD Billion)
30. France Food Antioxidants Market, By Form, 2019-2032 (USD Billion)
31. France Food Antioxidants Market, By Type, 2019-2032 (USD Billion)
32. France Food Antioxidants Market, By Application, 2019-2032 (USD Billion)
33. U.K. Food Antioxidants Market, By Form, 2019-2032 (USD Billion)
34. U.K. Food Antioxidants Market, By Type, 2019-2032 (USD Billion)
35. U.K. Food Antioxidants Market, By Application, 2019-2032 (USD Billion)
36. Italy Food Antioxidants Market, By Form, 2019-2032 (USD Billion)
37. Italy Food Antioxidants Market, By Type, 2019-2032 (USD Billion)
38. Italy Food Antioxidants Market, By Application, 2019-2032 (USD Billion)
39. Spain Food Antioxidants Market, By Form, 2019-2032 (USD Billion)
40. Spain Food Antioxidants Market, By Type, 2019-2032 (USD Billion)
41. Spain Food Antioxidants Market, By Application, 2019-2032 (USD Billion)
42. Asia Pacific Food Antioxidants Market, By Form, 2019-2032 (USD Billion)
43. Asia Pacific Food Antioxidants Market, By Type, 2019-2032 (USD Billion)
44. Asia Pacific Food Antioxidants Market, By Application, 2019-2032 (USD Billion)
45. Japan Food Antioxidants Market, By Form, 2019-2032 (USD Billion)
46. Japan Food Antioxidants Market, By Type, 2019-2032 (USD Billion)
47. Japan Food Antioxidants Market, By Application, 2019-2032 (USD Billion)
48. China Food Antioxidants Market, By Form, 2019-2032 (USD Billion)
49. China Food Antioxidants Market, By Type, 2019-2032 (USD Billion)
50. China Food Antioxidants Market, By Application, 2019-2032 (USD Billion)
51. India Food Antioxidants Market, By Form, 2019-2032 (USD Billion)
52. India Food Antioxidants Market, By Type, 2019-2032 (USD Billion)
53. India Food Antioxidants Market, By Application, 2019-2032 (USD Billion)
54. South America Food Antioxidants Market, By Form, 2019-2032 (USD Billion)
55. South America Food Antioxidants Market, By Type, 2019-2032 (USD Billion)
56. South America Food Antioxidants Market, By Application, 2019-2032 (USD Billion)
57. Brazil Food Antioxidants Market, By Form, 2019-2032 (USD Billion)
58. Brazil Food Antioxidants Market, By Type, 2019-2032 (USD Billion)
59. Brazil Food Antioxidants Market, By Application, 2019-2032 (USD Billion)
60. Middle East and Africa Food Antioxidants Market, By Form, 2019-2032 (USD Billion)
61. Middle East and Africa Food Antioxidants Market, By Type, 2019-2032 (USD Billion)
62. Middle East and Africa Food Antioxidants Market, By Application, 2019-2032 (USD Billion)
63. UAE Food Antioxidants Market, By Form, 2019-2032 (USD Billion)
64. UAE Food Antioxidants Market, By Type, 2019-2032 (USD Billion)
65. UAE Food Antioxidants Market, By Application, 2019-2032 (USD Billion)
66. South Africa Food Antioxidants Market, By Form, 2019-2032 (USD Billion)
67. South Africa Food Antioxidants Market, By Type, 2019-2032 (USD Billion)
68. South Africa Food Antioxidants Market, By Application, 2019-2032 (USD Billion)
List of Figures
1. Global Food Antioxidants Market Segmentation
2. Food Antioxidants Market: Research Methodology
3. Market Size Estimation Methodology: Bottom-Up Approach
4. Market Size Estimation Methodology: Top-Down Approach
5. Data Triangulation
6. Porter’s Five Forces Analysis
7. Value Chain Analysis
8. Global Food Antioxidants Market Attractiveness Analysis by Form
9. Global Food Antioxidants Market Attractiveness Analysis by Type
10. Global Food Antioxidants Market Attractiveness Analysis by Application
11. Global Food Antioxidants Market Attractiveness Analysis by Region
12. Global Food Antioxidants Market: Dynamics
13. Global Food Antioxidants Market Share by Form (2022 & 2032)
14. Global Food Antioxidants Market Share by Type (2022 & 2032)
15. Global Food Antioxidants Market Share by Application (2022 & 2032)
16. Global Food Antioxidants Market Share by Regions (2022 & 2032)
17. Global Food Antioxidants Market Share by Company (2022)
This study forecasts revenue at global, regional, and country levels from 2019 to 2032. The Brainy Insights has segmented the global food antioxidants market based on below-mentioned segments:
Global Food Antioxidants Market by Form:
Global Food Antioxidants Market by Type:
Global Food Antioxidants Market by Application:
Global Food Antioxidants Market by Region:
Research has its special purpose to undertake marketing efficiently. In this competitive scenario, businesses need information across all industry verticals; the information about customer wants, market demand, competition, industry trends, distribution channels etc. This information needs to be updated regularly because businesses operate in a dynamic environment. Our organization, The Brainy Insights incorporates scientific and systematic research procedures in order to get proper market insights and industry analysis for overall business success. The analysis consists of studying the market from a miniscule level wherein we implement statistical tools which helps us in examining the data with accuracy and precision.
Our research reports feature both; quantitative and qualitative aspects for any market. Qualitative information for any market research process are fundamental because they reveal the customer needs and wants, usage and consumption for any product/service related to a specific industry. This in turn aids the marketers/investors in knowing certain perceptions of the customers. Qualitative research can enlighten about the different product concepts and designs along with unique service offering that in turn, helps define marketing problems and generate opportunities. On the other hand, quantitative research engages with the data collection process through interviews, e-mail interactions, surveys and pilot studies. Quantitative aspects for the market research are useful to validate the hypotheses generated during qualitative research method, explore empirical patterns in the data with the help of statistical tools, and finally make the market estimations.
The Brainy Insights offers comprehensive research and analysis, based on a wide assortment of factual insights gained through interviews with CXOs and global experts and secondary data from reliable sources. Our analysts and industry specialist assume vital roles in building up statistical tools and analysis models, which are used to analyse the data and arrive at accurate insights with exceedingly informative research discoveries. The data provided by our organization have proven precious to a diverse range of companies, facilitating them to address issues such as determining which products/services are the most appealing, whether or not customers use the product in the manner anticipated, the purchasing intentions of the market and many others.
Our research methodology encompasses an idyllic combination of primary and secondary initiatives. Key phases involved in this process are listed below:

The phase involves the gathering and collecting of market data and its related information with the help of different sources & research procedures.

The data procurement stage involves in data gathering and collecting through various data sources.
This stage involves in extensive research. These data sources includes:
Purchased Database: Purchased databases play a crucial role in estimating the market sizes irrespective of the domain. Our purchased database includes:
Primary Research: The Brainy Insights interacts with leading companies and experts of the concerned domain to develop the analyst team’s market understanding and expertise. It improves and substantiates every single data presented in the market reports. Primary research mainly involves in telephonic interviews, E-mail interactions and face-to-face interviews with the raw material providers, manufacturers/producers, distributors, & independent consultants. The interviews that we conduct provides valuable data on market size and industry growth trends prevailing in the market. Our organization also conducts surveys with the various industry experts in order to gain overall insights of the industry/market. For instance, in healthcare industry we conduct surveys with the pharmacists, doctors, surgeons and nurses in order to gain insights and key information of a medical product/device/equipment which the customers are going to usage. Surveys are conducted in the form of questionnaire designed by our own analyst team. Surveys plays an important role in primary research because surveys helps us to identify the key target audiences of the market. Additionally, surveys helps to identify the key target audience engaged with the market. Our survey team conducts the survey by targeting the key audience, thus gaining insights from them. Based on the perspectives of the customers, this information is utilized to formulate market strategies. Moreover, market surveys helps us to understand the current competitive situation of the industry. To be precise, our survey process typically involve with the 360 analysis of the market. This analytical process begins by identifying the prospective customers for a product or service related to the market/industry to obtain data on how a product/service could fit into customers’ lives.

Secondary Research: The secondary data sources includes information published by the on-profit organizations such as World bank, WHO, company fillings, investor presentations, annual reports, national government documents, statistical databases, blogs, articles, white papers and others. From the annual report, we analyse a company’s revenue to understand the key segment and market share of that organization in a particular region. We analyse the company websites and adopt the product mapping technique which is important for deriving the segment revenue. In the product mapping method, we select and categorize the products offered by the companies catering to domain specific market, deduce the product revenue for each of the companies so as to get overall estimation of the market size. We also source data and analyses trends based on information received from supply side and demand side intermediaries in the value chain. The supply side denotes the data gathered from supplier, distributor, wholesaler and the demand side illustrates the data gathered from the end customers for respective market domain.

The supply side for a domain specific market is analysed by:
The demand side for the market is estimated through:
In-house Library: Apart from these third-party sources, we have our in-house library of qualitative and quantitative information. Our in-house database includes market data for various industry and domains. These data are updated on regular basis as per the changing market scenario. Our library includes, historic databases, internal audit reports and archives.
Sometimes there are instances where there is no metadata or raw data available for any domain specific market. For those cases, we use our expertise to forecast and estimate the market size in order to generate comprehensive data sets. Our analyst team adopt a robust research technique in order to produce the estimates:
Data Synthesis: This stage involves the analysis & mapping of all the information obtained from the previous step. It also involves in scrutinizing the data for any discrepancy observed while data gathering related to the market. The data is collected with consideration to the heterogeneity of sources. Robust scientific techniques are in place for synthesizing disparate data sets and provide the essential contextual information that can orient market strategies. The Brainy Insights has extensive experience in data synthesis where the data passes through various stages:


Market Deduction & Formulation: The final stage comprises of assigning data points at appropriate market spaces so as to deduce feasible conclusions. Analyst perspective & subject matter expert based holistic form of market sizing coupled with industry analysis also plays a crucial role in this stage.
This stage involves in finalization of the market size and numbers that we have collected from data integration step. With data interpolation, it is made sure that there is no gap in the market data. Successful trend analysis is done by our analysts using extrapolation techniques, which provide the best possible forecasts for the market.
Data Validation & Market Feedback: Validation is the most important step in the process. Validation & re-validation via an intricately designed process helps us finalize data-points to be used for final calculations.

The Brainy Insights interacts with leading companies and experts of the concerned domain to develop the analyst team’s market understanding and expertise. It improves and substantiates every single data presented in the market reports. The data validation interview and discussion panels are typically composed of the most experienced industry members. The participants include, however, are not limited to:
Moreover, we always validate our data and findings through primary respondents from all the major regions we are working on.


Free Customization
Fortune 500 Clients
Free Yearly Update On Purchase Of Multi/Corporate License
Companies Served Till Date