- +1-315-215-1633
- sales@thebrainyinsights.com

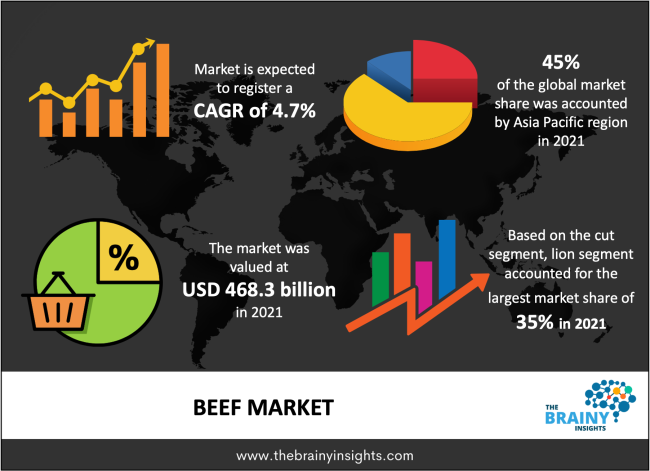
The beef market was valued at USD 468.3 billion in 2021 and is expected to expand at a CAGR of 4.7% over the forecast period from 2022 to 2030. The rising awareness about the importance of a protein-rich diet is driving the demand for meat products including beef. Additionally, the increasing application of beef cuts in the food service industry in the preparation of hotdogs, sausages, and steaks is also likely to drive market growth.
The growing number of millionaires in developed countries is responsible for the increase in beef cuts consumption as they can spend more on premium offerings. For instance, according to the data published by the Millionaire Foundry in June 2021, 18.6 million individuals in the US were millionaires, accounting for 7.6% of the US adult population.
Increasing consumption of superior cuts in China and other Southeast Asian countries such as Indonesia and Malaysia is expected to offer opportunities for the growth of the beef market. The global market is likely to witness an increasing product demand from China owing to the rising per capita consumption of beef over the past few years. For instance, according to USDA, beef consumption in China has increased by 55% from 5.0 million tons in 2000 to 7.7 million tons in 2019.
Get an overview of this study by requesting a free sample
Moreover, beef consumption is anticipated to be driven by the retail industry. Consumers are also seeking beef cuts ranging from traditional cuts to modern cut, which is fulfilled through retail stores. In addition to this, the demand for convenient and ready-to-eat food options is significantly rising among consumers owing to the growing trend of home cooking across the globe.
Key players in the global beef market, including Tyson Foods, Inc., Danish Crown, and Cargill, Incorporation are focusing on retaining their market share by improving product offerings to attract consumers who are always on the lookout for interesting and innovative foods. Furthermore, categorizing and labeling products as ‘organic’, ‘natural’, and ‘non-GMO’, and printing the nutritional content as well as health benefits on the packaging, are some of the most effective ways for companies to gain more customers. Several companies have been offering beef products with reduced content of table salt and fat to appeal to health-conscious consumers.
There is a high demand for halal beef in parts of the Middle East and Africa on account of the presence of a significant Islamic population. Countries whose populations are at least 95% Muslim include Iran, Iraq, Kuwait, Libya, Morocco, Maldives, Mauritania, Saudi Arabia, Afghanistan, Algeria, Comoros, Pakistan, Somalia, Sudan, Tunisia, Turkey, and Yemen. There are around 50 Muslim-majority countries worldwide, where halal beef is preferred. Many fast-food outlets in Singapore, such as McDonald’s and Burger King, exclusively serve halal beef to capture the market.
The U.S., France, and Israel have the highest Jewish population and account for over 86.8% of the global Jewish population. These regions are the major hubs for kosher beef consumption owing to the abundance of the Jewish population. In recent years, however, the overall beef demand has been declining, owing to growing interest in plant-based protein and cultured meat. The biggest demand deterrent of late has been a relentless increase in prices that started in October 2020, triggered by the tight global supply of animal feed and supply chain disruptions owing to the pandemic. This affected the kosher beef market as well.
Lion held the largest market share of more than 35% in 2021. The loin is divided into three parts: short loin, sirloin, and tenderloin. Short loin consists of the most desirable cuts of meat, including the T-bone, porterhouse steaks, and strip loin or strip steak. Sirloin is a large section and is majorly used for steaks. Tenderloin is a versatile portion and can be used for steaks or roasting. The demand for tenderloin is usually the strongest in the winter, typically supporting restaurant steak demand. This trend has been driving the growth of the segment seasonally.
Briskets are expected to register the fastest CAGR of 5.7% during the forecast period. The rising popularity of brisket consumption during winter or outdoor activities is driving the segment’s growth. High prices of corn and other feed, coupled with higher production costs, are resulting in the skyrocketing prices of brisket. A pound of brisket cost USD 4.40 in the first week of October 2021, which was up by 80% from the previous year, according to CattleFax. This could hamper the growth of the segment.
Asia Pacific accounted for the largest share of more than 45% in 2021. The demand for halal beef has been witnessing growth in this region due to the presence of the Muslim population in this region. Around 70% of the world’s Muslims live in Asia Pacific, and Indonesia harbors around 88% Muslim population. The other major countries with muslin population include Pakistan, India, Bangladesh, Malaysia, and Singapore. Moreover, support from the government to revive this sector is also expected to boost market growth. For instance, the government in China has reduced the tariffs on Australian beef through China-Australia Free Trade Agreement (CHAFTA), which emphasizes improving market access, mainly for chilled beef.
North America is anticipated to witness the fastest CAGR of 5.3% during the forecasted period. According to the USDA, the US is the largest consumer of beef in the region; as of 2020, the consumption of beef amounted to 27.60 billion pounds, which was roughly 21% of the global consumption. The US was home to approximately 93.6 million cattle and calves as of 2021. Beef is still the cash cow of the fresh meat retail department, with the highest retail sales within the category in the country. Top livestock and poultry slaughtering states in the US include Nebraska, Kansas, Texas, Colorado, California, Wisconsin, Washington, and Pennsylvania.
The increasing demand for fresh and processed beef at the regional, as well as global levels, is pushing market players to increase their production capacity. Leading companies are focusing on the innovation of products as well as production methods to meet the growing demand for sustainable beef. For instance, Bayer is committed to being a partner with the farmers and other stakeholders to help sustainably meet the growing protein demand of the world, while also reducing the greenhouse gas emissions of the beef industry through innovation.
Segments Covered in the Report
1. Introduction
1.1. Objectives of the Study
1.2. Market Definition
1.3. Research Scope
1.4. Currency
1.5. Key Target Audience
2. Research Methodology and Assumptions
3. Executive Summary
4. Premium Insights
4.1. Porter’s Five Forces Analysis
4.2. Value Chain Analysis
4.3. Top Investment Pockets
4.3.1. Market Attractiveness Analysis by Slaughter Method
4.3.2. Market Attractiveness Analysis by Cut
4.3.3. Market Attractiveness Analysis by Region
4.4. Industry Trends
5. Market Dynamics
5.1. Market Evaluation
5.2. Drivers
5.2.1. The increasing consumption of ready-to-eat beef products
5.3. Restraints
5.3.1. Growing Awareness Regarding Health Risks Associated
5.4. Opportunities
5.4.1. Rising demand for convenient and ready-to-eat food options
6. Global Beef Market Analysis and Forecast, By Slaughter Method
6.1. Segment Overview
6.2. Kosher
6.3. Halal
6.4. Others
7. Global Beef Market Analysis and Forecast, By Cut
7.1. Segment Overview
7.2. Brisket
7.3. Loin
7.4. Shank
7.5. Others
8. Global Beef Market Analysis and Forecast, By Regional Analysis
8.1. Segment Overview
8.2. North America
8.2.1. U.S.
8.2.2. Canada
8.2.3. Mexico
8.3. Europe
8.3.1. Germany
8.3.2. France
8.3.3. U.K.
8.3.4. Italy
8.3.5. Spain
8.4. Asia-Pacific
8.4.1. Japan
8.4.2. China
8.4.3. India
8.5. South America
8.5.1. Brazil
8.6. Middle East and Africa
8.6.1. UAE
8.6.2. South Africa
9. Global Beef Market-Competitive Landscape
9.1. Overview
9.2. Market Share of Key Players in the Beef Market
9.2.1. Global Company Market Share
9.2.2. North America Company Market Share
9.2.3. Europe Company Market Share
9.2.4. APAC Company Market Share
9.3. Competitive Situations and Trends
9.3.1. Product Launches and Developments
9.3.2. Partnerships, Collaborations, and Agreements
9.3.3. Mergers & Acquisitions
9.3.4. Expansions
10. Company Profiles
10.1. Hormel Foods Corporation
10.1.1. Business Overview
10.1.2. Company Snapshot
10.1.3. Company Market Share Analysis
10.1.4. Company Product Portfolio
10.1.5. Recent Developments
10.1.6. SWOT Analysis
10.2. JBS Foods
10.2.1. Business Overview
10.2.2. Company Snapshot
10.2.3. Company Market Share Analysis
10.2.4. Company Product Portfolio
10.2.5. Recent Developments
10.2.6. SWOT Analysis
10.3. National Beef Packing Company LLC
10.3.1. Business Overview
10.3.2. Company Snapshot
10.3.3. Company Market Share Analysis
10.3.4. Company Product Portfolio
10.3.5. Recent Developments
10.3.6. SWOT Analysis
10.4. Agri Beef Co.
10.4.1. Business Overview
10.4.2. Company Snapshot
10.4.3. Company Market Share Analysis
10.4.4. Company Product Portfolio
10.4.5. Recent Developments
10.4.6. SWOT Analysis
10.5. Tyson Foods, Inc.
10.5.1. Business Overview
10.5.2. Company Snapshot
10.5.3. Company Market Share Analysis
10.5.4. Company Product Portfolio
10.5.5. Recent Developments
10.5.6. SWOT Analysis
10.6. Danish Crown
10.6.1. Business Overview
10.6.2. Company Snapshot
10.6.3. Company Market Share Analysis
10.6.4. Company Product Portfolio
10.6.5. Recent Developments
10.6.6. SWOT Analysis
10.7. Cargill, Incorporated
10.7.1. Business Overview
10.7.2. Company Snapshot
10.7.3. Company Market Share Analysis
10.7.4. Company Product Portfolio
10.7.5. Recent Developments
10.7.6. SWOT Analysis
10.8. Strauss Brands LLC
10.8.1. Business Overview
10.8.2. Company Snapshot
10.8.3. Company Market Share Analysis
10.8.4. Company Product Portfolio
10.8.5. Recent Developments
10.8.6. SWOT Analysis
10.9. Marfrig Global Foods S.A.
10.9.1. Business Overview
10.9.2. Company Snapshot
10.9.3. Company Market Share Analysis
10.9.4. Company Product Portfolio
10.9.5. Recent Developments
10.9.6. SWOT Analysis
10.10. NH Foods Ltd.
10.10.1. Business Overview
10.10.2. Company Snapshot
10.10.3. Company Market Share Analysis
10.10.4. Company Product Portfolio
10.10.5. Recent Developments
10.10.6. SWOT Analysis
10.11. AMERICAN FOODS GROUP
10.11.1. Business Overview
10.11.2. Company Snapshot
10.11.3. Company Market Share Analysis
10.11.4. Company Product Portfolio
10.11.5. Recent Developments
10.11.6. SWOT Analysis
10.12. Minerva Foods
10.12.1. Business Overview
10.12.2. Company Snapshot
10.12.3. Company Market Share Analysis
10.12.4. Company Product Portfolio
10.12.5. Recent Developments
10.12.6. SWOT Analysis
10.13. Vion Food Group
10.13.1. Business Overview
10.13.2. Company Snapshot
10.13.3. Company Market Share Analysis
10.13.4. Company Product Portfolio
10.13.5. Recent Developments
10.13.6. SWOT Analysis
List of Table
1. Global Beef Market, By Slaughter Method, 2019-2030 (USD Billion)
2. Global Kosher Beef Market, By Region, 2019-2030 (USD Billion)
3. Global Halal Beef Market, By Region, 2019-2030 (USD Billion)
4. Global Others Beef Market, By Region, 2019-2030 (USD Billion)
5. Global Beef Market, By Cut, 2019-2030 (USD Billion)
6. Global Brisket Beef Market, By Region, 2019-2030 (USD Billion)
7. Global Loin Beef Market, By Region, 2019-2030 (USD Billion)
8. Global Shank Beef Market, By Region, 2019-2030 (USD Billion)
9. Global Others Beef Market, By Region, 2019-2030 (USD Billion)
10. Global Beef Market, By Region, 2019-2030 (USD Billion)
11. North America Beef Market, By Slaughter Method, 2019-2030 (USD Billion)
12. North America Beef Market, By Cut, 2019-2030 (USD Billion)
13. U.S. Beef Market, By Slaughter Method, 2019-2030 (USD Billion)
14. U.S. Beef Market, By Cut, 2019-2030 (USD Billion)
15. Canada Beef Market, By Slaughter Method, 2019-2030 (USD Billion)
16. Canada Beef Market, By Cut, 2019-2030 (USD Billion)
17. Mexico Beef Market, By Slaughter Method, 2019-2030 (USD Billion)
18. Mexico Beef Market, By Cut, 2019-2030 (USD Billion)
19. Europe Beef Market, By Slaughter Method, 2019-2030 (USD Billion)
20. Europe Beef Market, By Cut, 2019-2030 (USD Billion)
21. Germany Beef Market, By Slaughter Method, 2019-2030 (USD Billion)
22. Germany Beef Market, By Cut, 2019-2030 (USD Billion)
23. France Beef Market, By Slaughter Method, 2019-2030 (USD Billion)
24. France Beef Market, By Cut, 2019-2030 (USD Billion)
25. U.K. Beef Market, By Slaughter Method, 2019-2030 (USD Billion)
26. U.K. Beef Market, By Cut, 2019-2030 (USD Billion)
27. Italy Beef Market, By Slaughter Method, 2019-2030 (USD Billion)
28. Italy Beef Market, By Cut, 2019-2030 (USD Billion)
29. Spain Beef Market, By Slaughter Method, 2019-2030 (USD Billion)
30. Spain Beef Market, By Cut, 2019-2030 (USD Billion)
31. Asia Pacific Beef Market, By Slaughter Method, 2019-2030 (USD Billion)
32. Asia Pacific Beef Market, By Cut, 2019-2030 (USD Billion)
33. Japan Beef Market, By Slaughter Method, 2019-2030 (USD Billion)
34. Japan Beef Market, By Cut, 2019-2030 (USD Billion)
35. China Beef Market, By Slaughter Method, 2019-2030 (USD Billion)
36. China Beef Market, By Cut, 2019-2030 (USD Billion)
37. India Beef Market, By Slaughter Method, 2019-2030 (USD Billion)
38. India Beef Market, By Cut, 2019-2030 (USD Billion)
39. South America Beef Market, By Slaughter Method, 2019-2030 (USD Billion)
40. South America Beef Market, By Cut, 2019-2030 (USD Billion)
41. Brazil Beef Market, By Slaughter Method, 2019-2030 (USD Billion)
42. Brazil Beef Market, By Cut, 2019-2030 (USD Billion)
43. Middle East and Africa Beef Market, By Slaughter Method, 2019-2030 (USD Billion)
44. Middle East and Africa Beef Market, By Cut, 2019-2030 (USD Billion)
45. UAE Beef Market, By Slaughter Method, 2019-2030 (USD Billion)
46. UAE Beef Market, By Cut, 2019-2030 (USD Billion)
47. South Africa Beef Market, By Slaughter Method, 2019-2030 (USD Billion)
48. South Africa Beef Market, By Cut, 2019-2030 (USD Billion)
List of Figures
1. Global Beef Market Segmentation
2. Beef Market: Research Methodology
3. Market Size Estimation Methodology: Bottom-Up Approach
4. Market Size Estimation Methodology: Top-Down Approach
5. Data Triangulation
6. Porter’s Five Forces Analysis
7. Value Chain Analysis
8. Global Beef Market Attractiveness Analysis by Slaughter Method
9. Global Beef Market Attractiveness Analysis by Cut
10. Global Beef Market Attractiveness Analysis by Region
11. Global Beef Market: Dynamics
12. Global Beef Market Share by Slaughter Method (2022 & 2030)
13. Global Beef Market Share by Cut (2022 & 2030)
14. Global Beef Market Share by Regions (2022 & 2030)
15. Global Beef Market Share by Company (2021)
Research has its special purpose to undertake marketing efficiently. In this competitive scenario, businesses need information across all industry verticals; the information about customer wants, market demand, competition, industry trends, distribution channels etc. This information needs to be updated regularly because businesses operate in a dynamic environment. Our organization, The Brainy Insights incorporates scientific and systematic research procedures in order to get proper market insights and industry analysis for overall business success. The analysis consists of studying the market from a miniscule level wherein we implement statistical tools which helps us in examining the data with accuracy and precision.
Our research reports feature both; quantitative and qualitative aspects for any market. Qualitative information for any market research process are fundamental because they reveal the customer needs and wants, usage and consumption for any product/service related to a specific industry. This in turn aids the marketers/investors in knowing certain perceptions of the customers. Qualitative research can enlighten about the different product concepts and designs along with unique service offering that in turn, helps define marketing problems and generate opportunities. On the other hand, quantitative research engages with the data collection process through interviews, e-mail interactions, surveys and pilot studies. Quantitative aspects for the market research are useful to validate the hypotheses generated during qualitative research method, explore empirical patterns in the data with the help of statistical tools, and finally make the market estimations.
The Brainy Insights offers comprehensive research and analysis, based on a wide assortment of factual insights gained through interviews with CXOs and global experts and secondary data from reliable sources. Our analysts and industry specialist assume vital roles in building up statistical tools and analysis models, which are used to analyse the data and arrive at accurate insights with exceedingly informative research discoveries. The data provided by our organization have proven precious to a diverse range of companies, facilitating them to address issues such as determining which products/services are the most appealing, whether or not customers use the product in the manner anticipated, the purchasing intentions of the market and many others.
Our research methodology encompasses an idyllic combination of primary and secondary initiatives. Key phases involved in this process are listed below:

The phase involves the gathering and collecting of market data and its related information with the help of different sources & research procedures.

The data procurement stage involves in data gathering and collecting through various data sources.
This stage involves in extensive research. These data sources includes:
Purchased Database: Purchased databases play a crucial role in estimating the market sizes irrespective of the domain. Our purchased database includes:
Primary Research: The Brainy Insights interacts with leading companies and experts of the concerned domain to develop the analyst team’s market understanding and expertise. It improves and substantiates every single data presented in the market reports. Primary research mainly involves in telephonic interviews, E-mail interactions and face-to-face interviews with the raw material providers, manufacturers/producers, distributors, & independent consultants. The interviews that we conduct provides valuable data on market size and industry growth trends prevailing in the market. Our organization also conducts surveys with the various industry experts in order to gain overall insights of the industry/market. For instance, in healthcare industry we conduct surveys with the pharmacists, doctors, surgeons and nurses in order to gain insights and key information of a medical product/device/equipment which the customers are going to usage. Surveys are conducted in the form of questionnaire designed by our own analyst team. Surveys plays an important role in primary research because surveys helps us to identify the key target audiences of the market. Additionally, surveys helps to identify the key target audience engaged with the market. Our survey team conducts the survey by targeting the key audience, thus gaining insights from them. Based on the perspectives of the customers, this information is utilized to formulate market strategies. Moreover, market surveys helps us to understand the current competitive situation of the industry. To be precise, our survey process typically involve with the 360 analysis of the market. This analytical process begins by identifying the prospective customers for a product or service related to the market/industry to obtain data on how a product/service could fit into customers’ lives.

Secondary Research: The secondary data sources includes information published by the on-profit organizations such as World bank, WHO, company fillings, investor presentations, annual reports, national government documents, statistical databases, blogs, articles, white papers and others. From the annual report, we analyse a company’s revenue to understand the key segment and market share of that organization in a particular region. We analyse the company websites and adopt the product mapping technique which is important for deriving the segment revenue. In the product mapping method, we select and categorize the products offered by the companies catering to domain specific market, deduce the product revenue for each of the companies so as to get overall estimation of the market size. We also source data and analyses trends based on information received from supply side and demand side intermediaries in the value chain. The supply side denotes the data gathered from supplier, distributor, wholesaler and the demand side illustrates the data gathered from the end customers for respective market domain.

The supply side for a domain specific market is analysed by:
The demand side for the market is estimated through:
In-house Library: Apart from these third-party sources, we have our in-house library of qualitative and quantitative information. Our in-house database includes market data for various industry and domains. These data are updated on regular basis as per the changing market scenario. Our library includes, historic databases, internal audit reports and archives.
Sometimes there are instances where there is no metadata or raw data available for any domain specific market. For those cases, we use our expertise to forecast and estimate the market size in order to generate comprehensive data sets. Our analyst team adopt a robust research technique in order to produce the estimates:
Data Synthesis: This stage involves the analysis & mapping of all the information obtained from the previous step. It also involves in scrutinizing the data for any discrepancy observed while data gathering related to the market. The data is collected with consideration to the heterogeneity of sources. Robust scientific techniques are in place for synthesizing disparate data sets and provide the essential contextual information that can orient market strategies. The Brainy Insights has extensive experience in data synthesis where the data passes through various stages:


Market Deduction & Formulation: The final stage comprises of assigning data points at appropriate market spaces so as to deduce feasible conclusions. Analyst perspective & subject matter expert based holistic form of market sizing coupled with industry analysis also plays a crucial role in this stage.
This stage involves in finalization of the market size and numbers that we have collected from data integration step. With data interpolation, it is made sure that there is no gap in the market data. Successful trend analysis is done by our analysts using extrapolation techniques, which provide the best possible forecasts for the market.
Data Validation & Market Feedback: Validation is the most important step in the process. Validation & re-validation via an intricately designed process helps us finalize data-points to be used for final calculations.

The Brainy Insights interacts with leading companies and experts of the concerned domain to develop the analyst team’s market understanding and expertise. It improves and substantiates every single data presented in the market reports. The data validation interview and discussion panels are typically composed of the most experienced industry members. The participants include, however, are not limited to:
Moreover, we always validate our data and findings through primary respondents from all the major regions we are working on.


Free Customization
Fortune 500 Clients
Free Yearly Update On Purchase Of Multi/Corporate License
Companies Served Till Date