- +1-315-215-1633
- sales@thebrainyinsights.com

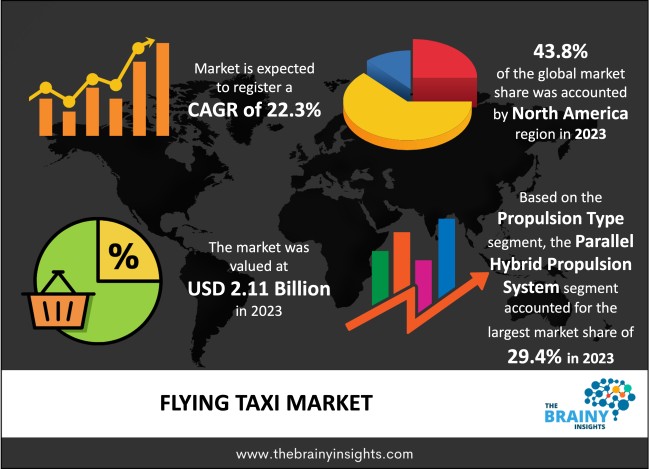
Global flying taxi market is expected to reach USD 15.79 billion by 2033, at a CAGR of 22.3% from 2024 to 2033. Global flying taxi market is witnessing a considerable growth owing to increasing traffic congestion on roads across the globe. With the advent of modern transportation, diverse options are available for commuters. The substantial growth in the global population is a significant factor contributing to this surge in travel demand. Consequently, nations worldwide face severe traffic congestion issues that could hamper smooth mobility systems. Flying taxis are an innovative technological breakthrough offering feasible solutions for easier accessibility and connectivity between workplaces or other desired locations; it's compact aircraft adept at enabling daily transfers with ease. Flying taxis are poised to become the swiftest mode of transport, boasting reduced traffic congestion and providing a seamless experience for consumers. All passengers require is their arrival at vertiports on scooters or other personal mobility vehicles, where they can easily hop onto air taxis like any regular cab.
Flying taxi is a small commercial aircraft which makes short flights on demand. Sometimes referred to as "air taxis," and offers the limited number of passengers a short flight within or between urban areas. The flying taxies can take off and land vertically and mainly flies several hundred meters above the ground. These taxis are generally propelled by a jet engine at the rear and used for the flying over traffic jams and problems and in-between high-rise buildings. Like helicopters, the flying taxi, don't need a runway, but unlike helicopters are quiet and cheap. The market holds the enormous potential, and flying taxis is expected to be commercially available in few countries from 2027. With the development of essential infrastructure, passengers can travel in flying taxis at prices comparable to those of regular taxi cabs. For suppliers, it is, therefore, essential to offer reliable technology at a low price.
Currently, over a hundred projects on flying taxi are in development across the globe. With the advancements in the autonomous flight technology, electric propulsion, as well as 5G communications, the market for flying taxi is expected to grow in the upcoming years. Furthermore, flying taxi offers a huge opportunity to deal with the traffic jams and adds a third dimension to the urban transportation matrix. However, the market is still in the infancy stage and requires more time to become the mass phenomena. The number of companies participating in the market has steadily grown over the decade. In addition to this, many companies are heavily investing in research and development for the development of flying taxi. Moreover, companies are focusing on offering on-demand flying taxi services that are powered by the all-electric, vertical take-off and landing jet. However, the market is facing enormous regulatory and technical challenges in getting their respective flying taxi services off the ground.
Get an overview of this study by requesting a free sample
Increasing research and development activities for the flying taxi is one of the vital factors driving the growth of the market. Many companies are heavily investing the research and development activities in developing and commercializing flying taxi in the market, and to gain a competitive advantage by launching it first in the marketplace. In addition, the flying taxi is a very technological concept, in terms of fuel, software and services, and propulsion type, and requires enormous research to develop the product. Thus, many companies are partnering with other companies to build the flying taxi-related components. For instance, in 2017, Uber signed a deal with NASA, to develop traffic systems for its flying car project which is going to start testing in 2020.
The problem of traffic jams and congestion across the globe has risen to a more significant extent, with the increasing population and growing number of vehicles operating on the road. This has resulted in severe issues such as air pollution and environmental hazard. Therefore, the demand for flying taxi is growing, as it helps to reduce the traffic congestion in the cities, by transporting the passengers by air means. Thus, increasing traffic congestion across the globe is positively influencing the growth of flying taxi market.
Regulations remains the primary challenge for the flying taxi market, which is likely to restrain the market growth over the forecast period. This regulation presents barriers for commercial launch, from scaling to ultimate full viability. The Flying taxis requires several certifications such as Part 135 certification from the Federal Aviation Administration (FAA) to run as passenger transportation. Thus, to pass these strict regulations and guideline requires a lot of time, which is expected to hamper the growth of the market.
Flying taxi is anticipated to have a profound impact when it comes to society, the economy and the environment. It will reshape how people travel in the cities they have the potential to disrupt conventional transport systems like highways, trains and buses, put a dent in the pollution around urban centres, and make for much faster commutes, therefore making society more efficient and productive as a whole. The flying taxis are expected to have zero operational emissions and be quiet enough to operate in cities without noise pollution. Ride-hailing service companies such as Uber partnered with the Boeing, to commercialize the flying taxi concept, is anticipated to offer various growth opportunities in the market.
The current infrastructure in the world may be able to support initial trials, but, it is unable to accommodate these businesses at a commercial scale. The infrastructure includes landing pads with passenger facilities, parking for air taxis and recharging points for their batteries. Current infrastructure is not that developed to support the urban air mobility at commercial scale and will need custom-built, large-scale infrastructure. Thus, the infrastructure barrier is one of the critical challenges, hampering the launch of flying taxi at commercial level.
The global flying taxi market has been segmented based on component, technology, propulsion type, aircraft type, passenger capacity, and regions.
The regions analyzed for the market include North America, Europe, South America, Asia Pacific, and the Middle East and Africa. The North America region emerged as the largest market for the flying taxi market, with a 43.8% share of the market revenue in 2023.
The key players are now concentrating on implementing strategies such as adopting new technology, product innovations, mergers & acquisitions, joint venture, alliances and partnerships to improve their market position in the global flying taxi industry.
In January 2019, Boeing announced the successful testing of its first test flight of air taxi in the U.S. Both Boeing and Textron, the subsidiary of Bell have a partnership with Uber to map out plans for an air taxi service called Uber Air.
In October 2019, Volocopter GmbH, a German startup backed by Intel Corp. and Daimler AG, announced that its volocopter, an electrically powered air taxi, took its first public test flight in Germany. The Volocopter GmbH expects to offer its first commercial trips in the next three to five years.
As per The Brainy Insights, the size of the flying taxi market was valued at USD 2.11 billion in 2023 and is anticipated to reach USD 15.79 billion by 2033.
Global flying taxi market is growing at a CAGR of 22.3% during the forecast period 2024-2033.
The North America region emerged as the largest market for the flying taxi.
Increasing research and development activities is the key driving factor for the flying taxi market.
Stringent government regulations may hamper the market growth.
Growing developments in the air urban mobility will provide huge opportunities to the market.
Key players are Airbus, Beechcraft Corporation, Boeing, Dassault Aviation SA, and Volocopter GmbH
1. Introduction
1.1. Objectives of the Study
1.2. Market Definition
1.3. Research Scope
1.4. Currency
1.5. Key Target Audience
2. Research Methodology and Assumptions
3. Executive Summary
4. Premium Insights
4.1. Porter’s Five Forces Analysis
4.2. Value Chain Analysis
4.3. Top Investment Pockets
4.3.1. Market Attractiveness Analysis By Component
4.3.2. Market Attractiveness Analysis By Technology
4.3.3. Market Attractiveness Analysis By Propulsion Type
4.3.4. Market Attractiveness Analysis By Aircraft Type
4.3.5. Market Attractiveness Analysis By Passenger Capacity
4.3.6. Market Attractiveness Analysis By Region
4.4. Industry Trends
5. Market Dynamics
5.1. Market Evaluation
5.2. Drivers
5.2.1. Rising number of investments in research & development
5.2.2. Increasing traffic congestion on the roads
5.3. Restrains
5.3.1. Stringent government regulations
5.4. Opportunities
5.4.1. Growing developments in the air urban mobility
5.5. Challenges
5.5.1. Infrastructure barriers
6. Global Flying Taxi Market Analysis and Forecast, By Component
6.1. Segment Overview
6.2. Software
6.3. Hardware
6.4. Services
7. Global Flying Taxi Market Analysis and Forecast, By Technology
7.1. Segment Overview
7.2. Autonomous
7.3. Semi-Autonomous
7.4. Manual
8. Global Flying Taxi Market Analysis and Forecast, By Propulsion Type
8.1. Segment Overview
8.2. Parallel Hybrid
8.3. Electric
8.4. Turboshaft
8.5. Turboelectric
8.6. Others
9. Global Flying Taxi Market Analysis and Forecast, By Aircraft Type
9.1. Segment Overview
9.2. Multicopter
9.3. Side-By-Side Aircraft
9.4. Tiltwing Aircraft
9.5. Tiltrotor Aircraft
9.6. Others
10. Global Flying Taxi Market Analysis and Forecast, By Passenger Capacity
10.1. Segment Overview
10.2. Less Than 5
10.3. Less Than 10
10.4. More Than 10
11. Global Flying Taxi Market Analysis and Forecast, By Regional Analysis
11.1. Segment Overview
11.2. North America
11.2.1. U.S.
11.2.2. Canada
11.2.3. Mexico
11.3. Europe
11.3.1. Germany
11.3.2. France
11.3.3. U.K.
11.3.4. Italy
11.3.5. Spain
11.4. Asia-Pacific
11.4.1. Japan
11.4.2. China
11.4.3. India
11.5. South America
11.5.1. Brazil
11.6. Middle East and Africa
11.6.1. UAE
11.6.2. South Africa
12. Global Flying Taxi Market-Competitive Landscape
12.1. Overview
12.2. Market Share of Key Players in Global Flying Taxi Market
12.2.1. Global Company Market Share
12.2.2. North America Company Market Share
12.2.3. Europe Company Market Share
12.2.4. APAC Company Market Share
12.3. Competitive Situations and Trends
12.3.1. Product Launches and Developments
12.3.2. Partnerships, Collaborations, and Agreements
12.3.3. Mergers & Acquisitions
12.3.4. Expansions
13. Company Profiles
13.1. Airbus
13.1.1. Business Overview
13.1.2. Company Snapshot
13.1.3. Company Market Share Analysis
13.1.4. Company Product Portfolio
13.1.5. Recent Developments
13.1.6. SWOT Analysis
13.2. Beechcraft Corporation
13.2.1. Business Overview
13.2.2. Company Snapshot
13.2.3. Company Market Share Analysis
13.2.4. Company Product Portfolio
13.2.5. Recent Developments
13.2.6. SWOT Analysis
13.3. Boeing
13.3.1. Business Overview
13.3.2. Company Snapshot
13.3.3. Company Market Share Analysis
13.3.4. Company Product Portfolio
13.3.5. Recent Developments
13.3.6. SWOT Analysis
13.4. Dassault Aviation SA
13.4.1. Business Overview
13.4.2. Company Snapshot
13.4.3. Company Market Share Analysis
13.4.4. Company Product Portfolio
13.4.5. Recent Developments
13.4.6. SWOT Analysis
13.5. Ehang
13.5.1. Business Overview
13.5.2. Company Snapshot
13.5.3. Company Market Share Analysis
13.5.4. Company Product Portfolio
13.5.5. Recent Developments
13.5.6. SWOT Analysis
13.6. Volocopter GmbH
13.6.1. Business Overview
13.6.2. Company Snapshot
13.6.3. Company Market Share Analysis
13.6.4. Company Product Portfolio
13.6.5. Recent Developments
13.6.6. SWOT Analysis
13.7. Uber
13.7.1. Business Overview
13.7.2. Company Snapshot
13.7.3. Company Market Share Analysis
13.7.4. Company Product Portfolio
13.7.5. Recent Developments
13.7.6. SWOT Analysis
13.8. Embraer
13.8.1. Business Overview
13.8.2. Company Snapshot
13.8.3. Company Market Share Analysis
13.8.4. Company Product Portfolio
13.8.5. Recent Developments
13.8.6. SWOT Analysis
13.9. Gulfstream
13.9.1. Business Overview
13.9.2. Company Snapshot
13.9.3. Company Market Share Analysis
13.9.4. Company Product Portfolio
13.9.5. Recent Developments
13.9.6. SWOT Analysis
13.10. Cessna
13.10.1. Business Overview
13.10.2. Company Snapshot
13.10.3. Company Market Share Analysis
13.10.4. Company Product Portfolio
13.10.5. Recent Developments
13.10.6. SWOT Analysis
13.11. Joby Aviation
13.11.1. Business Overview
13.11.2. Company Snapshot
13.11.3. Company Market Share Analysis
13.11.4. Company Product Portfolio
13.11.5. Recent Developments
13.11.6. SWOT Analysis
13.12. Terrafugia
13.12.1. Business Overview
13.12.2. Company Snapshot
13.12.3. Company Market Share Analysis
13.12.4. Company Product Portfolio
13.12.5. Recent Developments
13.12.6. SWOT Analysis
13.13. AeroMobil s.r.o. AeroMobil
13.13.1. Business Overview
13.13.2. Company Snapshot
13.13.3. Company Market Share Analysis
13.13.4. Company Product Portfolio
13.13.5. Recent Developments
13.13.6. SWOT Analysis
List of Table
1. Global Flying Taxi Market, By Component, 2020–2033 (USD Billion)
2. Global Software, Flying Taxi Market, By Region, 2020–2033 (USD Billion)
3. Global Hardware, Flying Taxi Market, By Region, 2020–2033 (USD Billion)
4. Global Services, Flying Taxi Market, By Region, 2020–2033 (USD Billion)
5. Global Flying Taxi Market, By Technology, 2020–2033 (USD Billion)
6. Global Autonomous Flying Taxi Market, By Region, 2020–2033 (USD Billion)
7. Global Semi-Autonomous Flying Taxi Market, By Region, 2020–2033 (USD Billion)
8. Global Manual Flying Taxi Market, By Region, 2020–2033 (USD Billion)
9. Global Flying Taxi Market, By Propulsion Type, 2020–2033 (USD Billion)
10. Global Parallel Hybrid Flying Taxi Market, By Region, 2020–2033 (USD Billion)
11. Global Electric Flying Taxi Market, By Region, 2020–2033 (USD Billion)
12. Global Turboshaft Flying Taxi Market, By Region, 2020–2033 (USD Billion)
13. Global Turboelectric Flying Taxi Market, By Region, 2020–2033 (USD Billion)
14. Global Others Flying Taxi Market, By Region, 2020–2033 (USD Billion)
15. Global Flying Taxi Market, By Aircraft Type, 2020–2033 (USD Billion)
16. Global Multicopter Flying Taxi Market, By Region, 2020–2033 (USD Billion)
17. Global Side-By-Side Aircraft Flying Taxi Market, By Region, 2020–2033 (USD Billion)
18. Global Tiltwing Aircraft, Aircraft Flying Taxi Market, By Region, 2020–2033 (USD Billion)
19. Global Tiltrotor Aircraft, Aircraft Flying Taxi Market, By Region, 2020–2033 (USD Billion)
20. Global Others Aircraft Flying Taxi Market, By Region, 2020–2033 (USD Billion)
21. Global Flying Taxi Market, By Passenger Capacity, 2020–2033 (USD Billion)
22. Global Less Than 5 Flying Taxi Market, By Region, 2020–2033 (USD Billion)
23. Global Less Than 10 Flying Taxi Market, By Region, 2020–2033 (USD Billion)
24. Global More Than 10 Flying Taxi Market, By Region, 2020–2033 (USD Billion)
25. Global Flying Taxi Market, By Region, 2020–2033 (USD Billion)
26. Global Flying Taxi Market, By North America, 2020–2033 (USD Billion)
27. North America Flying Taxi Market, By Component, 2020–2033 (USD Billion)
28. North America Flying Taxi Market, By Technology, 2020–2033 (USD Billion)
29. North America Flying Taxi Market, By Propulsion Type, 2020–2033 (USD Billion)
30. North America Flying Taxi Market, By Aircraft Type, 2020–2033 (USD Billion)
31. North America Flying Taxi Market, By Passenger Capacity, 2020–2033 (USD Billion)
32. U.S. Flying Taxi Market, By Component, 2020–2033 (USD Billion)
33. U.S. Flying Taxi Market, By Technology, 2020–2033 (USD Billion)
34. U.S. Flying Taxi Market, By Propulsion Type, 2020–2033 (USD Billion)
35. U.S. Flying Taxi Market, By Aircraft Type, 2020–2033 (USD Billion)
36. U.S. Flying Taxi Market, By Passenger Capacity, 2020–2033 (USD Billion)
37. Canada Flying Taxi Market, By Component, 2020–2033 (USD Billion)
38. Canada Flying Taxi Market, By Technology, 2020–2033 (USD Billion)
39. Canada Flying Taxi Market, By Propulsion Type, 2020–2033 (USD Billion)
40. Canada Flying Taxi Market, By Aircraft Type, 2020–2033 (USD Billion)
41. Canada Flying Taxi Market, By Passenger Capacity, 2020–2033 (USD Billion)
42. Mexico Flying Taxi Market, By Component, 2020–2033 (USD Billion)
43. Mexico Flying Taxi Market, By Technology, 2020–2033 (USD Billion)
44. Mexico Flying Taxi Market, By Propulsion Type, 2020–2033 (USD Billion)
45. Mexico Flying Taxi Market, By Aircraft Type, 2020–2033 (USD Billion)
46. Mexico Flying Taxi Market, By Passenger Capacity, 2020–2033 (USD Billion)
47. Europe Flying Taxi Market, By Component, 2020–2033 (USD Billion)
48. Europe Flying Taxi Market, By Technology, 2020–2033 (USD Billion)
49. Europe Flying Taxi Market, By Propulsion Type, 2020–2033 (USD Billion)
50. Europe Flying Taxi Market, By Aircraft Type, 2020–2033 (USD Billion)
51. Europe Flying Taxi Market, By Passenger Capacity, 2020–2033 (USD Billion)
52. Germany Flying Taxi Market, By Component, 2020–2033 (USD Billion)
53. Germany Flying Taxi Market, By Technology, 2020–2033 (USD Billion)
54. Germany Flying Taxi Market, By Propulsion Type, 2020–2033 (USD Billion)
55. Germany Flying Taxi Market, By Aircraft Type, 2020–2033 (USD Billion)
56. Germany Flying Taxi Market, By Passenger Capacity, 2020–2033 (USD Billion)
57. France Flying Taxi Market, By Component, 2020–2033 (USD Billion)
58. France Flying Taxi Market, By Technology, 2020–2033 (USD Billion)
59. France Flying Taxi Market, By Propulsion Type, 2020–2033 (USD Billion)
60. France Flying Taxi Market, By Aircraft Type, 2020–2033 (USD Billion)
61. France Flying Taxi Market, By Passenger Capacity, 2020–2033 (USD Billion)
62. U.K. Flying Taxi Market, By Component, 2020–2033 (USD Billion)
63. U.K. Flying Taxi Market, By Technology, 2020–2033 (USD Billion)
64. U.K. Flying Taxi Market, By Propulsion Type, 2020–2033 (USD Billion)
65. U.K. Flying Taxi Market, By Aircraft Type, 2020–2033 (USD Billion)
66. U.K. Flying Taxi Market, By Passenger Capacity, 2020–2033 (USD Billion)
67. Italy Flying Taxi Market, By Component, 2020–2033 (USD Billion)
68. Italy Flying Taxi Market, By Technology, 2020–2033 (USD Billion)
69. Italy Flying Taxi Market, By Propulsion Type, 2020–2033 (USD Billion)
70. Italy Flying Taxi Market, By Aircraft Type, 2020–2033 (USD Billion)
71. Italy Flying Taxi Market, By Passenger Capacity, 2020–2033 (USD Billion)
72. Spain Flying Taxi Market, By Component, 2020–2033 (USD Billion)
73. Spain Flying Taxi Market, By Technology, 2020–2033 (USD Billion)
74. Spain Flying Taxi Market, By Propulsion Type, 2020–2033 (USD Billion)
75. Spain Flying Taxi Market, By Aircraft Type, 2020–2033 (USD Billion)
76. Spain Flying Taxi Market, By Passenger Capacity, 2020–2033 (USD Billion)
77. Asia Pacific Flying Taxi Market, By Component, 2020–2033 (USD Billion)
78. Asia Pacific Flying Taxi Market, By Technology, 2020–2033 (USD Billion)
79. Asia Pacific Flying Taxi Market, By Propulsion Type, 2020–2033 (USD Billion)
80. Asia Pacific Flying Taxi Market, By Aircraft Type, 2020–2033 (USD Billion)
81. Asia Pacific Flying Taxi Market, By Passenger Capacity, 2020–2033 (USD Billion)
82. Japan Flying Taxi Market, By Component, 2020–2033 (USD Billion)
83. Japan Flying Taxi Market, By Technology, 2020–2033 (USD Billion)
84. Japan Flying Taxi Market, By Propulsion Type, 2020–2033 (USD Billion)
85. Japan Flying Taxi Market, By Aircraft Type, 2020–2033 (USD Billion)
86. Japan Flying Taxi Market, By Passenger Capacity, 2020–2033 (USD Billion)
87. China Flying Taxi Market, By Component, 2020–2033 (USD Billion)
88. China Flying Taxi Market, By Technology, 2020–2033 (USD Billion)
89. China Flying Taxi Market, By Propulsion Type, 2020–2033 (USD Billion)
90. China Flying Taxi Market, By Aircraft Type, 2020–2033 (USD Billion)
91. China Flying Taxi Market, By Passenger Capacity, 2020–2033 (USD Billion)
92. India Flying Taxi Market, By Component, 2020–2033 (USD Billion)
93. India Flying Taxi Market, By Technology, 2020–2033 (USD Billion)
94. India Flying Taxi Market, By Propulsion Type, 2020–2033 (USD Billion)
95. India Flying Taxi Market, By Aircraft Type, 2020–2033 (USD Billion)
96. India Flying Taxi Market, By Passenger Capacity, 2020–2033 (USD Billion)
97. South America Flying Taxi Market, By Component, 2020–2033 (USD Billion)
98. South America Flying Taxi Market, By Technology, 2020–2033 (USD Billion)
99. South America Flying Taxi Market, By Propulsion Type, 2020–2033 (USD Billion)
100. South America Flying Taxi Market, By Aircraft Type, 2020–2033 (USD Billion)
101. South America Flying Taxi Market, By Passenger Capacity, 2020–2033 (USD Billion)
102. Brazil Flying Taxi Market, By Component, 2020–2033 (USD Billion)
103. Brazil Flying Taxi Market, By Technology, 2020–2033 (USD Billion)
104. Brazil Flying Taxi Market, By Propulsion Type, 2020–2033 (USD Billion)
105. Brazil Flying Taxi Market, By Aircraft Type, 2020–2033 (USD Billion)
106. Brazil Flying Taxi Market, By Passenger Capacity, 2020–2033 (USD Billion)
107. Middle East and Africa Flying Taxi Market, By Component, 2020–2033 (USD Billion)
108. Middle East and Africa Flying Taxi Market, By Technology, 2020–2033 (USD Billion)
109. Middle East and Africa Flying Taxi Market, By Propulsion Type, 2020–2033 (USD Billion)
110. Middle East and Africa Flying Taxi Market, By Aircraft Type, 2020–2033 (USD Billion)
111. Middle East and Africa Flying Taxi Market, By Passenger Capacity, 2020–2033 (USD Billion)
112. UAE Flying Taxi Market, By Component, 2020–2033 (USD Billion)
113. UAE Flying Taxi Market, By Technology, 2020–2033 (USD Billion)
114. UAE Flying Taxi Market, By Propulsion Type, 2020–2033 (USD Billion)
115. UAE Flying Taxi Market, By Aircraft Type, 2020–2033 (USD Billion)
116. UAE Flying Taxi Market, By Passenger Capacity, 2020–2033 (USD Billion)
117. South Africa Flying Taxi Market, By Component, 2020–2033 (USD Billion)
118. South Africa Flying Taxi Market, By Technology, 2020–2033 (USD Billion)
119. South Africa Flying Taxi Market, By Propulsion Type, 2020–2033 (USD Billion)
120. South Africa Flying Taxi Market, By Aircraft Type, 2020–2033 (USD Billion)
121. South Africa Flying Taxi Market, By Passenger Capacity, 2020–2033 (USD Billion)
List of Figures
1. Global Flying Taxi Market Segmentation
2. Flying Taxi Market: Research Methodology
3. Market Size Estimation Methodology: Bottom-Up Approach
4. Market Size Estimation Methodology: Top-Down Approach
5. Data Triangulation
6. Porter’s Five Forces Analysis
7. Value Chain Analysis
8. Global Flying Taxi Market Attractiveness Analysis By Component
9. Global Flying Taxi Market Attractiveness Analysis By Technology
10. Global Flying Taxi Market Attractiveness Analysis By Propulsion Type
11. Global Flying Taxi Market Attractiveness Analysis By Aircraft Type
12. Global Flying Taxi Market Attractiveness Analysis By Passenger Capacity
13. Global Flying Taxi Market Attractiveness Analysis By Region
14. Global Flying Taxi Market: Dynamics
15. Global Flying Taxi Market Share By Component (2023 & 2033)
16. Global Flying Taxi Market Share By Technology (2023 & 2033)
17. Global Flying Taxi Market Share By Propulsion Type (2023 & 2033)
18. Global Flying Taxi Market Share By Aircraft Type (2023 & 2033)
19. Global Flying Taxi Market Share By Passenger Capacity (2023 & 2033)
20. Global Flying Taxi Market Share by Regions (2023 & 2033)
21. Global Flying Taxi Market Share by Company (2023)
This study forecasts revenue at global, regional, and country levels from 2020 to 2033. The Brainy Insights has segmented the global flying taxi market on the basis of below mentioned segments:
Global Flying Taxi Market by Component:
Global Flying Taxi Market by Technology:
Global Flying Taxi Market by Propulsion Type:
Global Flying Taxi Market by Aircraft Type:
Global Flying Taxi Market by Passenger Capacity:
Global Flying Taxi Market by Region:
Research has its special purpose to undertake marketing efficiently. In this competitive scenario, businesses need information across all industry verticals; the information about customer wants, market demand, competition, industry trends, distribution channels etc. This information needs to be updated regularly because businesses operate in a dynamic environment. Our organization, The Brainy Insights incorporates scientific and systematic research procedures in order to get proper market insights and industry analysis for overall business success. The analysis consists of studying the market from a miniscule level wherein we implement statistical tools which helps us in examining the data with accuracy and precision.
Our research reports feature both; quantitative and qualitative aspects for any market. Qualitative information for any market research process are fundamental because they reveal the customer needs and wants, usage and consumption for any product/service related to a specific industry. This in turn aids the marketers/investors in knowing certain perceptions of the customers. Qualitative research can enlighten about the different product concepts and designs along with unique service offering that in turn, helps define marketing problems and generate opportunities. On the other hand, quantitative research engages with the data collection process through interviews, e-mail interactions, surveys and pilot studies. Quantitative aspects for the market research are useful to validate the hypotheses generated during qualitative research method, explore empirical patterns in the data with the help of statistical tools, and finally make the market estimations.
The Brainy Insights offers comprehensive research and analysis, based on a wide assortment of factual insights gained through interviews with CXOs and global experts and secondary data from reliable sources. Our analysts and industry specialist assume vital roles in building up statistical tools and analysis models, which are used to analyse the data and arrive at accurate insights with exceedingly informative research discoveries. The data provided by our organization have proven precious to a diverse range of companies, facilitating them to address issues such as determining which products/services are the most appealing, whether or not customers use the product in the manner anticipated, the purchasing intentions of the market and many others.
Our research methodology encompasses an idyllic combination of primary and secondary initiatives. Key phases involved in this process are listed below:

The phase involves the gathering and collecting of market data and its related information with the help of different sources & research procedures.

The data procurement stage involves in data gathering and collecting through various data sources.
This stage involves in extensive research. These data sources includes:
Purchased Database: Purchased databases play a crucial role in estimating the market sizes irrespective of the domain. Our purchased database includes:
Primary Research: The Brainy Insights interacts with leading companies and experts of the concerned domain to develop the analyst team’s market understanding and expertise. It improves and substantiates every single data presented in the market reports. Primary research mainly involves in telephonic interviews, E-mail interactions and face-to-face interviews with the raw material providers, manufacturers/producers, distributors, & independent consultants. The interviews that we conduct provides valuable data on market size and industry growth trends prevailing in the market. Our organization also conducts surveys with the various industry experts in order to gain overall insights of the industry/market. For instance, in healthcare industry we conduct surveys with the pharmacists, doctors, surgeons and nurses in order to gain insights and key information of a medical product/device/equipment which the customers are going to usage. Surveys are conducted in the form of questionnaire designed by our own analyst team. Surveys plays an important role in primary research because surveys helps us to identify the key target audiences of the market. Additionally, surveys helps to identify the key target audience engaged with the market. Our survey team conducts the survey by targeting the key audience, thus gaining insights from them. Based on the perspectives of the customers, this information is utilized to formulate market strategies. Moreover, market surveys helps us to understand the current competitive situation of the industry. To be precise, our survey process typically involve with the 360 analysis of the market. This analytical process begins by identifying the prospective customers for a product or service related to the market/industry to obtain data on how a product/service could fit into customers’ lives.

Secondary Research: The secondary data sources includes information published by the on-profit organizations such as World bank, WHO, company fillings, investor presentations, annual reports, national government documents, statistical databases, blogs, articles, white papers and others. From the annual report, we analyse a company’s revenue to understand the key segment and market share of that organization in a particular region. We analyse the company websites and adopt the product mapping technique which is important for deriving the segment revenue. In the product mapping method, we select and categorize the products offered by the companies catering to domain specific market, deduce the product revenue for each of the companies so as to get overall estimation of the market size. We also source data and analyses trends based on information received from supply side and demand side intermediaries in the value chain. The supply side denotes the data gathered from supplier, distributor, wholesaler and the demand side illustrates the data gathered from the end customers for respective market domain.

The supply side for a domain specific market is analysed by:
The demand side for the market is estimated through:
In-house Library: Apart from these third-party sources, we have our in-house library of qualitative and quantitative information. Our in-house database includes market data for various industry and domains. These data are updated on regular basis as per the changing market scenario. Our library includes, historic databases, internal audit reports and archives.
Sometimes there are instances where there is no metadata or raw data available for any domain specific market. For those cases, we use our expertise to forecast and estimate the market size in order to generate comprehensive data sets. Our analyst team adopt a robust research technique in order to produce the estimates:
Data Synthesis: This stage involves the analysis & mapping of all the information obtained from the previous step. It also involves in scrutinizing the data for any discrepancy observed while data gathering related to the market. The data is collected with consideration to the heterogeneity of sources. Robust scientific techniques are in place for synthesizing disparate data sets and provide the essential contextual information that can orient market strategies. The Brainy Insights has extensive experience in data synthesis where the data passes through various stages:


Market Deduction & Formulation: The final stage comprises of assigning data points at appropriate market spaces so as to deduce feasible conclusions. Analyst perspective & subject matter expert based holistic form of market sizing coupled with industry analysis also plays a crucial role in this stage.
This stage involves in finalization of the market size and numbers that we have collected from data integration step. With data interpolation, it is made sure that there is no gap in the market data. Successful trend analysis is done by our analysts using extrapolation techniques, which provide the best possible forecasts for the market.
Data Validation & Market Feedback: Validation is the most important step in the process. Validation & re-validation via an intricately designed process helps us finalize data-points to be used for final calculations.

The Brainy Insights interacts with leading companies and experts of the concerned domain to develop the analyst team’s market understanding and expertise. It improves and substantiates every single data presented in the market reports. The data validation interview and discussion panels are typically composed of the most experienced industry members. The participants include, however, are not limited to:
Moreover, we always validate our data and findings through primary respondents from all the major regions we are working on.


Free Customization
Fortune 500 Clients
Free Yearly Update On Purchase Of Multi/Corporate License
Companies Served Till Date