- +1-315-215-1633
- sales@thebrainyinsights.com

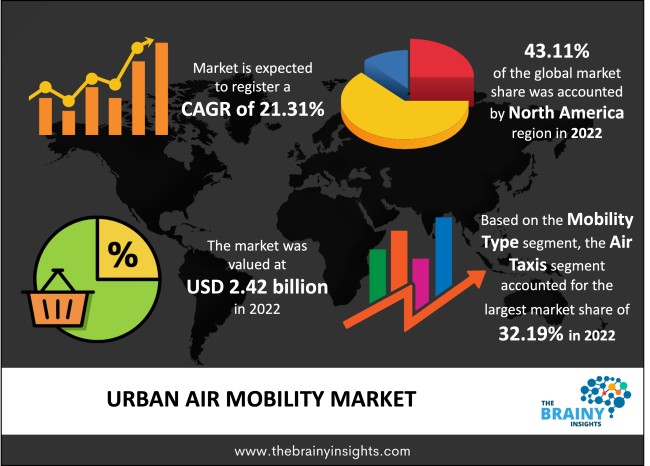
The global urban air mobility market was valued at USD 2.42 Billion in 2022 and grew at a CAGR of 21.31% from 2023 to 2032. The market is expected to reach USD 16.70 Billion by 2032. The demand for urban air mobility is increasing due to the rising need for air travel to transport cargo and passengers.
Urban air mobility, developed in reaction to traffic congestion, uses small, highly automated aircraft to carry people or cargo at lower altitudes in urban and suburban regions. Generally speaking, it refers to current and developing technology, including uncrewed aerial vehicles, electrically driven vertical takeoff and landing aircraft, conventional helicopters, and vertical takeoff and landing aircraft. Multiple electric-powered rotors or fans for lift and propulsion, together with fly-by-wire technologies for control, are characteristics of these aircraft. The flying of vehicles at these altitudes necessitates a high level of awareness of the environment and safety of the vehicle, partly in response to the congested ground transportation system. The UAM ecosystem comprises urban/suburban development, airspace accessibility, operation, and general interaction between the vehicle and its environment.
Get an overview of this study by requesting a free sample
Rising need for fast transportation services: Traffic congestion leads to significant time wasted every day somewhere in the world. People become delayed in traffic jams, which results in fuel loss, decreased productivity, and less time spent with loved ones. Urban air mobility, fueled by cooperation among global governments, tech companies, automakers, and aviation giants, is safer and promises quicker and greener solutions. The UAM idea aims to provide quick and easy mobility solutions by integrating aerial transportation services into urban transportation networks. By incorporating cutting-edge technologies like eVTOL aircraft, UAM can reduce traffic, shorten travel times, and improve city transportation connectivity. Over the next decade, the worldwide commercial unmanned aerial vehicle sector is anticipated to expand, with airports being the primary hubs for regional and international transportation.
High investment: A large initial investment is needed for the heavy and complex machinery of unmanned vehicles. The air transportation is mostly prohibitively expensive. The cost of UAVs is high as they consist of many components that work efficiently to provide an efficient solution. The installation cost makes it more costly; thus, many small or middle-income countries need help to afford the vehicles. Also, the maintenance cost of these unmanned vehicles makes them unaffordable for many developing countries.
Investment in sustainable transport industry: As the second-biggest polluting component and the source of significant energy use, transport raises several environmental concerns. The greenhouse gas emissions from this field are also impacting the climate. Urban air mobility solves this issue by utilizing electric landing aircraft and takeoff. The market is expected to grow positively due to the numerous developments and technological breakthroughs planned, which will boost the adoption of urban air mobility in various cities. Sustainable aviation fuels and cutting-edge propulsion technology by various regional concerned authorities are helping to attain zero carbon emissions and opening up new growth opportunities for the industry.
The regions analyzed for the market include North America, Europe, South America, Asia Pacific, the Middle East, and Africa. North America emerged as the most significant Urban Air Mobility market, with a 43.11% market revenue share in 2022.
North America region will account for the largest market share with revenue growth. Nations such as the U.S. and Canada have a tremendous demand for urban air mobility due to the growing demand for intercity and intracity travel. The presence of major companies in the area, which make significant investments in developing air mobility vehicle prototypes, supports the regional market's expansion. Additionally, the growing use of air taxis for intercity travel is fueling the business expansion in the area.
North America Region Urban Air Mobility Market Share in 2022 - 43.11%
www.thebrainyinsights.com
Check the geographical analysis of this market by requesting a free sample
The mobility type segment is divided into air taxis, cargo air vehicles, personal air vehicles, air ambulance and medical emergency vehicles, air shuttles and air metros, and others. The air taxis segment dominated the market, with a share of around 32.19% in 2022. A tiny commercial aircraft that does on-demand, short flights are called an air taxi. Much work has been done to get air taxis ready to become a viable alternative mode of transportation for those living in developed regions such as Europe and North America.
The operation segment is divided into automated and piloted. The automated segment further includes fully and remotely. The piloted segment dominated the market, with a share of around 67.28% in 2022. Piloted urban air vehicles are still considered safer options for transporting people and cargo than automated ones. Further, piloted air mobility has been there for a longer period.
The platform architecture segment is divided into fixed-wing, rotary-wing and fixed-wing hybrid. The fixed-wing segment dominated the market, with a share of around 43.05% in 2022. Vehicles with fixed wings move through the air to produce lift from their wings. Compared to rotary-wing aircraft, fixed-wing drones are faster, more stable, and have a longer endurance. Fixed-wing aircraft have stationary wings that generate lift and help the aircraft move forward.
The range segment is divided into intracity and intercity. The intracity segment dominated the market, with a share of around 72.93% in 2022. Urban air mobility services are majorly used for intracity transportation. Air mobility services transport passengers and cargo to another city or state. Air transportation is the most effective mode of transportation for intracity travel.
| Attribute | Description |
|---|---|
| Market Size | Revenue (USD Billion) |
| Market size value in 2022 | USD 2.42 Billion |
| Market size value in 2032 | USD 16.70 Billion |
| CAGR (2023 to 2032) | 21.31% |
| Historical data | 2019-2021 |
| Base Year | 2022 |
| Forecast | 2023-2032 |
| Region | The regions analyzed for the market are Asia Pacific, Europe, South America, North America, and Middle East & Africa. Furthermore, the regions are further analyzed at the country level. |
| Segments | Mobility Type, Operation, Platform Architecture and Range |
As per The Brainy Insights, the size of the urban air mobility market was valued USD 2.42 billion in 2022 to USD 16.70 billion by 2032.
Global urban air mobility market is growing at a CAGR of 21.31% during the forecast period 2023-2032.
North America region emerged as the largest market for the urban air mobility.
The market's growth will be influenced by the rising demand for fast transportation.
The high cost can hamper the market growth.
The rising awareness for sustainable transportation mode is providing lucrative opportunities to the market.
1. Introduction
1.1. Objectives of the Study
1.2. Market Definition
1.3. Research Scope
1.4. Currency
1.5. Key Target Audience
2. Research Methodology and Assumptions
3. Executive Summary
4. Premium Insights
4.1. Porter’s Five Forces Analysis
4.2. Value Chain Analysis
4.3. Top Investment Pockets
4.3.1. Market Attractiveness Analysis by Mobility Type
4.3.2. Market Attractiveness Analysis by Operation
4.3.3. Market Attractiveness Analysis by Platform Architecture
4.3.4. Market Attractiveness Analysis by Range
4.3.5. Market Attractiveness Analysis by Region
4.4. Industry Trends
5. Market Dynamics
5.1. Market Evaluation
5.2. Drivers
5.2.1. Increasing demand for faster mode of transportation
5.3. Restraints
5.3.1. High cost
5.4. Opportunities
5.4.1. Increasing investment in sustainable transportation
5.5. Challenges
5.5.1. Requirement of skilled professionals
6. Global Urban Air Mobility Market Analysis and Forecast, By Mobility Type
6.1. Segment Overview
6.2. Air Taxis
6.3. Cargo Air Vehicles
6.4. Personal Air Vehicles
6.5. Air Ambulance and Medical Emergency Vehicles
6.6. Air Shuttles and Air Metros
6.7. Others
7. Global Urban Air Mobility Market Analysis and Forecast, By Operation
7.1. Segment Overview
7.2. Automated
7.2.1. Fully
7.2.2. Remotely
7.3. Piloted
8. Global Urban Air Mobility Market Analysis and Forecast, By Platform Architecture
8.1. Segment Overview
8.2. Fixed Wing
8.3. Rotary Wing
8.4. Fixed Wing Hybrid
9. Global Urban Air Mobility Market Analysis and Forecast, By Range
9.1. Segment Overview
9.2. Intracity
9.3. Intercity
10. Global Urban Air Mobility Market Analysis and Forecast, By Regional Analysis
10.1. Segment Overview
10.2. North America
10.2.1. U.S.
10.2.2. Canada
10.2.3. Mexico
10.3. Europe
10.3.1. Germany
10.3.2. France
10.3.3. U.K.
10.3.4. Italy
10.3.5. Spain
10.4. Asia-Pacific
10.4.1. Japan
10.4.2. China
10.4.3. India
10.5. South America
10.5.1. Brazil
10.6. Middle East and Africa
10.6.1. UAE
10.6.2. South Africa
11. Global Urban Air Mobility Market-Competitive Landscape
11.1. Overview
11.2. Market Share of Key Players in the Urban Air Mobility Market
11.2.1. Global Company Market Share
11.2.2. North America Company Market Share
11.2.3. Europe Company Market Share
11.2.4. APAC Company Market Share
11.3. Competitive Situations and Trends
11.3.1. Product Launches and Developments
11.3.2. Partnerships, Collaborations, and Agreements
11.3.3. Mergers & Acquisitions
11.3.4. Expansions
12. Company Profiles
12.1. Volocopter GmbH
12.1.1. Business Overview
12.1.2. Company Snapshot
12.1.3. Company Market Share Analysis
12.1.4. Company Product Portfolio
12.1.5. Recent Developments
12.1.6. SWOT Analysis
12.2. Bell Textron Inc.
12.2.1. Business Overview
12.2.2. Company Snapshot
12.2.3. Company Market Share Analysis
12.2.4. Company Product Portfolio
12.2.5. Recent Developments
12.2.6. SWOT Analysis
12.3. Uber Technologies, Inc.
12.3.1. Business Overview
12.3.2. Company Snapshot
12.3.3. Company Market Share Analysis
12.3.4. Company Product Portfolio
12.3.5. Recent Developments
12.3.6. SWOT Analysis
12.4. Lockheed Martin Corporation
12.4.1. Business Overview
12.4.2. Company Snapshot
12.4.3. Company Market Share Analysis
12.4.4. Company Product Portfolio
12.4.5. Recent Developments
12.4.6. SWOT Analysis
12.5. Airbus SE
12.5.1. Business Overview
12.5.2. Company Snapshot
12.5.3. Company Market Share Analysis
12.5.4. Company Product Portfolio
12.5.5. Recent Developments
12.5.6. SWOT Analysis
12.6. Lilium Aviation GmbH
12.6.1. Business Overview
12.6.2. Company Snapshot
12.6.3. Company Market Share Analysis
12.6.4. Company Product Portfolio
12.6.5. Recent Developments
12.6.6. SWOT Analysis
12.7. Carter Aviation Technologies LLC
12.7.1. Business Overview
12.7.2. Company Snapshot
12.7.3. Company Market Share Analysis
12.7.4. Company Product Portfolio
12.7.5. Recent Developments
12.7.6. SWOT Analysis
12.8. AirspaceX
12.8.1. Business Overview
12.8.2. Company Snapshot
12.8.3. Company Market Share Analysis
12.8.4. Company Product Portfolio
12.8.5. Recent Developments
12.8.6. SWOT Analysis
12.9. Guangzhou EHang Intelligence Technologies Co. Ltd.
12.9.1. Business Overview
12.9.2. Company Snapshot
12.9.3. Company Market Share Analysis
12.9.4. Company Product Portfolio
12.9.5. Recent Developments
12.9.6. SWOT Analysis
12.10. The Boeing Company
12.10.1. Business Overview
12.10.2. Company Snapshot
12.10.3. Company Market Share Analysis
12.10.4. Company Product Portfolio
12.10.5. Recent Developments
12.10.6. SWOT Analysis
List of Table
1. Global Urban Air Mobility Market, By Mobility Type, 2019-2032 (USD Billion)
2. Global Air Taxis, Urban Air Mobility Market, By Region, 2019-2032 (USD Billion)
3. Global Cargo Air Vehicles, Urban Air Mobility Market, By Region, 2019-2032 (USD Billion)
4. Global Personal Air Vehicles, Urban Air Mobility Market, By Region, 2019-2032 (USD Billion)
5. Global Air Ambulance and Medical Emergency Vehicles, Urban Air Mobility Market, By Region, 2019-2032 (USD Billion)
6. Global Air Shuttles and Air Metros, Urban Air Mobility Market, By Region, 2019-2032 (USD Billion)
7. Global Others, Urban Air Mobility Market, By Region, 2019-2032 (USD Billion)
8. Global Urban Air Mobility Market, By Operation, 2019-2032 (USD Billion)
9. Global Automated, Urban Air Mobility Market, By Region, 2019-2032 (USD Billion)
10. Global Piloted, Urban Air Mobility Market, By Region, 2019-2032 (USD Billion)
11. Global Urban Air Mobility Market, By Platform Architecture, 2019-2032 (USD Billion)
12. Global Fixed Wing, Urban Air Mobility Market, By Region, 2019-2032 (USD Billion)
13. Global Rotary Wing, Urban Air Mobility Market, By Region, 2019-2032 (USD Billion)
14. Global Fixed Wing Hybrid, Urban Air Mobility Market, By Region, 2019-2032 (USD Billion)
15. Global Urban Air Mobility Market, By Range, 2019-2032 (USD Billion)
16. Global Intracity, Urban Air Mobility Market, By Region, 2019-2032 (USD Billion)
17. Global Intercity, Urban Air Mobility Market, By Region, 2019-2032 (USD Billion)
18. Global Urban Air Mobility Market, By Region, 2019-2032 (USD Billion)
19. North America Urban Air Mobility Market, By Mobility Type, 2019-2032 (USD Billion)
20. North America Urban Air Mobility Market, By Operation, 2019-2032 (USD Billion)
21. North America Urban Air Mobility Market, By Platform Architecture, 2019-2032 (USD Billion)
22. North America Urban Air Mobility Market, By Range, 2019-2032 (USD Billion)
23. U.S. Urban Air Mobility Market, By Mobility Type, 2019-2032 (USD Billion)
24. U.S. Urban Air Mobility Market, By Operation, 2019-2032 (USD Billion)
25. U.S. Urban Air Mobility Market, By Platform Architecture, 2019-2032 (USD Billion)
26. U.S. Urban Air Mobility Market, By Range, 2019-2032 (USD Billion)
27. Canada Urban Air Mobility Market, By Mobility Type, 2019-2032 (USD Billion)
28. Canada Urban Air Mobility Market, By Operation, 2019-2032 (USD Billion)
29. Canada Urban Air Mobility Market, By Platform Architecture, 2019-2032 (USD Billion)
30. Canada Urban Air Mobility Market, By Range, 2019-2032 (USD Billion)
31. Mexico Urban Air Mobility Market, By Mobility Type, 2019-2032 (USD Billion)
32. Mexico Urban Air Mobility Market, By Operation, 2019-2032 (USD Billion)
33. Mexico Urban Air Mobility Market, By Platform Architecture, 2019-2032 (USD Billion)
34. Mexico Urban Air Mobility Market, By Range, 2019-2032 (USD Billion)
35. Europe Urban Air Mobility Market, By Mobility Type, 2019-2032 (USD Billion)
36. Europe Urban Air Mobility Market, By Operation, 2019-2032 (USD Billion)
37. Europe Urban Air Mobility Market, By Platform Architecture, 2019-2032 (USD Billion)
38. Europe Urban Air Mobility Market, By Range, 2019-2032 (USD Billion)
39. Germany Urban Air Mobility Market, By Mobility Type, 2019-2032 (USD Billion)
40. Germany Urban Air Mobility Market, By Operation, 2019-2032 (USD Billion)
41. Germany Urban Air Mobility Market, By Platform Architecture, 2019-2032 (USD Billion)
42. Germany Urban Air Mobility Market, By Range, 2019-2032 (USD Billion)
43. France Urban Air Mobility Market, By Mobility Type, 2019-2032 (USD Billion)
44. France Urban Air Mobility Market, By Operation, 2019-2032 (USD Billion)
45. France Urban Air Mobility Market, By Platform Architecture, 2019-2032 (USD Billion)
46. France Urban Air Mobility Market, By Range, 2019-2032 (USD Billion)
47. U.K. Urban Air Mobility Market, By Mobility Type, 2019-2032 (USD Billion)
48. U.K. Urban Air Mobility Market, By Operation, 2019-2032 (USD Billion)
49. U.K. Urban Air Mobility Market, By Platform Architecture, 2019-2032 (USD Billion)
50. U.K. Urban Air Mobility Market, By Range, 2019-2032 (USD Billion)
51. Italy Urban Air Mobility Market, By Mobility Type, 2019-2032 (USD Billion)
52. Italy Urban Air Mobility Market, By Operation, 2019-2032 (USD Billion)
53. Italy Urban Air Mobility Market, By Platform Architecture, 2019-2032 (USD Billion)
54. Italy Urban Air Mobility Market, By Range, 2019-2032 (USD Billion)
55. Spain Urban Air Mobility Market, By Mobility Type, 2019-2032 (USD Billion)
56. Spain Urban Air Mobility Market, By Operation, 2019-2032 (USD Billion)
57. Spain Urban Air Mobility Market, By Platform Architecture, 2019-2032 (USD Billion)
58. Spain Urban Air Mobility Market, By Range, 2019-2032 (USD Billion)
59. Asia Pacific Urban Air Mobility Market, By Mobility Type, 2019-2032 (USD Billion)
60. Asia Pacific Urban Air Mobility Market, By Operation, 2019-2032 (USD Billion)
61. Asia Pacific Urban Air Mobility Market, By Platform Architecture, 2019-2032 (USD Billion)
62. Asia Pacific Urban Air Mobility Market, By Range, 2019-2032 (USD Billion)
63. Japan Urban Air Mobility Market, By Mobility Type, 2019-2032 (USD Billion)
64. Japan Urban Air Mobility Market, By Operation, 2019-2032 (USD Billion)
65. Japan Urban Air Mobility Market, By Platform Architecture, 2019-2032 (USD Billion)
66. Japan Urban Air Mobility Market, By Range, 2019-2032 (USD Billion)
67. China Urban Air Mobility Market, By Mobility Type, 2019-2032 (USD Billion)
68. China Urban Air Mobility Market, By Operation, 2019-2032 (USD Billion)
69. China Urban Air Mobility Market, By Platform Architecture, 2019-2032 (USD Billion)
70. China Urban Air Mobility Market, By Range, 2019-2032 (USD Billion)
71. India Urban Air Mobility Market, By Mobility Type, 2019-2032 (USD Billion)
72. India Urban Air Mobility Market, By Operation, 2019-2032 (USD Billion)
73. India Urban Air Mobility Market, By Platform Architecture, 2019-2032 (USD Billion)
74. India Urban Air Mobility Market, By Range, 2019-2032 (USD Billion)
75. South America Urban Air Mobility Market, By Mobility Type, 2019-2032 (USD Billion)
76. South America Urban Air Mobility Market, By Operation, 2019-2032 (USD Billion)
77. South America Urban Air Mobility Market, By Platform Architecture, 2019-2032 (USD Billion)
78. South America Urban Air Mobility Market, By Range, 2019-2032 (USD Billion)
79. Brazil Urban Air Mobility Market, By Mobility Type, 2019-2032 (USD Billion)
80. Brazil Urban Air Mobility Market, By Operation, 2019-2032 (USD Billion)
81. Brazil Urban Air Mobility Market, By Platform Architecture, 2019-2032 (USD Billion)
82. BrazilUrban Air Mobility Market, By Range, 2019-2032 (USD Billion)
83. Middle East and Africa Urban Air Mobility Market, By Mobility Type, 2019-2032 (USD Billion)
84. Middle East and Africa Urban Air Mobility Market, By Operation, 2019-2032 (USD Billion)
85. Middle East and Africa Urban Air Mobility Market, By Platform Architecture, 2019-2032 (USD Billion)
86. Middle East and Africa Urban Air Mobility Market, By Range, 2019-2032 (USD Billion)
87. UAE Urban Air Mobility Market, By Mobility Type, 2019-2032 (USD Billion)
88. UAE Urban Air Mobility Market, By Operation, 2019-2032 (USD Billion)
89. UAE Urban Air Mobility Market, By Platform Architecture, 2019-2032 (USD Billion)
90. UAE Urban Air Mobility Market, By Range, 2019-2032 (USD Billion)
91. South Africa Urban Air Mobility Market, By Mobility Type, 2019-2032 (USD Billion)
92. South Africa Urban Air Mobility Market, By Operation, 2019-2032 (USD Billion)
93. South Africa Urban Air Mobility Market, By Platform Architecture, 2019-2032 (USD Billion)
94. South Africa Urban Air Mobility Market, By Range, 2019-2032 (USD Billion)
List of Figures
1. Global Urban Air Mobility Market Segmentation
2. Urban Air Mobility Market: Research Methodology
3. Market Size Estimation Methodology: Bottom-Up Approach
4. Market Size Estimation Methodology: Top-Down Approach
5. Data Triangulation
6. Porter’s Five Forces Analysis
7. Value Chain Analysis
8. Global Urban Air Mobility Market Attractiveness Analysis by Mobility Type
9. Global Urban Air Mobility Market Attractiveness Analysis by Operation
10. Global Urban Air Mobility Market Attractiveness Analysis by Platform Architecture
11. Global Urban Air Mobility Market Attractiveness Analysis by Range
12. Global Urban Air Mobility Market Attractiveness Analysis by Region
13. Global Urban Air Mobility Market: Dynamics
14. Global Urban Air Mobility Market Share by Mobility Type (2022 & 2032)
15. Global Urban Air Mobility Market Share by Operation (2022 & 2032)
16. Global Urban Air Mobility Market Share by Platform Architecture (2022 & 2032)
17. Global Urban Air Mobility Market Share by Range (2022 & 2032)
18. Global Urban Air Mobility Market Share by Regions (2022 & 2032)
19. Global Urban Air Mobility Market Share by Company (2022)
This study forecasts revenue at global, regional, and country levels from 2019 to 2032. The Brainy Insights has segmented the global urban air mobility market based on below mentioned segments:
Global Urban Air Mobility Market by Mobility Type:
Global Urban Air Mobility Market by Operation:
Global Urban Air Mobility Market by Platform Architecture:
Global Urban Air Mobility Market by Range:
Global Urban Air Mobility Market by Region:
Research has its special purpose to undertake marketing efficiently. In this competitive scenario, businesses need information across all industry verticals; the information about customer wants, market demand, competition, industry trends, distribution channels etc. This information needs to be updated regularly because businesses operate in a dynamic environment. Our organization, The Brainy Insights incorporates scientific and systematic research procedures in order to get proper market insights and industry analysis for overall business success. The analysis consists of studying the market from a miniscule level wherein we implement statistical tools which helps us in examining the data with accuracy and precision.
Our research reports feature both; quantitative and qualitative aspects for any market. Qualitative information for any market research process are fundamental because they reveal the customer needs and wants, usage and consumption for any product/service related to a specific industry. This in turn aids the marketers/investors in knowing certain perceptions of the customers. Qualitative research can enlighten about the different product concepts and designs along with unique service offering that in turn, helps define marketing problems and generate opportunities. On the other hand, quantitative research engages with the data collection process through interviews, e-mail interactions, surveys and pilot studies. Quantitative aspects for the market research are useful to validate the hypotheses generated during qualitative research method, explore empirical patterns in the data with the help of statistical tools, and finally make the market estimations.
The Brainy Insights offers comprehensive research and analysis, based on a wide assortment of factual insights gained through interviews with CXOs and global experts and secondary data from reliable sources. Our analysts and industry specialist assume vital roles in building up statistical tools and analysis models, which are used to analyse the data and arrive at accurate insights with exceedingly informative research discoveries. The data provided by our organization have proven precious to a diverse range of companies, facilitating them to address issues such as determining which products/services are the most appealing, whether or not customers use the product in the manner anticipated, the purchasing intentions of the market and many others.
Our research methodology encompasses an idyllic combination of primary and secondary initiatives. Key phases involved in this process are listed below:

The phase involves the gathering and collecting of market data and its related information with the help of different sources & research procedures.

The data procurement stage involves in data gathering and collecting through various data sources.
This stage involves in extensive research. These data sources includes:
Purchased Database: Purchased databases play a crucial role in estimating the market sizes irrespective of the domain. Our purchased database includes:
Primary Research: The Brainy Insights interacts with leading companies and experts of the concerned domain to develop the analyst team’s market understanding and expertise. It improves and substantiates every single data presented in the market reports. Primary research mainly involves in telephonic interviews, E-mail interactions and face-to-face interviews with the raw material providers, manufacturers/producers, distributors, & independent consultants. The interviews that we conduct provides valuable data on market size and industry growth trends prevailing in the market. Our organization also conducts surveys with the various industry experts in order to gain overall insights of the industry/market. For instance, in healthcare industry we conduct surveys with the pharmacists, doctors, surgeons and nurses in order to gain insights and key information of a medical product/device/equipment which the customers are going to usage. Surveys are conducted in the form of questionnaire designed by our own analyst team. Surveys plays an important role in primary research because surveys helps us to identify the key target audiences of the market. Additionally, surveys helps to identify the key target audience engaged with the market. Our survey team conducts the survey by targeting the key audience, thus gaining insights from them. Based on the perspectives of the customers, this information is utilized to formulate market strategies. Moreover, market surveys helps us to understand the current competitive situation of the industry. To be precise, our survey process typically involve with the 360 analysis of the market. This analytical process begins by identifying the prospective customers for a product or service related to the market/industry to obtain data on how a product/service could fit into customers’ lives.

Secondary Research: The secondary data sources includes information published by the on-profit organizations such as World bank, WHO, company fillings, investor presentations, annual reports, national government documents, statistical databases, blogs, articles, white papers and others. From the annual report, we analyse a company’s revenue to understand the key segment and market share of that organization in a particular region. We analyse the company websites and adopt the product mapping technique which is important for deriving the segment revenue. In the product mapping method, we select and categorize the products offered by the companies catering to domain specific market, deduce the product revenue for each of the companies so as to get overall estimation of the market size. We also source data and analyses trends based on information received from supply side and demand side intermediaries in the value chain. The supply side denotes the data gathered from supplier, distributor, wholesaler and the demand side illustrates the data gathered from the end customers for respective market domain.

The supply side for a domain specific market is analysed by:
The demand side for the market is estimated through:
In-house Library: Apart from these third-party sources, we have our in-house library of qualitative and quantitative information. Our in-house database includes market data for various industry and domains. These data are updated on regular basis as per the changing market scenario. Our library includes, historic databases, internal audit reports and archives.
Sometimes there are instances where there is no metadata or raw data available for any domain specific market. For those cases, we use our expertise to forecast and estimate the market size in order to generate comprehensive data sets. Our analyst team adopt a robust research technique in order to produce the estimates:
Data Synthesis: This stage involves the analysis & mapping of all the information obtained from the previous step. It also involves in scrutinizing the data for any discrepancy observed while data gathering related to the market. The data is collected with consideration to the heterogeneity of sources. Robust scientific techniques are in place for synthesizing disparate data sets and provide the essential contextual information that can orient market strategies. The Brainy Insights has extensive experience in data synthesis where the data passes through various stages:


Market Deduction & Formulation: The final stage comprises of assigning data points at appropriate market spaces so as to deduce feasible conclusions. Analyst perspective & subject matter expert based holistic form of market sizing coupled with industry analysis also plays a crucial role in this stage.
This stage involves in finalization of the market size and numbers that we have collected from data integration step. With data interpolation, it is made sure that there is no gap in the market data. Successful trend analysis is done by our analysts using extrapolation techniques, which provide the best possible forecasts for the market.
Data Validation & Market Feedback: Validation is the most important step in the process. Validation & re-validation via an intricately designed process helps us finalize data-points to be used for final calculations.

The Brainy Insights interacts with leading companies and experts of the concerned domain to develop the analyst team’s market understanding and expertise. It improves and substantiates every single data presented in the market reports. The data validation interview and discussion panels are typically composed of the most experienced industry members. The participants include, however, are not limited to:
Moreover, we always validate our data and findings through primary respondents from all the major regions we are working on.


Free Customization
Fortune 500 Clients
Free Yearly Update On Purchase Of Multi/Corporate License
Companies Served Till Date