- +1-315-215-1633
- sales@thebrainyinsights.com

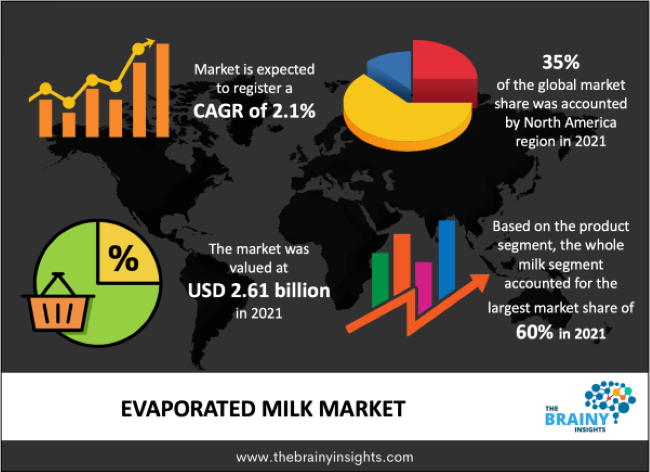
The evaporated milk market was valued at USD 2.61 billion in 2021 and is expected to reach USD 3.06 billion by 2030, expanding at a CAGR of 2.1% from 2022 to 2030. The key factor contributing to the growth of the market is the shifting consumer preference towards home-cooked meals and home cooking. According to a survey conducted by Hunter in April 2020, 71% of Americans are cooking a meal at home and will continue to do so in the future. The driving factor behind cooking at home is the increased confidence in the kitchen and the growing demand for healthier food products.
Further, evaporated milk is considered to be highly beneficial for people trying to lose weight and trying to gain weight quickly. Growing health concerns are, therefore, boosting the demand for evaporated milk. Compared to conventional dairy-based milk, evaporated milk has features such as longer shelf life and versatility. During the production of evaporated milk, 60% of the water content from regular dairy milk is reduced, which increases its shelf life. In addition to its application for cooking various dishes, evaporated milk can be directly consumed with breakfast cereal.
Evaporated milk is increasingly being used to add a rich and creamy taste as well as texture to a wide range of recipes such as mac n cheese, beignets, cakes, pasta, and others. It is often used in place of fresh cream as it contains fewer calories and does not add to the overall sweetness of the food. As a result, evaporated milk is used to prepare sweet and savory dishes. Adding water to evaporated milk also makes it an ideal substitute for fresh milk.
Get an overview of this study by requesting a free sample
The growing popularity of evaporated milk is enhancing its adoption among households as well as on a commercial level. Evaporated milk is used in the preparation of sauces, soups, and dressings as it adds thickness without significantly increasing the fat content. Evaporated milk is also used to make beverages like tea, coffee, hot chocolate, and smoothies and in desserts such as flan, rice pudding, spice cakes, and scones.
Whole evaporated milk dominated the market and held a share of over 60% in 2021. It is often used in soups, quiches, béchamel sauce, and other products as it has a creamy texture and taste without the sweetness of condensed milk. Consumers use evaporated milk in place of fresh milk in various recipes, including tea, coffee, omelets, breakfast cereals, spaghetti sauces, mashed potatoes, waffles, frittata, cakes, macaroni, and cheese, fudges, and yogurt. This milk fits well in both sweet and savory dishes due to its caramel-like flavor and unsweetened taste. In countries like Malaysia, Singapore, the Netherlands, and Germany, evaporated milk is used in tea and coffee in a diluted or undiluted form. It is also used as a creamer or whitener for coffee in European countries. The wide application of the product will drive the growth of the market over the world.
Skimmed evaporated milk is anticipated to expand at a faster CAGR during the forecast period. Skimmed evaporated milk is produced by removing milkfat from whole milk. It generally contains about 0.5% to 0.1% fat and has a thinner and lighter texture. Over the past few years, the increasing awareness regarding the importance of a proper and balanced diet, along with the high prevalence of obesity, has been encouraging consumers to reduce their fat and calorie intake. This trend is more visible among the millennial age group. As a result, several foods and beverage manufacturers have started promoting products by highlighting their low-calorie content and functional benefits.
B2B distribution channel led the market with a share of over 60% in 2021. A wide application of evaporated milk in cakes, ice cream, and other bakery products is driving demand through this channel. Restaurants and café prefer to buy a bulk amount of evaporated milk for its application in various dishes. The increasing outdoor socializing among people and rising demand for sweet desserts are likely to propel the demand through this channel.
The B2C channel is anticipated to expand with a higher CAGR of 2.5% from 2022-2030. Among the B2C channel, the online distribution channel is expected to register the fastest growth, owing to increasing dependency on online shopping among consumers, especially millennials and Gen Z. Further, a booming e-commerce sector, especially in developing economies like India and Nigeria, is supporting the growth of this segment. Further, shopping online and collecting at store culture has also among popular in regions like North America and Europe is also anticipated to propel sales through this channel.
North America accounted for the highest share of more than 35% of the market in 2021. The lucrative opportunities in the industry have resulted in new investments to leverage the industry's growth. For instance, in February 2019, Smucker Foods of Canada Corp. invested USD 9.1 million in its Sherbrooke manufacturing facility. The facility produces Carnation evaporated milk and Eagle Brand sweetened condensed milk for consumers in Canada
Asia Pacific is anticipated to register the fastest growth during the forecast period. Technological advancements have been reducing the overall product price and have been making evaporated milk available at an affordable price, which is driving the market in this region. Innovation in product manufacturing and transport has also driven the Asia Pacific evaporated milk market. For instance, HRS, a leading manufacturer and supplier of heat exchangers, delivers low-temperature evaporation through its K Series shell and tube heat exchangers. The evaporator module provides high heat transfer rates with good resistance to fouling and is extremely suitable for preparing evaporated milk.
The evaporated milk market is fragmented with many large and small companies. These have been focusing on regional expansions, mergers & acquisitions, strengthening online presence, and new product launches to gain a competitive advantage. For instance, in December 2021, FrieslandCampina launched Rainbow Evaporated Milk in re-closable packaging made from 89% recyclable material in the UAE.
Segments Covered in the Report
1. Introduction
1.1. Objectives of the Study
1.2. Market Definition
1.3. Research Scope
1.4. Currency
1.5. Key Target Audience
2. Research Methodology and Assumptions
3. Executive Summary
4. Premium Insights
4.1. Porter’s Five Forces Analysis
4.2. Value Chain Analysis
4.3. Top Investment Pockets
4.3.1. Market Attractiveness Analysis by Product
4.3.2. Market Attractiveness Analysis by Distribution Channel
4.3.3. Market Attractiveness Analysis by Region
4.4. Industry Trends
5. Market Dynamics
5.1. Market Evaluation
5.2. Drivers
5.2.1. Shifting consumer preference towards home-cooked meals and home cooking
5.3. Restraints
5.3.1. Fluctuating raw material prices
5.4. Opportunities
5.4.1. Demand from nations having inadequate supply of Evaporated Milk
6. Global Evaporated Milk Market Analysis and Forecast, By Product
6.1. Segment Overview
6.2. Whole
6.3. Skimmed
6.4. Semi-skimmed
7. Global Evaporated Milk Market Analysis and Forecast, By Distribution Channel
7.1. Segment Overview
7.2. B2B
7.3. B2C
7.3.1. Supermarkets & Hypermarkets
7.3.2. Convenience Stores
7.3.3. Online
7.3.4. Others
8. Global Evaporated Milk Market Analysis and Forecast, By Regional Analysis
8.1. Segment Overview
8.2. North America
8.2.1. U.S.
8.2.2. Canada
8.2.3. Mexico
8.3. Europe
8.3.1. Germany
8.3.2. France
8.3.3. U.K.
8.3.4. Italy
8.3.5. Spain
8.4. Asia-Pacific
8.4.1. Japan
8.4.2. China
8.4.3. India
8.5. South America
8.5.1. Brazil
8.6. Middle East and Africa
8.6.1. UAE
8.6.2. South Africa
9. Global Evaporated Milk Market-Competitive Landscape
9.1. Overview
9.2. Market Share of Key Players in the Evaporated Milk Market
9.2.1. Global Company Market Share
9.2.2. North America Company Market Share
9.2.3. Europe Company Market Share
9.2.4. APAC Company Market Share
9.3. Competitive Situations and Trends
9.3.1. Product Launches and Developments
9.3.2. Partnerships, Collaborations, and Agreements
9.3.3. Mergers & Acquisitions
9.3.4. Expansions
10. Company Profiles
10.1. Nestlé
10.1.1. Business Overview
10.1.2. Company Snapshot
10.1.3. Company Market Share Analysis
10.1.4. Company Product Portfolio
10.1.5. Recent Developments
10.1.6. SWOT Analysis
10.2. Friesl and Campina
10.2.1. Business Overview
10.2.2. Company Snapshot
10.2.3. Company Market Share Analysis
10.2.4. Company Product Portfolio
10.2.5. Recent Developments
10.2.6. SWOT Analysis
10.3. Arla Foods amba
10.3.1. Business Overview
10.3.2. Company Snapshot
10.3.3. Company Market Share Analysis
10.3.4. Company Product Portfolio
10.3.5. Recent Developments
10.3.6. SWOT Analysis
10.4. DANA DAIRY GROUP
10.4.1. Business Overview
10.4.2. Company Snapshot
10.4.3. Company Market Share Analysis
10.4.4. Company Product Portfolio
10.4.5. Recent Developments
10.4.6. SWOT Analysis
10.5. Fraser and Neave, Limited.
10.5.1. Business Overview
10.5.2. Company Snapshot
10.5.3. Company Market Share Analysis
10.5.4. Company Product Portfolio
10.5.5. Recent Developments
10.5.6. SWOT Analysis
10.6. Alaska Milk Corporation
10.6.1. Business Overview
10.6.2. Company Snapshot
10.6.3. Company Market Share Analysis
10.6.4. Company Product Portfolio
10.6.5. Recent Developments
10.6.6. SWOT Analysis
10.7. Naisa Brand Products Ltd.
10.7.1. Business Overview
10.7.2. Company Snapshot
10.7.3. Company Market Share Analysis
10.7.4. Company Product Portfolio
10.7.5. Recent Developments
10.7.6. SWOT Analysis
10.8. Parthenon Foods
10.8.1. Business Overview
10.8.2. Company Snapshot
10.8.3. Company Market Share Analysis
10.8.4. Company Product Portfolio
10.8.5. Recent Developments
10.8.6. SWOT Analysis
10.9. Santini Foods, Inc.
10.9.1. Business Overview
10.9.2. Company Snapshot
10.9.3. Company Market Share Analysis
10.9.4. Company Product Portfolio
10.9.5. Recent Developments
10.9.6. SWOT Analysis
10.10. Meyenberg
10.10.1. Business Overview
10.10.2. Company Snapshot
10.10.3. Company Market Share Analysis
10.10.4. Company Product Portfolio
10.10.5. Recent Developments
10.10.6. SWOT Analysis
10.11. Eagle Family Foods Group LLC
10.11.1. Business Overview
10.11.2. Company Snapshot
10.11.3. Company Market Share Analysis
10.11.4. Company Product Portfolio
10.11.5. Recent Developments
10.11.6. SWOT Analysis
List of Table
1. Global Evaporated Milk Market, By Product, 2019-2030 (USD Billion)
2. Global Whole Evaporated Milk Market, By Region, 2019-2030 (USD Billion)
3. Global Skimmed Evaporated Milk Market, By Region, 2019-2030 (USD Billion)
4. Global Semi-Skimmed Evaporated Milk Market, By Region, 2019-2030 (USD Billion)
5. Global Evaporated Milk Market, By Distribution Channel, 2019-2030 (USD Billion)
6. Global B2B Evaporated Milk Market, By Region, 2019-2030 (USD Billion)
7. Global B2C Evaporated Milk Market, By Region, 2019-2030 (USD Billion)
8. Global Evaporated Milk Market, By Region, 2019-2030 (USD Billion)
9. North America Evaporated Milk Market, By Product, 2019-2030 (USD Billion)
10. North America Evaporated Milk Market, By Distribution Channel, 2019-2030 (USD Billion)
11. U.S. Evaporated Milk Market, By Product, 2019-2030 (USD Billion)
12. U.S. Evaporated Milk Market, By Distribution Channel, 2019-2030 (USD Billion)
13. Canada Evaporated Milk Market, By Product, 2019-2030 (USD Billion)
14. Canada Evaporated Milk Market, By Distribution Channel, 2019-2030 (USD Billion)
15. Mexico Evaporated Milk Market, By Product, 2019-2030 (USD Billion)
16. Mexico Evaporated Milk Market, By Distribution Channel, 2019-2030 (USD Billion)
17. Europe Evaporated Milk Market, By Product, 2019-2030 (USD Billion)
18. Europe Evaporated Milk Market, By Distribution Channel, 2019-2030 (USD Billion)
19. Germany Evaporated Milk Market, By Product, 2019-2030 (USD Billion)
20. Germany Evaporated Milk Market, By Distribution Channel, 2019-2030 (USD Billion)
21. France Evaporated Milk Market, By Product, 2019-2030 (USD Billion)
22. France Evaporated Milk Market, By Distribution Channel, 2019-2030 (USD Billion)
23. U.K. Evaporated Milk Market, By Product, 2019-2030 (USD Billion)
24. U.K. Evaporated Milk Market, By Distribution Channel, 2019-2030 (USD Billion)
25. Italy Evaporated Milk Market, By Product, 2019-2030 (USD Billion)
26. Italy Evaporated Milk Market, By Distribution Channel, 2019-2030 (USD Billion)
27. Spain Evaporated Milk Market, By Product, 2019-2030 (USD Billion)
28. Spain Evaporated Milk Market, By Distribution Channel, 2019-2030 (USD Billion)
29. Asia Pacific Evaporated Milk Market, By Product, 2019-2030 (USD Billion)
30. Asia Pacific Evaporated Milk Market, By Distribution Channel, 2019-2030 (USD Billion)
31. Japan Evaporated Milk Market, By Product, 2019-2030 (USD Billion)
32. Japan Evaporated Milk Market, By Distribution Channel, 2019-2030 (USD Billion)
33. China Evaporated Milk Market, By Product, 2019-2030 (USD Billion)
34. China Evaporated Milk Market, By Distribution Channel, 2019-2030 (USD Billion)
35. India Evaporated Milk Market, By Product, 2019-2030 (USD Billion)
36. India Evaporated Milk Market, By Distribution Channel, 2019-2030 (USD Billion)
37. South America Evaporated Milk Market, By Product, 2019-2030 (USD Billion)
38. South America Evaporated Milk Market, By Distribution Channel, 2019-2030 (USD Billion)
39. Brazil Evaporated Milk Market, By Product, 2019-2030 (USD Billion)
40. Brazil Evaporated Milk Market, By Distribution Channel, 2019-2030 (USD Billion)
41. Middle East and Africa Evaporated Milk Market, By Product, 2019-2030 (USD Billion)
42. Middle East and Africa Evaporated Milk Market, By Distribution Channel, 2019-2030 (USD Billion)
43. UAE Evaporated Milk Market, By Product, 2019-2030 (USD Billion)
44. UAE Evaporated Milk Market, By Distribution Channel, 2019-2030 (USD Billion)
45. South Africa Evaporated Milk Market, By Product, 2019-2030 (USD Billion)
46. South Africa Evaporated Milk Market, By Distribution Channel, 2019-2030 (USD Billion)
List of Figures
1. Global Evaporated Milk Market Segmentation
2. Evaporated Milk Market: Research Methodology
3. Market Size Estimation Methodology: Bottom-Up Approach
4. Market Size Estimation Methodology: Top-Down Approach
5. Data Triangulation
6. Porter’s Five Forces Analysis
7. Value Chain Analysis
8. Global Evaporated Milk Market Attractiveness Analysis by Product
9. Global Evaporated Milk Market Attractiveness Analysis by Distribution Channel
10. Global Evaporated Milk Market Attractiveness Analysis by Region
11. Global Evaporated Milk Market: Dynamics
12. Global Evaporated Milk Market Share by Product (2022 & 2030)
13. Global Evaporated Milk Market Share by Distribution Channel (2022 & 2030)
14. Global Evaporated Milk Market Share by Regions (2022 & 2030)
15. Global Evaporated Milk Market Share by Company (2021)
Segments Covered in the Report
Research has its special purpose to undertake marketing efficiently. In this competitive scenario, businesses need information across all industry verticals; the information about customer wants, market demand, competition, industry trends, distribution channels etc. This information needs to be updated regularly because businesses operate in a dynamic environment. Our organization, The Brainy Insights incorporates scientific and systematic research procedures in order to get proper market insights and industry analysis for overall business success. The analysis consists of studying the market from a miniscule level wherein we implement statistical tools which helps us in examining the data with accuracy and precision.
Our research reports feature both; quantitative and qualitative aspects for any market. Qualitative information for any market research process are fundamental because they reveal the customer needs and wants, usage and consumption for any product/service related to a specific industry. This in turn aids the marketers/investors in knowing certain perceptions of the customers. Qualitative research can enlighten about the different product concepts and designs along with unique service offering that in turn, helps define marketing problems and generate opportunities. On the other hand, quantitative research engages with the data collection process through interviews, e-mail interactions, surveys and pilot studies. Quantitative aspects for the market research are useful to validate the hypotheses generated during qualitative research method, explore empirical patterns in the data with the help of statistical tools, and finally make the market estimations.
The Brainy Insights offers comprehensive research and analysis, based on a wide assortment of factual insights gained through interviews with CXOs and global experts and secondary data from reliable sources. Our analysts and industry specialist assume vital roles in building up statistical tools and analysis models, which are used to analyse the data and arrive at accurate insights with exceedingly informative research discoveries. The data provided by our organization have proven precious to a diverse range of companies, facilitating them to address issues such as determining which products/services are the most appealing, whether or not customers use the product in the manner anticipated, the purchasing intentions of the market and many others.
Our research methodology encompasses an idyllic combination of primary and secondary initiatives. Key phases involved in this process are listed below:

The phase involves the gathering and collecting of market data and its related information with the help of different sources & research procedures.

The data procurement stage involves in data gathering and collecting through various data sources.
This stage involves in extensive research. These data sources includes:
Purchased Database: Purchased databases play a crucial role in estimating the market sizes irrespective of the domain. Our purchased database includes:
Primary Research: The Brainy Insights interacts with leading companies and experts of the concerned domain to develop the analyst team’s market understanding and expertise. It improves and substantiates every single data presented in the market reports. Primary research mainly involves in telephonic interviews, E-mail interactions and face-to-face interviews with the raw material providers, manufacturers/producers, distributors, & independent consultants. The interviews that we conduct provides valuable data on market size and industry growth trends prevailing in the market. Our organization also conducts surveys with the various industry experts in order to gain overall insights of the industry/market. For instance, in healthcare industry we conduct surveys with the pharmacists, doctors, surgeons and nurses in order to gain insights and key information of a medical product/device/equipment which the customers are going to usage. Surveys are conducted in the form of questionnaire designed by our own analyst team. Surveys plays an important role in primary research because surveys helps us to identify the key target audiences of the market. Additionally, surveys helps to identify the key target audience engaged with the market. Our survey team conducts the survey by targeting the key audience, thus gaining insights from them. Based on the perspectives of the customers, this information is utilized to formulate market strategies. Moreover, market surveys helps us to understand the current competitive situation of the industry. To be precise, our survey process typically involve with the 360 analysis of the market. This analytical process begins by identifying the prospective customers for a product or service related to the market/industry to obtain data on how a product/service could fit into customers’ lives.

Secondary Research: The secondary data sources includes information published by the on-profit organizations such as World bank, WHO, company fillings, investor presentations, annual reports, national government documents, statistical databases, blogs, articles, white papers and others. From the annual report, we analyse a company’s revenue to understand the key segment and market share of that organization in a particular region. We analyse the company websites and adopt the product mapping technique which is important for deriving the segment revenue. In the product mapping method, we select and categorize the products offered by the companies catering to domain specific market, deduce the product revenue for each of the companies so as to get overall estimation of the market size. We also source data and analyses trends based on information received from supply side and demand side intermediaries in the value chain. The supply side denotes the data gathered from supplier, distributor, wholesaler and the demand side illustrates the data gathered from the end customers for respective market domain.

The supply side for a domain specific market is analysed by:
The demand side for the market is estimated through:
In-house Library: Apart from these third-party sources, we have our in-house library of qualitative and quantitative information. Our in-house database includes market data for various industry and domains. These data are updated on regular basis as per the changing market scenario. Our library includes, historic databases, internal audit reports and archives.
Sometimes there are instances where there is no metadata or raw data available for any domain specific market. For those cases, we use our expertise to forecast and estimate the market size in order to generate comprehensive data sets. Our analyst team adopt a robust research technique in order to produce the estimates:
Data Synthesis: This stage involves the analysis & mapping of all the information obtained from the previous step. It also involves in scrutinizing the data for any discrepancy observed while data gathering related to the market. The data is collected with consideration to the heterogeneity of sources. Robust scientific techniques are in place for synthesizing disparate data sets and provide the essential contextual information that can orient market strategies. The Brainy Insights has extensive experience in data synthesis where the data passes through various stages:


Market Deduction & Formulation: The final stage comprises of assigning data points at appropriate market spaces so as to deduce feasible conclusions. Analyst perspective & subject matter expert based holistic form of market sizing coupled with industry analysis also plays a crucial role in this stage.
This stage involves in finalization of the market size and numbers that we have collected from data integration step. With data interpolation, it is made sure that there is no gap in the market data. Successful trend analysis is done by our analysts using extrapolation techniques, which provide the best possible forecasts for the market.
Data Validation & Market Feedback: Validation is the most important step in the process. Validation & re-validation via an intricately designed process helps us finalize data-points to be used for final calculations.

The Brainy Insights interacts with leading companies and experts of the concerned domain to develop the analyst team’s market understanding and expertise. It improves and substantiates every single data presented in the market reports. The data validation interview and discussion panels are typically composed of the most experienced industry members. The participants include, however, are not limited to:
Moreover, we always validate our data and findings through primary respondents from all the major regions we are working on.


Free Customization
Fortune 500 Clients
Free Yearly Update On Purchase Of Multi/Corporate License
Companies Served Till Date