- +1-315-215-1633
- sales@thebrainyinsights.com

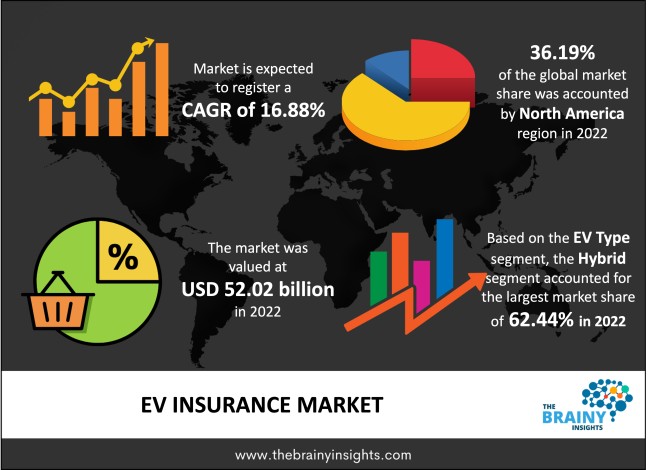
The global EV insurance market is expected to grow from USD 52.02 billion in 2022 to USD 247.49 billion by 2032, at a CAGR of 16.88% during the forecast period 2023-2032. North America dominated the market in 2022.
Electric vehicle insurance helps the customer shield their vehicle against losses from accidents, natural disasters, theft, etc. Electric cars are environmentally friendly; thus, these are growing in popularity, especially in Western countries. These vehicles have a lot of intricate technical and mechanical components that make them function well but can also malfunction at any time. So, having electric car insurance can ensure that they drive their vehicle without any concerns and provide financial protection in the terrible event of a fire, unintentional damage, theft or natural disaster. Add-ons are optional extras that customers can purchase with the e-car insurance policy. These extra features can assist them in fine-tuning the policy coverage to suit their needs. Electric cars are more expensive than conventional or fuel-powered vehicles, and thus they have a high insured declared value. The cost of car insurance will increase as the IDV rises.
Get an overview of this study by requesting a free sample
Increasing EV insurance purchasing: Vehicle owners are nowadays acquiring third-party insurance. Much automotive insurance is now required by law and protects customers from responsibilities to third parties. The EV car insurance policy includes liability coverage, including vehicle theft, rioting, fire, unintentional damage, and natural disasters. Both the purchasing of electric vehicles and the number of automobile insurance policies are increasing in the global market. Automotive consumers are progressively becoming more receptive to electric cars as more companies introduce them. EV drivers are nevertheless recommended to purchase auto insurance early so they are not concerned with unforeseen expenses. Comprehensive auto insurance is in high demand among consumers as it will cover the vehicle's damage and third-party liabilities.
High cost of premium– Several factors influence the price of insurance premiums for electric vehicles. These elements are crucial in determining the cost of EV insurance. As EVs are more expensive than automobiles fuelled by petrol or diesel, this is one of the main reasons why electric car insurance premiums are higher.
Increased consumption of electric hybrid vehicles– Electric car sales surpassed 2.1 million worldwide in 2019, surpassing 2018 and bringing the total number of electric vehicles on the road to 7.2 million. In 2019, electric vehicles accounted for 2.6 per cent of global car sales and about 1% of global car stock, representing a 40 per cent rise year over year. Electric vehicles are becoming more common as technological advancements in electrifying two/three-wheelers, buses, and trucks progress, and the demand for them expands. In recent years, bold policy announcements have been instrumental in accelerating the adoption of electric vehicles in major vehicle markets. Leasing an electric car is a cost-effective and straightforward option to get behind the wheel of a brand-new vehicle while reaping the benefits of an electric car lease. As electric vehicles are the way of the future, leasing is the cheapest way to drive an EV and reap the benefits of an environmentally friendly vehicle. Electric cars are quickly becoming one of the most popular modes of transportation in countries like the USA, UK, Germany, Japan, etc. Fuel prices continue to rise yearly, but an electric lease will drastically reduce operating costs, saving money in the long term.
Unawareness in some regions– There is a lack of awareness of EV insurance among the population of some developing and underdeveloped regions. Also, many consumers in such regions do not have any information about EV insurance, which is challenging for the market.
The regions analyzed for the market include North America, Europe, South America, Asia Pacific, the Middle East, and Africa. North America emerged as the most significant global EV Insurance market, with a revenue share of 36.19% in 2022. The region has a high market growth rate due to the rising purchasing of battery-powered and hybrid electric vehicles. Investment in EV technology will drive the North American market. The increasing purchasing of EVs in the region can be attributed to high disposable income. Most consumers prefer to opt for EV insurance during a vehicle purchase. The Asia-Pacific region is anticipated to grow lucratively during the forecast period. The increasing investments in EV technology will likely provide more growth opportunities to the EV insurance market in the region.
North America region EV Insurance Market Share in 2022 - 36.19%
www.thebrainyinsights.com
Check the geographical analysis of this market by requesting a free sample
The EV type segment is divided into battery-operated and hybrid. The hybrid segment dominated the market with a revenue share of 62.44% in 2022. An internal combustion engine and one or more electric motors power hybrid cars. Hybrid EVs are more in demand due to their low acquisition and maintenance cost compared to the batter operated EVs.
The plan type segment includes third-party liability coverage and comprehensive coverage. The third-party liability coverage segment dominated the market with a revenue share of 61.21% in 2022. With a third-party liability insurance policy, the insurance provider provides coverage for the insured against potential legal obligations. The third-party liability coverage includes accidental damage, theft, battery and parts replacements.
The vehicle type segment includes commercial and passenger. The passenger vehicle segment dominated the market with a revenue share of 72.03% in 2022. Passenger vehicle owners opt for EV insurance to save up their future repair costs. Due to increased income levels, many consumers have bought electric vehicles in the past few years.
The coverage segment includes accidental damage, theft, natural disaster damage, fire damage and battery or parts replacement. The accidental damage segment dominated the market with a revenue share of 38.19% in 2022. Accidental damage is one of the key concerns among EV owners, and thus most of them prefer to buy insurance to cover the repair cost.
The distribution channel segment includes banks, insurance companies, online brokers and OEMs. The banks segment dominated the market with a revenue share of 39.10% in 2022. Banks provide different policies for EV insurance based on the consumer's requirements. Many consumers trust banking institutions and thus prefer to buy EV insurance from banks.
| Attribute | Description |
|---|---|
| Market Size | Revenue (USD Billion) |
| Market size value in 2022 | USD 52.02 Billion |
| Market size value in 2032 | USD 247.49 Billion |
| CAGR (2023 to 2032) | 16.88% |
| Historical data | 2019-2021 |
| Base Year | 2022 |
| Forecast | 2023-2032 |
| Regional Segments | The regions examined for the market are Europe, Asia Pacific, North America, South America, and Middle East & Africa. |
| Segments | The research segment is based on EV type, plan type, vehicle type, coverage and distribution channel. |
As per The Brainy Insights, the size of the EV insurance market was valued USD 52.02 billion in 2022 to USD 247.49 billion by 2032.
Global EV insurance market is growing at a CAGR of 16.88% during the forecast period 2023-2032.
North America region emerged as the largest market for the EV Insurance.
The market's growth will be influenced by the growing usage of EV insurance.
The high cost of premium could hamper the market growth.
The increasing purchasing of EV is providing huge opportunities to the market.
1. Introduction
1.1. Objectives of the Study
1.2. Market Definition
1.3. Research Scope
1.4. Currency
1.5. Key Target Audience
2. Research Methodology and Assumptions
3. Executive Summary
4. Premium Insights
4.1. Porter’s Five Forces Analysis
4.2. Value Chain Analysis
4.3. Top Investment Pockets
4.3.1. Market Attractiveness Analysis by EV Type
4.3.2. Market Attractiveness Analysis by Plan Type
4.3.3. Market Attractiveness Analysis by Vehicle Type
4.3.4. Market Attractiveness Analysis by Coverage
4.3.5. Market Attractiveness Analysis by Distribution Channel
4.3.6. Market Attractiveness Analysis by Region
4.4. Industry Trends
5. Market Dynamics
5.1. Market Evaluation
5.2. Drivers
5.2.1. Increasing use of EV insurance
5.3. Restraints
5.3.1. High premium cost
5.4. Opportunities
5.4.1. Increasing purchasing of EVs
5.5. Challenges
5.5.1. Lack of awareness
6. Global EV Insurance Market Analysis and Forecast, By EV Type
6.1. Segment Overview
6.2. Battery Operated
6.3. Hybrid
7. Global EV Insurance Market Analysis and Forecast, By Plan Type
7.1. Segment Overview
7.2. Third Party Liability Coverage
7.3. Comprehensive Coverage
8. Global EV Insurance Market Analysis and Forecast, By Vehicle Type
8.1. Segment Overview
8.2. Commercial
8.3. Passenger
9. Global EV Insurance Market Analysis and Forecast, By Coverage
9.1. Segment Overview
9.2. Accidental Damage
9.3. Theft
9.4. Natural Disaster Damage
9.5. Fire Damage
9.6. Battery or Parts Replacement
10. Global EV Insurance Market Analysis and Forecast, By Distribution Channel
10.1. Segment Overview
10.2. Banks
10.3. Insurance Companies
10.4. Online Brokers
10.5. OEMs
11. Global EV Insurance Market Analysis and Forecast, By Regional Analysis
11.1. Segment Overview
11.2. North America
11.2.1. U.S.
11.2.2. Canada
11.2.3. Mexico
11.3. Europe
11.3.1. Germany
11.3.2. France
11.3.3. U.K.
11.3.4. Italy
11.3.5. Spain
11.4. Asia-Pacific
11.4.1. Japan
11.4.2. China
11.4.3. India
11.5. South America
11.5.1. Brazil
11.6. Middle East and Africa
11.6.1. UAE
11.6.2. South Africa
12. Global EV Insurance Market-Competitive Landscape
12.1. Overview
12.2. Market Share of Key Players in the EV Insurance Market
12.2.1. Global Company Market Share
12.2.2. North America Company Market Share
12.2.3. Europe Company Market Share
12.2.4. APAC Company Market Share
12.3. Competitive Situations and Trends
12.3.1. Product Launches and Developments
12.3.2. Partnerships, Collaborations, and Agreements
12.3.3. Mergers & Acquisitions
12.3.4. Expansions
13. Company Profiles
13.1. AXA
13.1.1. Business Overview
13.1.2. Company Snapshot
13.1.3. Company Market Share Analysis
13.1.4. Company Product Portfolio
13.1.5. Recent Developments
13.1.6. SWOT Analysis
13.2. Allianz
13.2.1. Business Overview
13.2.2. Company Snapshot
13.2.3. Company Market Share Analysis
13.2.4. Company Product Portfolio
13.2.5. Recent Developments
13.2.6. SWOT Analysis
13.3. Aviva
13.3.1. Business Overview
13.3.2. Company Snapshot
13.3.3. Company Market Share Analysis
13.3.4. Company Product Portfolio
13.3.5. Recent Developments
13.3.6. SWOT Analysis
13.4. Allstate Insurance Company
13.4.1. Business Overview
13.4.2. Company Snapshot
13.4.3. Company Market Share Analysis
13.4.4. Company Product Portfolio
13.4.5. Recent Developments
13.4.6. SWOT Analysis
13.5. Zurich Insurance Group
13.5.1. Business Overview
13.5.2. Company Snapshot
13.5.3. Company Market Share Analysis
13.5.4. Company Product Portfolio
13.5.5. Recent Developments
13.5.6. SWOT Analysis
13.6. ACKO General Insurance
13.6.1. Business Overview
13.6.2. Company Snapshot
13.6.3. Company Market Share Analysis
13.6.4. Company Product Portfolio
13.6.5. Recent Developments
13.6.6. SWOT Analysis
13.7. HDFC ERGO
13.7.1. Business Overview
13.7.2. Company Snapshot
13.7.3. Company Market Share Analysis
13.7.4. Company Product Portfolio
13.7.5. Recent Developments
13.7.6. SWOT Analysis
13.8. Beinsure Digital Media
13.8.1. Business Overview
13.8.2. Company Snapshot
13.8.3. Company Market Share Analysis
13.8.4. Company Product Portfolio
13.8.5. Recent Developments
13.8.6. SWOT Analysis
13.9. Lemonade Inc.
13.9.1. Business Overview
13.9.2. Company Snapshot
13.9.3. Company Market Share Analysis
13.9.4. Company Product Portfolio
13.9.5. Recent Developments
13.9.6. SWOT Analysis
13.10. GEICO
13.10.1. Business Overview
13.10.2. Company Snapshot
13.10.3. Company Market Share Analysis
13.10.4. Company Product Portfolio
13.10.5. Recent Developments
13.10.6. SWOT Analysis
13.11. Liberty Mutual Insurance Group
13.11.1. Business Overview
13.11.2. Company Snapshot
13.11.3. Company Market Share Analysis
13.11.4. Company Product Portfolio
13.11.5. Recent Developments
13.11.6. SWOT Analysis
13.12. Esure
13.12.1. Business Overview
13.12.2. Company Snapshot
13.12.3. Company Market Share Analysis
13.12.4. Company Product Portfolio
13.12.5. Recent Developments
13.12.6. SWOT Analysis
13.13. Progressive Casualty Insurance Company
13.13.1. Business Overview
13.13.2. Company Snapshot
13.13.3. Company Market Share Analysis
13.13.4. Company Product Portfolio
13.13.5. Recent Developments
13.13.6. SWOT Analysis
13.14. Direct Lines
13.14.1. Business Overview
13.14.2. Company Snapshot
13.14.3. Company Market Share Analysis
13.14.4. Company Product Portfolio
13.14.5. Recent Developments
13.14.6. SWOT Analysis
13.15. General Motors
13.15.1. Business Overview
13.15.2. Company Snapshot
13.15.3. Company Market Share Analysis
13.15.4. Company Product Portfolio
13.15.5. Recent Developments
13.15.6. SWOT Analysis
13.16. Stellantis
13.16.1. Business Overview
13.16.2. Company Snapshot
13.16.3. Company Market Share Analysis
13.16.4. Company Product Portfolio
13.16.5. Recent Developments
13.16.6. SWOT Analysis
List of Table
1. Global EV Insurance Market, By EV Type, 2019-2032 (USD Billion)
2. Global Battery Operated, EV Insurance Market, By Region, 2019-2032 (USD Billion)
3. Global Hybrid, EV Insurance Market, By Region, 2019-2032 (USD Billion)
4. Global EV Insurance Market, By Plan Type, 2019-2032 (USD Billion)
5. Global Third Party Liability Coverage, EV Insurance Market, By Region, 2019-2032 (USD Billion)
6. Global Comprehensive Coverage, EV Insurance Market, By Region, 2019-2032 (USD Billion)
7. Global EV Insurance Market, By Vehicle Type, 2019-2032 (USD Billion)
8. Global Commercial, EV Insurance Market, By Region, 2019-2032 (USD Billion)
9. Global Passenger, EV Insurance Market, By Region, 2019-2032 (USD Billion)
10. Global EV Insurance Market, By Coverage, 2019-2032 (USD Billion)
11. Global Accidental Damage, EV Insurance Market, By Region, 2019-2032 (USD Billion)
12. Global Theft, EV Insurance Market, By Region, 2019-2032 (USD Billion)
13. Global Natural Disaster Damage, EV Insurance Market, By Region, 2019-2032 (USD Billion)
14. Global Fire Damage, EV Insurance Market, By Region, 2019-2032 (USD Billion)
15. Global Battery or Parts Replacement, EV Insurance Market, By Region, 2019-2032 (USD Billion)
16. Global EV Insurance Market, By Distribution Channel, 2019-2032 (USD Billion)
17. Global Banks, EV Insurance Market, By Region, 2019-2032 (USD Billion)
18. Global Insurance Companies, EV Insurance Market, By Region, 2019-2032 (USD Billion)
19. Global Online Brokers, EV Insurance Market, By Region, 2019-2032 (USD Billion)
20. Global OEMs, EV Insurance Market, By Region, 2019-2032 (USD Billion)
21. Global EV Insurance Market, By Region, 2019-2032 (USD Billion)
22. North America EV Insurance Market, By EV Type, 2019-2032 (USD Billion)
23. North America EV Insurance Market, By Plan Type, 2019-2032 (USD Billion)
24. North America EV Insurance Market, By Vehicle Type, 2019-2032 (USD Billion)
25. North America EV Insurance Market, By Coverage, 2019-2032 (USD Billion)
26. North America EV Insurance Market, By Distribution Channel, 2019-2032 (USD Billion)
27. U.S. EV Insurance Market, By EV Type, 2019-2032 (USD Billion)
28. U.S. EV Insurance Market, By Plan Type, 2019-2032 (USD Billion)
29. U.S. EV Insurance Market, By Vehicle Type, 2019-2032 (USD Billion)
30. U.S. EV Insurance Market, By Coverage, 2019-2032 (USD Billion)
31. U.S. EV Insurance Market, By Distribution Channel, 2019-2032 (USD Billion)
32. Canada EV Insurance Market, By EV Type, 2019-2032 (USD Billion)
33. Canada EV Insurance Market, By Plan Type, 2019-2032 (USD Billion)
34. Canada EV Insurance Market, By Vehicle Type, 2019-2032 (USD Billion)
35. Canada EV Insurance Market, By Coverage, 2019-2032 (USD Billion)
36. Canada EV Insurance Market, By Distribution Channel, 2019-2032 (USD Billion)
37. Mexico EV Insurance Market, By EV Type, 2019-2032 (USD Billion)
38. Mexico EV Insurance Market, By Plan Type, 2019-2032 (USD Billion)
39. Mexico EV Insurance Market, By Vehicle Type, 2019-2032 (USD Billion)
40. Mexico EV Insurance Market, By Coverage, 2019-2032 (USD Billion)
41. Mexico EV Insurance Market, By Distribution Channel, 2019-2032 (USD Billion)
42. Europe EV Insurance Market, By EV Type, 2019-2032 (USD Billion)
43. Europe EV Insurance Market, By Plan Type, 2019-2032 (USD Billion)
44. Europe EV Insurance Market, By Vehicle Type, 2019-2032 (USD Billion)
45. Europe EV Insurance Market, By Coverage, 2019-2032 (USD Billion)
46. Europe EV Insurance Market, By Distribution Channel, 2019-2032 (USD Billion)
47. Germany EV Insurance Market, By EV Type, 2019-2032 (USD Billion)
48. Germany EV Insurance Market, By Plan Type, 2019-2032 (USD Billion)
49. Germany EV Insurance Market, By Vehicle Type, 2019-2032 (USD Billion)
50. Germany EV Insurance Market, By Coverage, 2019-2032 (USD Billion)
51. Germany EV Insurance Market, By Distribution Channel, 2019-2032 (USD Billion)
52. France EV Insurance Market, By EV Type, 2019-2032 (USD Billion)
53. France EV Insurance Market, By Plan Type, 2019-2032 (USD Billion)
54. France EV Insurance Market, By Vehicle Type, 2019-2032 (USD Billion)
55. France EV Insurance Market, By Coverage, 2019-2032 (USD Billion)
56. France EV Insurance Market, By Distribution Channel, 2019-2032 (USD Billion)
57. U.K. EV Insurance Market, By EV Type, 2019-2032 (USD Billion)
58. U.K. EV Insurance Market, By Plan Type, 2019-2032 (USD Billion)
59. U.K. EV Insurance Market, By Vehicle Type, 2019-2032 (USD Billion)
60. U.K. EV Insurance Market, By Coverage, 2019-2032 (USD Billion)
61. U.K. EV Insurance Market, By Distribution Channel, 2019-2032 (USD Billion)
62. Italy EV Insurance Market, By EV Type, 2019-2032 (USD Billion)
63. Italy EV Insurance Market, By Plan Type, 2019-2032 (USD Billion)
64. Italy EV Insurance Market, By Vehicle Type, 2019-2032 (USD Billion)
65. Italy EV Insurance Market, By Coverage, 2019-2032 (USD Billion)
66. Italy EV Insurance Market, By Distribution Channel, 2019-2032 (USD Billion)
67. Spain EV Insurance Market, By EV Type, 2019-2032 (USD Billion)
68. Spain EV Insurance Market, By Plan Type, 2019-2032 (USD Billion)
69. Spain EV Insurance Market, By Vehicle Type, 2019-2032 (USD Billion)
70. Spain EV Insurance Market, By Coverage, 2019-2032 (USD Billion)
71. Spain EV Insurance Market, By Distribution Channel, 2019-2032 (USD Billion)
72. Asia Pacific EV Insurance Market, By EV Type, 2019-2032 (USD Billion)
73. Asia Pacific EV Insurance Market, By Plan Type, 2019-2032 (USD Billion)
74. Asia Pacific EV Insurance Market, By Vehicle Type, 2019-2032 (USD Billion)
75. Asia Pacific EV Insurance Market, By Coverage, 2019-2032 (USD Billion)
76. Asia Pacific EV Insurance Market, By Distribution Channel, 2019-2032 (USD Billion)
77. Japan EV Insurance Market, By EV Type, 2019-2032 (USD Billion)
78. Japan EV Insurance Market, By Plan Type, 2019-2032 (USD Billion)
79. Japan EV Insurance Market, By Vehicle Type, 2019-2032 (USD Billion)
80. Japan EV Insurance Market, By Coverage, 2019-2032 (USD Billion)
81. Japan EV Insurance Market, By Distribution Channel, 2019-2032 (USD Billion)
82. China EV Insurance Market, By EV Type, 2019-2032 (USD Billion)
83. China EV Insurance Market, By Plan Type, 2019-2032 (USD Billion)
84. China EV Insurance Market, By Vehicle Type, 2019-2032 (USD Billion)
85. China EV Insurance Market, By Coverage, 2019-2032 (USD Billion)
86. China EV Insurance Market, By Distribution Channel, 2019-2032 (USD Billion)
87. India EV Insurance Market, By EV Type, 2019-2032 (USD Billion)
88. India EV Insurance Market, By Plan Type, 2019-2032 (USD Billion)
89. India EV Insurance Market, By Vehicle Type, 2019-2032 (USD Billion)
90. India EV Insurance Market, By Coverage, 2019-2032 (USD Billion)
91. India EV Insurance Market, By Distribution Channel, 2019-2032 (USD Billion)
92. South America EV Insurance Market, By EV Type, 2019-2032 (USD Billion)
93. South America EV Insurance Market, By Plan Type, 2019-2032 (USD Billion)
94. South America EV Insurance Market, By Vehicle Type, 2019-2032 (USD Billion)
95. South America EV Insurance Market, By Coverage, 2019-2032 (USD Billion)
96. South America EV Insurance Market, By Distribution Channel, 2019-2032 (USD Billion)
97. Brazil EV Insurance Market, By EV Type, 2019-2032 (USD Billion)
98. Brazil EV Insurance Market, By Plan Type, 2019-2032 (USD Billion)
99. Brazil EV Insurance Market, By Vehicle Type, 2019-2032 (USD Billion)
100. Brazil EV Insurance Market, By Coverage, 2019-2032 (USD Billion)
101. Brazil EV Insurance Market, By Distribution Channel, 2019-2032 (USD Billion)
102. Middle East and Africa EV Insurance Market, By EV Type, 2019-2032 (USD Billion)
103. Middle East and Africa EV Insurance Market, By Plan Type, 2019-2032 (USD Billion)
104. Middle East and Africa EV Insurance Market, By Vehicle Type, 2019-2032 (USD Billion)
105. Middle East and Africa EV Insurance Market, By Coverage, 2019-2032 (USD Billion)
106. Middle East and Africa EV Insurance Market, By Distribution Channel, 2019-2032 (USD Billion)
107. UAE EV Insurance Market, By EV Type, 2019-2032 (USD Billion)
108. UAE EV Insurance Market, By Plan Type, 2019-2032 (USD Billion)
109. UAE EV Insurance Market, By Vehicle Type, 2019-2032 (USD Billion)
110. UAE EV Insurance Market, By Coverage, 2019-2032 (USD Billion)
111. UAE EV Insurance Market, By Distribution Channel, 2019-2032 (USD Billion)
112. South Africa EV Insurance Market, By EV Type, 2019-2032 (USD Billion)
113. South Africa EV Insurance Market, By Plan Type, 2019-2032 (USD Billion)
114. South Africa EV Insurance Market, By Vehicle Type, 2019-2032 (USD Billion)
115. South Africa EV Insurance Market, By Coverage, 2019-2032 (USD Billion)
116. South Africa EV Insurance Market, By Distribution Channel, 2019-2032 (USD Billion)
List of Figures
1. Global EV Insurance Market Segmentation
2. EV Insurance Market: Research Methodology
3. Market Size Estimation Methodology: Bottom-Up Approach
4. Market Size Estimation Methodology: Top-Down Approach
5. Data Triangulation
6. Porter’s Five Forces Analysis
7. Value Chain Analysis
8. Global EV Insurance Market Attractiveness Analysis by EV Type
9. Global EV Insurance Market Attractiveness Analysis by Plan Type
10. Global EV Insurance Market Attractiveness Analysis by Vehicle Type
11. Global EV Insurance Market Attractiveness Analysis by Coverage
12. Global EV Insurance Market Attractiveness Analysis by Distribution Channel
13. Global EV Insurance Market Attractiveness Analysis by Region
14. Global EV Insurance Market: Dynamics
15. Global EV Insurance Market Share by EV Type (2022 & 2032)
16. Global EV Insurance Market Share by Plan Type (2022 & 2032)
17. Global EV Insurance Market Share by Vehicle Type (2022 & 2032)
18. Global EV Insurance Market Share by Coverage (2022 & 2032)
19. Global EV Insurance Market Share by Distribution Channel (2022 & 2032)
20. Global EV Insurance Market Share by Regions (2022 & 2032)
21. Global EV Insurance Market Share by Company (2022)
This study forecasts revenue at global, regional, and country levels from 2019 to 2032. The Brainy Insights has segmented the global EV Insurance market based on below mentioned segments:
Global EV Insurance Market by EV Type:
Global EV Insurance Market by Plan Type:
Global EV Insurance Market by Vehicle Type:
Global EV Insurance Market by Coverage:
Global EV Insurance Market by Distribution Channel:
Global EV Insurance Market by Region:
Research has its special purpose to undertake marketing efficiently. In this competitive scenario, businesses need information across all industry verticals; the information about customer wants, market demand, competition, industry trends, distribution channels etc. This information needs to be updated regularly because businesses operate in a dynamic environment. Our organization, The Brainy Insights incorporates scientific and systematic research procedures in order to get proper market insights and industry analysis for overall business success. The analysis consists of studying the market from a miniscule level wherein we implement statistical tools which helps us in examining the data with accuracy and precision.
Our research reports feature both; quantitative and qualitative aspects for any market. Qualitative information for any market research process are fundamental because they reveal the customer needs and wants, usage and consumption for any product/service related to a specific industry. This in turn aids the marketers/investors in knowing certain perceptions of the customers. Qualitative research can enlighten about the different product concepts and designs along with unique service offering that in turn, helps define marketing problems and generate opportunities. On the other hand, quantitative research engages with the data collection process through interviews, e-mail interactions, surveys and pilot studies. Quantitative aspects for the market research are useful to validate the hypotheses generated during qualitative research method, explore empirical patterns in the data with the help of statistical tools, and finally make the market estimations.
The Brainy Insights offers comprehensive research and analysis, based on a wide assortment of factual insights gained through interviews with CXOs and global experts and secondary data from reliable sources. Our analysts and industry specialist assume vital roles in building up statistical tools and analysis models, which are used to analyse the data and arrive at accurate insights with exceedingly informative research discoveries. The data provided by our organization have proven precious to a diverse range of companies, facilitating them to address issues such as determining which products/services are the most appealing, whether or not customers use the product in the manner anticipated, the purchasing intentions of the market and many others.
Our research methodology encompasses an idyllic combination of primary and secondary initiatives. Key phases involved in this process are listed below:

The phase involves the gathering and collecting of market data and its related information with the help of different sources & research procedures.

The data procurement stage involves in data gathering and collecting through various data sources.
This stage involves in extensive research. These data sources includes:
Purchased Database: Purchased databases play a crucial role in estimating the market sizes irrespective of the domain. Our purchased database includes:
Primary Research: The Brainy Insights interacts with leading companies and experts of the concerned domain to develop the analyst team’s market understanding and expertise. It improves and substantiates every single data presented in the market reports. Primary research mainly involves in telephonic interviews, E-mail interactions and face-to-face interviews with the raw material providers, manufacturers/producers, distributors, & independent consultants. The interviews that we conduct provides valuable data on market size and industry growth trends prevailing in the market. Our organization also conducts surveys with the various industry experts in order to gain overall insights of the industry/market. For instance, in healthcare industry we conduct surveys with the pharmacists, doctors, surgeons and nurses in order to gain insights and key information of a medical product/device/equipment which the customers are going to usage. Surveys are conducted in the form of questionnaire designed by our own analyst team. Surveys plays an important role in primary research because surveys helps us to identify the key target audiences of the market. Additionally, surveys helps to identify the key target audience engaged with the market. Our survey team conducts the survey by targeting the key audience, thus gaining insights from them. Based on the perspectives of the customers, this information is utilized to formulate market strategies. Moreover, market surveys helps us to understand the current competitive situation of the industry. To be precise, our survey process typically involve with the 360 analysis of the market. This analytical process begins by identifying the prospective customers for a product or service related to the market/industry to obtain data on how a product/service could fit into customers’ lives.

Secondary Research: The secondary data sources includes information published by the on-profit organizations such as World bank, WHO, company fillings, investor presentations, annual reports, national government documents, statistical databases, blogs, articles, white papers and others. From the annual report, we analyse a company’s revenue to understand the key segment and market share of that organization in a particular region. We analyse the company websites and adopt the product mapping technique which is important for deriving the segment revenue. In the product mapping method, we select and categorize the products offered by the companies catering to domain specific market, deduce the product revenue for each of the companies so as to get overall estimation of the market size. We also source data and analyses trends based on information received from supply side and demand side intermediaries in the value chain. The supply side denotes the data gathered from supplier, distributor, wholesaler and the demand side illustrates the data gathered from the end customers for respective market domain.

The supply side for a domain specific market is analysed by:
The demand side for the market is estimated through:
In-house Library: Apart from these third-party sources, we have our in-house library of qualitative and quantitative information. Our in-house database includes market data for various industry and domains. These data are updated on regular basis as per the changing market scenario. Our library includes, historic databases, internal audit reports and archives.
Sometimes there are instances where there is no metadata or raw data available for any domain specific market. For those cases, we use our expertise to forecast and estimate the market size in order to generate comprehensive data sets. Our analyst team adopt a robust research technique in order to produce the estimates:
Data Synthesis: This stage involves the analysis & mapping of all the information obtained from the previous step. It also involves in scrutinizing the data for any discrepancy observed while data gathering related to the market. The data is collected with consideration to the heterogeneity of sources. Robust scientific techniques are in place for synthesizing disparate data sets and provide the essential contextual information that can orient market strategies. The Brainy Insights has extensive experience in data synthesis where the data passes through various stages:


Market Deduction & Formulation: The final stage comprises of assigning data points at appropriate market spaces so as to deduce feasible conclusions. Analyst perspective & subject matter expert based holistic form of market sizing coupled with industry analysis also plays a crucial role in this stage.
This stage involves in finalization of the market size and numbers that we have collected from data integration step. With data interpolation, it is made sure that there is no gap in the market data. Successful trend analysis is done by our analysts using extrapolation techniques, which provide the best possible forecasts for the market.
Data Validation & Market Feedback: Validation is the most important step in the process. Validation & re-validation via an intricately designed process helps us finalize data-points to be used for final calculations.

The Brainy Insights interacts with leading companies and experts of the concerned domain to develop the analyst team’s market understanding and expertise. It improves and substantiates every single data presented in the market reports. The data validation interview and discussion panels are typically composed of the most experienced industry members. The participants include, however, are not limited to:
Moreover, we always validate our data and findings through primary respondents from all the major regions we are working on.


Free Customization
Fortune 500 Clients
Free Yearly Update On Purchase Of Multi/Corporate License
Companies Served Till Date