- +1-315-215-1633
- sales@thebrainyinsights.com

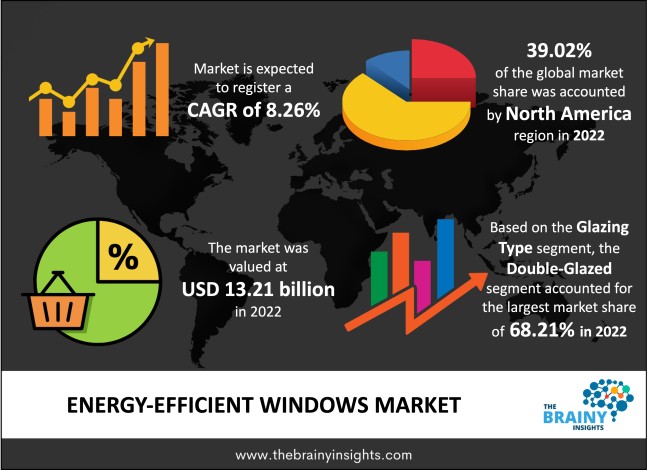
The global energy-efficient windows market was valued at USD 13.21 Billion in 2022 and grew at a CAGR of 8.26% from 2023 to 2032. The market is expected to reach USD 29.21 Billion by 2032. The demand for energy-efficient windows is increasing among commercial and residential applications owing to rising awareness about sustainability. Further, increasing investment in energy-efficient infrastructure will provide lucrative opportunities to the market.
A window that reduces the amount of artificial heating and cooling in a building is considered energy efficient. Over the past 25 years, technological advancements have made it feasible to build windows with up to four times the heat and cold insulation of traditional windows. Windows with low energy consumption are now carefully considered for new and old residences. Windows comprises several parts, including the glass, hardware and frame, all of which work together to give a specific level of performance. Energy-efficient components offer significant protection against heat gain and loss and lower the building's energy consumption. Double and triple glazing are both covered under energy-efficient glazing. These are sealed windows that have two or more glass panes. Additionally, one can increase their home's energy efficiency by adding secondary glazing or hanging thick curtains.
Get an overview of this study by requesting a free sample
Increasing use of energy-efficient windows in commercial buildings: They are crucial for business buildings since they raise comfort and productivity while drastically lowering energy expenses and consumption. Low-e coatings, Gas fills, and double panes are the most often utilized technologies to increase window energy efficiency. By implementing energy-efficient windows, commercial buildings can lessen their environmental effect and give their users more sustainable areas. Energy-efficient windows let natural light in while limiting the amount of heat transmission via the windows, which helps lower the building's energy use. The building becomes more sustainable due to the decreased energy use, resulting in cheaper energy expenses and a smaller carbon footprint.
High installation cost: The installation of energy-efficient windows is costly. The average cost of installing such windows, including materials and expert labour, ranges from $320 to $2,000 per window. The size, material and kind of the window all affect the price. One should budget an additional $100 to $300 per window, or roughly $40 per hour if they employ a professional to install them.
Increasing investment in energy-efficient infrastructure: To reach net-zero emissions by 2050, the International Energy Agency estimates yearly investments in energy sector infrastructure and technology will need to rise from more than $1 trillion to $4 trillion by 2030. Infrastructure spending is crucial to accelerating economic growth. Implementing sustainability activities across their infrastructure can have a significant effect on lowering carbon emissions. The construction industry has a rapid demand for energy-efficient windows. Both residential and commercial buildings have increased in developed and developing regions. Also, the regional government has increased its funding for infrastructural development. Governments have launched various plans, especially in the USA, Canada, and Brazil, to promote the development of energy-efficient commercial spaces. Thus creating lucrative opportunities for the manufacturers engaged in the energy-efficient windows market.
The regions analyzed for the market include North America, Europe, South America, Asia Pacific, the Middle East, and Africa. North America emerged as the most significant Energy Efficient Windows market, with a 39.02% market revenue share in 2022.
North America region will account for the largest market share with revenue growth. Due to growing investment in such infrastructure, nations such as the U.S., Canada and Mexico have a tremendous demand for energy-efficient windows. Further, the rapid industrialization rate provides lucrative opportunities for the market. Many organizations are investing in sustainable building technology, leading to the high adoption of energy-efficient windows.
North American region Energy Efficient Windows Market Share in 2022 - 39.02%
www.thebrainyinsights.com
Check the geographical analysis of this market by requesting a free sample
The component segment is divided into frame, hardware and glass. The glass segment dominated the market, with a share of around 43.30% in 2022. Glass is the most important component of an energy-efficient window. Thus, low-emissivity glass is energy-efficient and keeps heat from escaping through the windows and into the chilly outside. The invisible coating on glass significantly minimizes heat transfer and reflects interior heat into the space.
The glazing type segment is divided into double-glazed, triple-glazed glazed and others. The double-glazed segment dominated the market, with a share of around 68.21% in 2022. Double glazing is the standard for all high-performance windows in cold, hot, and mixed climates. Double glazing offers the optimum thermal performance when paired with argon gas between panes and Low-E glass on at least one of the panes.
The construction type segment is divided into new construction and renovation. The new construction segment dominated the market, with a share of around 67.03% in 2022. Consumers choose new construction most of the time when opting for energy-efficient windows. New frames may occasionally benefit areas with excessive moisture, mould, content, or decay.
The end-use segment is divided into residential and commercial. The commercial segment dominated the market, with a share of around 76.12% in 2022. Windows in commercial buildings have several functions, including letting in natural light, offering views, and enhancing a building's outside beauty. The major factor influencing a commercial building's energy efficiency is its windows. The majority of contemporary business buildings have windows with some tempered safety glass.
| Attribute | Description |
|---|---|
| Market Size | Revenue (USD Billion) |
| Market size value in 2022 | USD 13.21 Billion |
| Market size value in 2032 | USD 29.21 Billion |
| CAGR (2023 to 2032) | 8.26% |
| Historical data | 2019-2021 |
| Base Year | 2022 |
| Forecast | 2023-2032 |
| Region | The regions analyzed for the market are Asia Pacific, Europe, South America, North America, and Middle East & Africa. Furthermore, the regions are further analyzed at the country level. |
| Segments | Component, Glazing Type, Construction Type and End-use |
As per The Brainy Insights, the size of the energy efficient windows market was valued USD 13.21 billion in 2022 to USD 29.21 billion by 2032.
Global energy efficient windows market is growing at a CAGR of 8.26% during the forecast period 2023-2032.
North America region emerged as the largest market for the energy efficient windows.
The market's growth will be influenced by the rising usage of energy efficient windows in commercial application.
The high installation cost can hamper the market growth.
The rising investment in energy efficient buildings is providing lucrative opportunities to the market.
1. Introduction
1.1. Objectives of the Study
1.2. Market Definition
1.3. Research Scope
1.4. Currency
1.5. Key Target Audience
2. Research Methodology and Assumptions
3. Executive Summary
4. Premium Insights
4.1. Porter’s Five Forces Analysis
4.2. Value Chain Analysis
4.3. Top Investment Pockets
4.3.1. Market Attractiveness Analysis by Component
4.3.2. Market Attractiveness Analysis by Glazing Type
4.3.3. Market Attractiveness Analysis by Construction Type
4.3.4. Market Attractiveness Analysis by End-use
4.3.5. Market Attractiveness Analysis by Region
4.4. Industry Trends
5. Market Dynamics
5.1. Market Evaluation
5.2. Drivers
5.2.1. Increasing usage of energy efficient windows
5.3. Restraints
5.3.1. High instalment cost
5.4. Opportunities
5.4.1. Increasing investment in energy efficient infrastructure
5.5. Challenges
5.5.1. Lower awareness
6. Global Energy Efficient Windows Market Analysis and Forecast, By Component
6.1. Segment Overview
6.2. Frame
6.3. Hardware
6.4. Glass
7. Global Energy Efficient Windows Market Analysis and Forecast, By Glazing Type
7.1. Segment Overview
7.2. Double Gazed
7.3. Triple Glazed
7.4. Others
8. Global Energy Efficient Windows Market Analysis and Forecast, By Construction Type
8.1. Segment Overview
8.2. New Construction
8.3. Renovation
9. Global Energy Efficient Windows Market Analysis and Forecast, By End-use
9.1. Segment Overview
9.2. Residential
9.3. Commercial
10. Global Energy Efficient Windows Market Analysis and Forecast, By Regional Analysis
10.1. Segment Overview
10.2. North America
10.2.1. U.S.
10.2.2. Canada
10.2.3. Mexico
10.3. Europe
10.3.1. Germany
10.3.2. France
10.3.3. U.K.
10.3.4. Italy
10.3.5. Spain
10.4. Asia-Pacific
10.4.1. Japan
10.4.2. China
10.4.3. India
10.5. South America
10.5.1. Brazil
10.6. Middle East and Africa
10.6.1. UAE
10.6.2. South Africa
11. Global Energy Efficient Windows Market-Competitive Landscape
11.1. Overview
11.2. Market Share of Key Players in the Energy Efficient Windows Market
11.2.1. Global Company Market Share
11.2.2. North America Company Market Share
11.2.3. Europe Company Market Share
11.2.4. APAC Company Market Share
11.3. Competitive Situations and Trends
11.3.1. Product Launches and Developments
11.3.2. Partnerships, Collaborations, and Agreements
11.3.3. Mergers & Acquisitions
11.3.4. Expansions
12. Company Profiles
12.1. Deceuninck Group
12.1.1. Business Overview
12.1.2. Company Snapshot
12.1.3. Company Market Share Analysis
12.1.4. Company Product Portfolio
12.1.5. Recent Developments
12.1.6. SWOT Analysis
12.2. VKR Holdings A/S
12.2.1. Business Overview
12.2.2. Company Snapshot
12.2.3. Company Market Share Analysis
12.2.4. Company Product Portfolio
12.2.5. Recent Developments
12.2.6. SWOT Analysis
12.3. Masco Corporation
12.3.1. Business Overview
12.3.2. Company Snapshot
12.3.3. Company Market Share Analysis
12.3.4. Company Product Portfolio
12.3.5. Recent Developments
12.3.6. SWOT Analysis
12.4. Rehau Limited
12.4.1. Business Overview
12.4.2. Company Snapshot
12.4.3. Company Market Share Analysis
12.4.4. Company Product Portfolio
12.4.5. Recent Developments
12.4.6. SWOT Analysis
12.5. Andersen Corporation
12.5.1. Business Overview
12.5.2. Company Snapshot
12.5.3. Company Market Share Analysis
12.5.4. Company Product Portfolio
12.5.5. Recent Developments
12.5.6. SWOT Analysis
12.6. Jeld-Wen Holding, Inc.
12.6.1. Business Overview
12.6.2. Company Snapshot
12.6.3. Company Market Share Analysis
12.6.4. Company Product Portfolio
12.6.5. Recent Developments
12.6.6. SWOT Analysis
12.7. Cornerstone Building Brands
12.7.1. Business Overview
12.7.2. Company Snapshot
12.7.3. Company Market Share Analysis
12.7.4. Company Product Portfolio
12.7.5. Recent Developments
12.7.6. SWOT Analysis
12.8. PGT Innovations, Inc.
12.8.1. Business Overview
12.8.2. Company Snapshot
12.8.3. Company Market Share Analysis
12.8.4. Company Product Portfolio
12.8.5. Recent Developments
12.8.6. SWOT Analysis
12.9. YKK Corporation
12.9.1. Business Overview
12.9.2. Company Snapshot
12.9.3. Company Market Share Analysis
12.9.4. Company Product Portfolio
12.9.5. Recent Developments
12.9.6. SWOT Analysis
12.10. Marvin
12.10.1. Business Overview
12.10.2. Company Snapshot
12.10.3. Company Market Share Analysis
12.10.4. Company Product Portfolio
12.10.5. Recent Developments
12.10.6. SWOT Analysis
12.11. Saint-Gobain S.A.
12.11.1. Business Overview
12.11.2. Company Snapshot
12.11.3. Company Market Share Analysis
12.11.4. Company Product Portfolio
12.11.5. Recent Developments
12.11.6. SWOT Analysis
12.12. Nippon Sheet Glass Co. Ltd.
12.12.1. Business Overview
12.12.2. Company Snapshot
12.12.3. Company Market Share Analysis
12.12.4. Company Product Portfolio
12.12.5. Recent Developments
12.12.6. SWOT Analysis
12.13. Schott AG
12.13.1. Business Overview
12.13.2. Company Snapshot
12.13.3. Company Market Share Analysis
12.13.4. Company Product Portfolio
12.13.5. Recent Developments
12.13.6. SWOT Analysis
12.14. BMC Stock Holdings, Inc
12.14.1. Business Overview
12.14.2. Company Snapshot
12.14.3. Company Market Share Analysis
12.14.4. Company Product Portfolio
12.14.5. Recent Developments
12.14.6. SWOT Analysis
List of Table
1. Global Energy Efficient Windows Market, By Component, 2019-2032 (USD Billion)
2. Global Frame, Energy Efficient Windows Market, By Region, 2019-2032 (USD Billion)
3. Global Hardware, Energy Efficient Windows Market, By Region, 2019-2032 (USD Billion)
4. Global Glass, Energy Efficient Windows Market, By Region, 2019-2032 (USD Billion)
5. Global Energy Efficient Windows Market, By Glazing Type, 2019-2032 (USD Billion)
6. Global Double Gazed, Energy Efficient Windows Market, By Region, 2019-2032 (USD Billion)
7. Global Triple Glazed, Energy Efficient Windows Market, By Region, 2019-2032 (USD Billion)
8. Global Others, Energy Efficient Windows Market, By Region, 2019-2032 (USD Billion)
9. Global Energy Efficient Windows Market, By Construction Type, 2019-2032 (USD Billion)
10. Global New Construction, Energy Efficient Windows Market, By Region, 2019-2032 (USD Billion)
11. Global Renovation, Energy Efficient Windows Market, By Region, 2019-2032 (USD Billion)
12. Global Energy Efficient Windows Market, By End-use, 2019-2032 (USD Billion)
13. Global Residential, Energy Efficient Windows Market, By Region, 2019-2032 (USD Billion)
14. Global Commercial, Energy Efficient Windows Market, By Region, 2019-2032 (USD Billion)
15. Global Energy Efficient Windows Market, By Region, 2019-2032 (USD Billion)
16. North America Energy Efficient Windows Market, By Component, 2019-2032 (USD Billion)
17. North America Energy Efficient Windows Market, By Glazing Type, 2019-2032 (USD Billion)
18. North America Energy Efficient Windows Market, By Construction Type, 2019-2032 (USD Billion)
19. North America Energy Efficient Windows Market, By End-use, 2019-2032 (USD Billion)
20. U.S. Energy Efficient Windows Market, By Component, 2019-2032 (USD Billion)
21. U.S. Energy Efficient Windows Market, By Glazing Type, 2019-2032 (USD Billion)
22. U.S. Energy Efficient Windows Market, By Construction Type, 2019-2032 (USD Billion)
23. U.S. Energy Efficient Windows Market, By End-use, 2019-2032 (USD Billion)
24. Canada Energy Efficient Windows Market, By Component, 2019-2032 (USD Billion)
25. Canada Energy Efficient Windows Market, By Glazing Type, 2019-2032 (USD Billion)
26. Canada Energy Efficient Windows Market, By Construction Type, 2019-2032 (USD Billion)
27. Canada Energy Efficient Windows Market, By End-use, 2019-2032 (USD Billion)
28. Mexico Energy Efficient Windows Market, By Component, 2019-2032 (USD Billion)
29. Mexico Energy Efficient Windows Market, By Glazing Type, 2019-2032 (USD Billion)
30. Mexico Energy Efficient Windows Market, By Construction Type, 2019-2032 (USD Billion)
31. Mexico Energy Efficient Windows Market, By End-use, 2019-2032 (USD Billion)
32. Europe Energy Efficient Windows Market, By Component, 2019-2032 (USD Billion)
33. Europe Energy Efficient Windows Market, By Glazing Type, 2019-2032 (USD Billion)
34. Europe Energy Efficient Windows Market, By Construction Type, 2019-2032 (USD Billion)
35. Europe Energy Efficient Windows Market, By End-use, 2019-2032 (USD Billion)
36. Germany Energy Efficient Windows Market, By Component, 2019-2032 (USD Billion)
37. Germany Energy Efficient Windows Market, By Glazing Type, 2019-2032 (USD Billion)
38. Germany Energy Efficient Windows Market, By Construction Type, 2019-2032 (USD Billion)
39. Germany Energy Efficient Windows Market, By End-use, 2019-2032 (USD Billion)
40. France Energy Efficient Windows Market, By Component, 2019-2032 (USD Billion)
41. France Energy Efficient Windows Market, By Glazing Type, 2019-2032 (USD Billion)
42. France Energy Efficient Windows Market, By Construction Type, 2019-2032 (USD Billion)
43. France Energy Efficient Windows Market, By End-use, 2019-2032 (USD Billion)
44. U.K. Energy Efficient Windows Market, By Component, 2019-2032 (USD Billion)
45. U.K. Energy Efficient Windows Market, By Glazing Type, 2019-2032 (USD Billion)
46. U.K. Energy Efficient Windows Market, By Construction Type, 2019-2032 (USD Billion)
47. U.K. Energy Efficient Windows Market, By End-use, 2019-2032 (USD Billion)
48. Italy Energy Efficient Windows Market, By Component, 2019-2032 (USD Billion)
49. Italy Energy Efficient Windows Market, By Glazing Type, 2019-2032 (USD Billion)
50. Italy Energy Efficient Windows Market, By Construction Type, 2019-2032 (USD Billion)
51. Italy Energy Efficient Windows Market, By End-use, 2019-2032 (USD Billion)
52. Spain Energy Efficient Windows Market, By Component, 2019-2032 (USD Billion)
53. Spain Energy Efficient Windows Market, By Glazing Type, 2019-2032 (USD Billion)
54. Spain Energy Efficient Windows Market, By Construction Type, 2019-2032 (USD Billion)
55. Spain Energy Efficient Windows Market, By End-use, 2019-2032 (USD Billion)
56. Asia Pacific Energy Efficient Windows Market, By Component, 2019-2032 (USD Billion)
57. Asia Pacific Energy Efficient Windows Market, By Glazing Type, 2019-2032 (USD Billion)
58. Asia Pacific Energy Efficient Windows Market, By Construction Type, 2019-2032 (USD Billion)
59. Asia Pacific Energy Efficient Windows Market, By End-use, 2019-2032 (USD Billion)
60. Japan Energy Efficient Windows Market, By Component, 2019-2032 (USD Billion)
61. Japan Energy Efficient Windows Market, By Glazing Type, 2019-2032 (USD Billion)
62. Japan Energy Efficient Windows Market, By Construction Type, 2019-2032 (USD Billion)
63. Japan Energy Efficient Windows Market, By End-use, 2019-2032 (USD Billion)
64. China Energy Efficient Windows Market, By Component, 2019-2032 (USD Billion)
65. China Energy Efficient Windows Market, By Glazing Type, 2019-2032 (USD Billion)
66. China Energy Efficient Windows Market, By Construction Type, 2019-2032 (USD Billion)
67. China Energy Efficient Windows Market, By End-use, 2019-2032 (USD Billion)
68. India Energy Efficient Windows Market, By Component, 2019-2032 (USD Billion)
69. India Energy Efficient Windows Market, By Glazing Type, 2019-2032 (USD Billion)
70. India Energy Efficient Windows Market, By Construction Type, 2019-2032 (USD Billion)
71. India Energy Efficient Windows Market, By End-use, 2019-2032 (USD Billion)
72. South America Energy Efficient Windows Market, By Component, 2019-2032 (USD Billion)
73. South America Energy Efficient Windows Market, By Glazing Type, 2019-2032 (USD Billion)
74. South America Energy Efficient Windows Market, By Construction Type, 2019-2032 (USD Billion)
75. South America Energy Efficient Windows Market, By End-use, 2019-2032 (USD Billion)
76. Brazil Energy Efficient Windows Market, By Component, 2019-2032 (USD Billion)
77. Brazil Energy Efficient Windows Market, By Glazing Type, 2019-2032 (USD Billion)
78. Brazil Energy Efficient Windows Market, By Construction Type, 2019-2032 (USD Billion)
79. BrazilEnergy Efficient Windows Market, By End-use, 2019-2032 (USD Billion)
80. Middle East and Africa Energy Efficient Windows Market, By Component, 2019-2032 (USD Billion)
81. Middle East and Africa Energy Efficient Windows Market, By Glazing Type, 2019-2032 (USD Billion)
82. Middle East and Africa Energy Efficient Windows Market, By Construction Type, 2019-2032 (USD Billion)
83. Middle East and Africa Energy Efficient Windows Market, By End-use, 2019-2032 (USD Billion)
84. UAE Energy Efficient Windows Market, By Component, 2019-2032 (USD Billion)
85. UAE Energy Efficient Windows Market, By Glazing Type, 2019-2032 (USD Billion)
86. UAE Energy Efficient Windows Market, By Construction Type, 2019-2032 (USD Billion)
87. UAE Energy Efficient Windows Market, By End-use, 2019-2032 (USD Billion)
88. South Africa Energy Efficient Windows Market, By Component, 2019-2032 (USD Billion)
89. South Africa Energy Efficient Windows Market, By Glazing Type, 2019-2032 (USD Billion)
90. South Africa Energy Efficient Windows Market, By Construction Type, 2019-2032 (USD Billion)
91. South Africa Energy Efficient Windows Market, By End-use, 2019-2032 (USD Billion)
List of Figures
1. Global Energy Efficient Windows Market Segmentation
2. Energy Efficient Windows Market: Research Methodology
3. Market Size Estimation Methodology: Bottom-Up Approach
4. Market Size Estimation Methodology: Top-Down Approach
5. Data Triangulation
6. Porter’s Five Forces Analysis
7. Value Chain Analysis
8. Global Energy Efficient Windows Market Attractiveness Analysis by Component
9. Global Energy Efficient Windows Market Attractiveness Analysis by Glazing Type
10. Global Energy Efficient Windows Market Attractiveness Analysis by Construction Type
11. Global Energy Efficient Windows Market Attractiveness Analysis by End-use
12. Global Energy Efficient Windows Market Attractiveness Analysis by Region
13. Global Energy Efficient Windows Market: Dynamics
14. Global Energy Efficient Windows Market Share by Component (2022 & 2032)
15. Global Energy Efficient Windows Market Share by Glazing Type (2022 & 2032)
16. Global Energy Efficient Windows Market Share by Construction Type (2022 & 2032)
17. Global Energy Efficient Windows Market Share by End-use (2022 & 2032)
18. Global Energy Efficient Windows Market Share by Regions (2022 & 2032)
19. Global Energy Efficient Windows Market Share by Company (2022)
This study forecasts revenue at global, regional, and country levels from 2019 to 2032. The Brainy Insights has segmented the global energy efficient windows market based on below mentioned segments:
Global Energy Efficient Windows Market by Component:
Global Energy Efficient Windows Market by Glazing Type:
Global Energy Efficient Windows Market by Construction Type:
Global Energy Efficient Windows Market by End-use:
Global Energy Efficient Windows Market by Region:
Research has its special purpose to undertake marketing efficiently. In this competitive scenario, businesses need information across all industry verticals; the information about customer wants, market demand, competition, industry trends, distribution channels etc. This information needs to be updated regularly because businesses operate in a dynamic environment. Our organization, The Brainy Insights incorporates scientific and systematic research procedures in order to get proper market insights and industry analysis for overall business success. The analysis consists of studying the market from a miniscule level wherein we implement statistical tools which helps us in examining the data with accuracy and precision.
Our research reports feature both; quantitative and qualitative aspects for any market. Qualitative information for any market research process are fundamental because they reveal the customer needs and wants, usage and consumption for any product/service related to a specific industry. This in turn aids the marketers/investors in knowing certain perceptions of the customers. Qualitative research can enlighten about the different product concepts and designs along with unique service offering that in turn, helps define marketing problems and generate opportunities. On the other hand, quantitative research engages with the data collection process through interviews, e-mail interactions, surveys and pilot studies. Quantitative aspects for the market research are useful to validate the hypotheses generated during qualitative research method, explore empirical patterns in the data with the help of statistical tools, and finally make the market estimations.
The Brainy Insights offers comprehensive research and analysis, based on a wide assortment of factual insights gained through interviews with CXOs and global experts and secondary data from reliable sources. Our analysts and industry specialist assume vital roles in building up statistical tools and analysis models, which are used to analyse the data and arrive at accurate insights with exceedingly informative research discoveries. The data provided by our organization have proven precious to a diverse range of companies, facilitating them to address issues such as determining which products/services are the most appealing, whether or not customers use the product in the manner anticipated, the purchasing intentions of the market and many others.
Our research methodology encompasses an idyllic combination of primary and secondary initiatives. Key phases involved in this process are listed below:

The phase involves the gathering and collecting of market data and its related information with the help of different sources & research procedures.

The data procurement stage involves in data gathering and collecting through various data sources.
This stage involves in extensive research. These data sources includes:
Purchased Database: Purchased databases play a crucial role in estimating the market sizes irrespective of the domain. Our purchased database includes:
Primary Research: The Brainy Insights interacts with leading companies and experts of the concerned domain to develop the analyst team’s market understanding and expertise. It improves and substantiates every single data presented in the market reports. Primary research mainly involves in telephonic interviews, E-mail interactions and face-to-face interviews with the raw material providers, manufacturers/producers, distributors, & independent consultants. The interviews that we conduct provides valuable data on market size and industry growth trends prevailing in the market. Our organization also conducts surveys with the various industry experts in order to gain overall insights of the industry/market. For instance, in healthcare industry we conduct surveys with the pharmacists, doctors, surgeons and nurses in order to gain insights and key information of a medical product/device/equipment which the customers are going to usage. Surveys are conducted in the form of questionnaire designed by our own analyst team. Surveys plays an important role in primary research because surveys helps us to identify the key target audiences of the market. Additionally, surveys helps to identify the key target audience engaged with the market. Our survey team conducts the survey by targeting the key audience, thus gaining insights from them. Based on the perspectives of the customers, this information is utilized to formulate market strategies. Moreover, market surveys helps us to understand the current competitive situation of the industry. To be precise, our survey process typically involve with the 360 analysis of the market. This analytical process begins by identifying the prospective customers for a product or service related to the market/industry to obtain data on how a product/service could fit into customers’ lives.

Secondary Research: The secondary data sources includes information published by the on-profit organizations such as World bank, WHO, company fillings, investor presentations, annual reports, national government documents, statistical databases, blogs, articles, white papers and others. From the annual report, we analyse a company’s revenue to understand the key segment and market share of that organization in a particular region. We analyse the company websites and adopt the product mapping technique which is important for deriving the segment revenue. In the product mapping method, we select and categorize the products offered by the companies catering to domain specific market, deduce the product revenue for each of the companies so as to get overall estimation of the market size. We also source data and analyses trends based on information received from supply side and demand side intermediaries in the value chain. The supply side denotes the data gathered from supplier, distributor, wholesaler and the demand side illustrates the data gathered from the end customers for respective market domain.

The supply side for a domain specific market is analysed by:
The demand side for the market is estimated through:
In-house Library: Apart from these third-party sources, we have our in-house library of qualitative and quantitative information. Our in-house database includes market data for various industry and domains. These data are updated on regular basis as per the changing market scenario. Our library includes, historic databases, internal audit reports and archives.
Sometimes there are instances where there is no metadata or raw data available for any domain specific market. For those cases, we use our expertise to forecast and estimate the market size in order to generate comprehensive data sets. Our analyst team adopt a robust research technique in order to produce the estimates:
Data Synthesis: This stage involves the analysis & mapping of all the information obtained from the previous step. It also involves in scrutinizing the data for any discrepancy observed while data gathering related to the market. The data is collected with consideration to the heterogeneity of sources. Robust scientific techniques are in place for synthesizing disparate data sets and provide the essential contextual information that can orient market strategies. The Brainy Insights has extensive experience in data synthesis where the data passes through various stages:


Market Deduction & Formulation: The final stage comprises of assigning data points at appropriate market spaces so as to deduce feasible conclusions. Analyst perspective & subject matter expert based holistic form of market sizing coupled with industry analysis also plays a crucial role in this stage.
This stage involves in finalization of the market size and numbers that we have collected from data integration step. With data interpolation, it is made sure that there is no gap in the market data. Successful trend analysis is done by our analysts using extrapolation techniques, which provide the best possible forecasts for the market.
Data Validation & Market Feedback: Validation is the most important step in the process. Validation & re-validation via an intricately designed process helps us finalize data-points to be used for final calculations.

The Brainy Insights interacts with leading companies and experts of the concerned domain to develop the analyst team’s market understanding and expertise. It improves and substantiates every single data presented in the market reports. The data validation interview and discussion panels are typically composed of the most experienced industry members. The participants include, however, are not limited to:
Moreover, we always validate our data and findings through primary respondents from all the major regions we are working on.


Free Customization
Fortune 500 Clients
Free Yearly Update On Purchase Of Multi/Corporate License
Companies Served Till Date