- +1-315-215-1633
- sales@thebrainyinsights.com

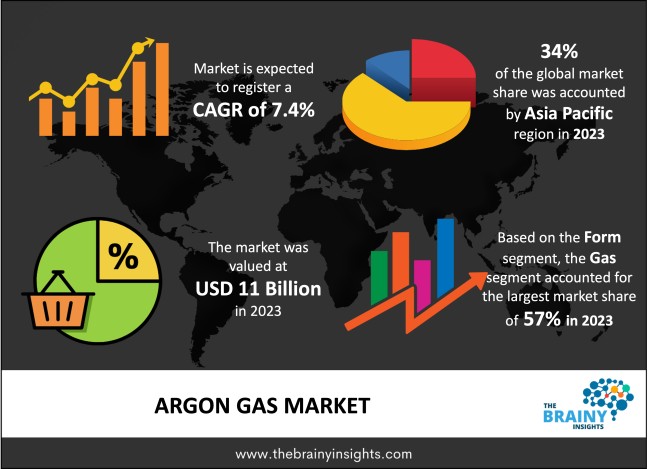
The global Argon Gas market was valued at USD 11 billion in 2023 and growing at a CAGR of 7.4% from 2024 to 2033. The market is expected to reach USD 22.46 billion by 2033. Increased demand for Argon Gas from the Electronics industry and increasing demand for Scuba-diving and dry suits are the major factors driving the growth of the Argon Gas Market. Whereas, increasing adoption of IOT (Internet of Things) to link machines with smart devices may propel the growth of the Argon Gas Market in the period forecasted.
Argon Gas is a chemical element produced through fractional distillation of liquid air. Argon’s resistance to cracking heat and thermal conductivity are the major factors contributing to the welding process.
Argon Gas comes in 2 major forms, Gas and Liquid. Whereas, it is used in varied End-User industries. Such as Healthcare, Food & Beverages, Electronics, Manufacturing, and Others. Increasing use in various industries, making of swimming costumes, IoT (Internet of Things), and others makes it a product witnessing potential to grow in the period forecasted.
Get an overview of this study by requesting a free sample
Increased demand for Argon Gas from the Electronics industry- Argon Gas has seen an upward trend in the market, owing to its increasing use in the Electronics Industry. Argon Gas is used as a carrier gas in these electronic devices. Thus, rising demand for smartphones, TVs, and Solar panels is one major driver propelling the growth of the Electronics Industry in the period forecasted.
Rising prices of Argon Gas- Higher prices of Argon gas and increasing transportation costs to port the product at respective locations make it a priority to switch over to the substitute one major threat to Argon Gas. Further, rising prices of raw materials in manufacturing Argon Gas may hamper Argon production which may hinder the growth of the Argon Gas Market in the long run.
Increasing adoption of IOT (Internet of Things) to link machines with smart devices – Growing adoption of IoT (Internet of Things) to link machines with smart devices, to get real-time insights may propel the growth of the Argon Gas Market. These systems help the industrial, manufacturing, and other on-site managers to envisage potential failures of the machinery. Thus, a major factor that may boost the growth of the Argon Gas Market in the period forecasted.
The regions analyzed for the market include North America, Europe, South America, Asia Pacific, the Middle East, and Africa. Asia Pacific dominated the market for the global Argon Gas market, thereby accounting for 34% of the total market. Owing to rising demand from the Food & Beverages and Healthcare industries in the market. Whereas, Europe has exhibited the highest growth rate in the region, owing to increasing demand from metal industries across various countries such as Germany, Italy, France, and others.
Asia Pacific Region Argon Gas Market Share in 2023 - 34%
www.thebrainyinsights.com
Check the geographical analysis of this market by requesting a free sample
Argon in Gas form is the dominating segment in the market. Thereby acquiring 57% in the year 2023. Owing to its increased use in the Healthcare and Automobile sector. Whereas, Argon in the liquid form has witnessed the fastest growth rate in the market, owing to its heavy use in laboratory and other scientific studies.
The manufacturing sector dominates the End-User Industry thereby acquiring 35% of the market share. Owing to inert reactivity. Additionally, usage in joining various ferrous and non-ferrous metals is another major reason for the dominating segment in the market. Whereas the electronics sector witnessed the fastest growth rate in the market. Owing to the increasing demand for smartphones, TV, and Solar panels in the market.
| Attribute | Description |
|---|---|
| Market Size | Revenue (USD Billion) |
| Market size value in 2023 | USD 11 Billion |
| Market size value in 2033 | USD 22.46 Billion |
| CAGR (2024 to 2033) | 7.40% |
| Historical data | 2020-2022 |
| Base Year | 2023 |
| Forecast | 2024-2033 |
| Region | The regions analyzed for the market are Asia Pacific, Europe, South America, North America, and Middle East & Africa. Furthermore, the regions are further analyzed at the country level. |
| Segments | Form, End-User Industry |
As per The Brainy Insights, the size of the argon gas market was valued at USD 11 billion in 2023 to USD 22.46 billion by 2033.
The global argon gas market is growing at a CAGR of 7.4% during the forecast period 2024-2033.
The Asia Pacific region emerged as the largest market for the argon gas.
The increased demand for argon gas from the electronics industry will influence the market's growth.
1. Introduction
1.1. Objectives of the Study
1.2. Market Definition
1.3. Research Scope
1.4. Currency
1.5. Key Target Audience
2. Research Methodology and Assumptions
3. Executive Summary
4. Premium Insights
4.1. Porter’s Five Forces Analysis
4.2. Value Chain Analysis
4.3. Top Investment Pockets
4.3.1. Market Attractiveness Analysis by Form
4.3.2. Market Attractiveness Analysis by End-User Industry
4.3.3. Market Attractiveness Analysis by Region
4.4. Industry Trends
5. Market Dynamics
5.1. Market Evaluation
5.2. Drivers
5.2.1. Increased demand for Argon Gas from the Electronics industry
5.2.2. Increasing demand for Scuba-diving and dry-suits
5.3. Restraints
5.3.1. Rising prices of Argon Gas
5.4. Opportunities
5.4.1. Increasing adoption of IOT (Internet of Things) to link machines with smart devices
5.5. Challenges
5.5.1. Excessive inhalation of the product leads to dizziness, fatigue and nausea
6. Global Argon Gas Market Analysis and Forecast, By Form
6.1. Segment Overview
6.2. Gas
6.3. Liquid
7. Global Argon Gas Market Analysis and Forecast, By End-User Industry
7.1. Segment Overview
7.2. Healthcare
7.3. Food & Beverages
7.4. Electronics
7.5. Manufacturing
7.6. Others
8. Global Argon Gas Market Analysis and Forecast, By Regional Analysis
8.1. Segment Overview
8.2. North America
8.2.1. U.S.
8.2.2. Canada
8.2.3. Mexico
8.3. Europe
8.3.1. Germany
8.3.2. France
8.3.3. U.K.
8.3.4. Italy
8.3.5. Spain
8.4. Asia-Pacific
8.4.1. Japan
8.4.2. China
8.4.3. India
8.5. South America
8.5.1. Brazil
8.6. Middle East and Africa
8.6.1. UAE
8.6.2. South Africa
9. Global Argon Gas Market-Competitive Landscape
9.1. Overview
9.2. Market Share of Key Players in Global Argon Gas Market
9.2.1. Global Company Market Share
9.2.2. North America Company Market Share
9.2.3. Europe Company Market Share
9.2.4. APAC Company Market Share
9.3. Competitive Situations and Trends
9.3.1. Product Launches and Developments
9.3.2. Partnerships, Collaborations, and Agreements
9.3.3. Mergers & Acquisitions
9.3.4. Expansions
10. Company Profiles
10.1. Air Liquide S.A.
10.1.1. Business Overview
10.1.2. Company Snapshot
10.1.3. Company Market Share Analysis
10.1.4. Company Product Portfolio
10.1.5. Recent Developments
10.1.6. SWOT Analysis
10.2. Air Products and Chemicals Inc
10.2.1. Business Overview
10.2.2. Company Snapshot
10.2.3. Company Market Share Analysis
10.2.4. Company Product Portfolio
10.2.5. Recent Developments
10.2.6. SWOT Analysis
10.3. Iwatani Corporation
10.3.1. Business Overview
10.3.2. Company Snapshot
10.3.3. Company Market Share Analysis
10.3.4. Company Product Portfolio
10.3.5. Recent Developments
10.3.6. SWOT Analysis
10.4. Praxair Inc
10.4.1. Business Overview
10.4.2. Company Snapshot
10.4.3. Company Market Share Analysis
10.4.4. Company Product Portfolio
10.4.5. Recent Developments
10.4.6. SWOT Analysis
10.5. The Linde Group
10.5.1. Business Overview
10.5.2. Company Snapshot
10.5.3. Company Market Share Analysis
10.5.4. Company Product Portfolio
10.5.5. Recent Developments
10.5.6. SWOT Analysis
10.6. Advanced Specialty Gases Inc
10.6.1. Business Overview
10.6.2. Company Snapshot
10.6.3. Company Market Share Analysis
10.6.4. Company Product Portfolio
10.6.5. Recent Developments
10.6.6. SWOT Analysis
10.7. Airgas Inc
10.7.1. Business Overview
10.7.2. Company Snapshot
10.7.3. Company Market Share Analysis
10.7.4. Company Product Portfolio
10.7.5. Recent Developments
10.7.6. SWOT Analysis
10.8. Messer Group
10.8.1. Business Overview
10.8.2. Company Snapshot
10.8.3. Company Market Share Analysis
10.8.4. Company Product Portfolio
10.8.5. Recent Developments
10.8.6. SWOT Analysis
10.9. Matheson Tri-Gas Inc
10.9.1. Business Overview
10.9.2. Company Snapshot
10.9.3. Company Market Share Analysis
10.9.4. Company Product Portfolio
10.9.5. Recent Developments
10.9.6. SWOT Analysis
10.10. Iceblick Ltd
10.10.1. Business Overview
10.10.2. Company Snapshot
10.10.3. Company Market Share Analysis
10.10.4. Company Product Portfolio
10.10.5. Recent Developments
10.10.6. SWOT Analysis
List of Table
1. Global Argon Gas Market, By Form, 2020-2033(USD Billion)
2. Global Gas, Argon Gas Market, By Region, 2020-2033(USD Billion)
3. Global Liquid, Argon Gas Market, By Region, 2020-2033(USD Billion)
4. Global Argon Gas Market, By End-User Industry, 2020-2033(USD Billion)
5. Global Healthcare, Argon Gas Market, By Region, 2020-2033(USD Billion)
6. Global Food & Beverages, Argon Gas Market, By Region, 2020-2033(USD Billion)
7. Global Electronics, Argon Gas Market, By Region, 2020-2033(USD Billion)
8. Global Manufacturing, Argon Gas Market, By Region, 2020-2033(USD Billion)
9. Global Others, Argon Gas Market, By Region, 2020-2033(USD Billion)
10. North America Argon Gas Market, By Form, 2020-2033(USD Billion)
11. North America Argon Gas Market, By End-User Industry, 2020-2033(USD Billion)
12. U.S. Argon Gas Market, By Form, 2020-2033(USD Billion)
13. U.S. Argon Gas Market, By End-User Industry, 2020-2033(USD Billion)
14. Canada Argon Gas Market, By Form, 2020-2033(USD Billion)
15. Canada Argon Gas Market, By End-User Industry, 2020-2033(USD Billion)
16. Mexico Argon Gas Market, By Form, 2020-2033(USD Billion)
17. Mexico Argon Gas Market, By End-User Industry, 2020-2033(USD Billion)
18. Europe Argon Gas Market, By Form, 2020-2033(USD Billion)
19. Europe Argon Gas Market, By End-User Industry, 2020-2033(USD Billion)
20. Germany Argon Gas Market, By Form, 2020-2033(USD Billion)
21. Germany Argon Gas Market, By End-User Industry, 2020-2033(USD Billion)
22. France Argon Gas Market, By Form, 2020-2033(USD Billion)
23. France Argon Gas Market, By End-User Industry, 2020-2033(USD Billion)
24. U.K. Argon Gas Market, By Form, 2020-2033(USD Billion)
25. U.K. Argon Gas Market, By End-User Industry, 2020-2033(USD Billion)
26. Italy Argon Gas Market, By Form, 2020-2033(USD Billion)
27. Italy Argon Gas Market, By End-User Industry, 2020-2033(USD Billion)
28. Spain Argon Gas Market, By Form, 2020-2033(USD Billion)
29. Spain Argon Gas Market, By End-User Industry, 2020-2033(USD Billion)
30. Asia Pacific Argon Gas Market, By Form, 2020-2033(USD Billion)
31. Asia Pacific Argon Gas Market, By End-User Industry, 2020-2033(USD Billion)
32. Japan Argon Gas Market, By Form, 2020-2033(USD Billion)
33. Japan Argon Gas Market, By End-User Industry, 2020-2033(USD Billion)
34. China Argon Gas Market, By Form, 2020-2033(USD Billion)
35. China Argon Gas Market, By End-User Industry, 2020-2033(USD Billion)
36. India Argon Gas Market, By Form, 2020-2033(USD Billion)
37. India Argon Gas Market, By End-User Industry, 2020-2033(USD Billion)
38. South America Argon Gas Market, By Form, 2020-2033(USD Billion)
39. South America Argon Gas Market, By End-User Industry, 2020-2033(USD Billion)
40. Brazil Argon Gas Market, By Form, 2020-2033(USD Billion)
41. Brazil Argon Gas Market, By End-User Industry, 2020-2033(USD Billion)
42. Middle East and Africa Argon Gas Market, By Form, 2020-2033(USD Billion)
43. Middle East and Africa Argon Gas Market, By End-User Industry, 2020-2033(USD Billion)
44. UAE Argon Gas Market, By Form, 2020-2033(USD Billion)
45. UAE Argon Gas Market, By End-User Industry, 2020-2033(USD Billion)
46. South Africa Argon Gas Market, By Form, 2020-2033(USD Billion)
47. South Africa Argon Gas Market, By End-User Industry, 2020-2033(USD Billion)
List of Figures
1. Global Argon Gas Market Segmentation
2. Global Argon Gas Market: Research Methodology
3. Market Size Estimation Methodology: Bottom-Up Approach
4. Market Size Estimation Methodology: Top-Down Approach
5. Data Triangulation
6. Porter’s Five Forces Analysis
7. Value Chain Analysis
8. Global Argon Gas Market Attractiveness Analysis by Form
9. Global Argon Gas Market Attractiveness Analysis by End-User Industry
10. Global Argon Gas Market Attractiveness Analysis by Region
11. Global Argon Gas Market: Dynamics
12. Global Argon Gas Market Share by Form (2024 & 2033)
13. Global Argon Gas Market Share by End-User Industry (2024 & 2033)
14. Global Argon Gas Market Share by Regions (2024 & 2033)
15. Global Argon Gas Market Share by Company (2023)
This study forecasts revenue at global, regional, and country levels from 2020 to 2033. The Brainy Insights has segmented the global argon gas market based on below-mentioned segments:
Global Argon Gas Market by Form:
Global Argon Gas Market by End-User Industry:
Global Argon Gas Market by Region:
Research has its special purpose to undertake marketing efficiently. In this competitive scenario, businesses need information across all industry verticals; the information about customer wants, market demand, competition, industry trends, distribution channels etc. This information needs to be updated regularly because businesses operate in a dynamic environment. Our organization, The Brainy Insights incorporates scientific and systematic research procedures in order to get proper market insights and industry analysis for overall business success. The analysis consists of studying the market from a miniscule level wherein we implement statistical tools which helps us in examining the data with accuracy and precision.
Our research reports feature both; quantitative and qualitative aspects for any market. Qualitative information for any market research process are fundamental because they reveal the customer needs and wants, usage and consumption for any product/service related to a specific industry. This in turn aids the marketers/investors in knowing certain perceptions of the customers. Qualitative research can enlighten about the different product concepts and designs along with unique service offering that in turn, helps define marketing problems and generate opportunities. On the other hand, quantitative research engages with the data collection process through interviews, e-mail interactions, surveys and pilot studies. Quantitative aspects for the market research are useful to validate the hypotheses generated during qualitative research method, explore empirical patterns in the data with the help of statistical tools, and finally make the market estimations.
The Brainy Insights offers comprehensive research and analysis, based on a wide assortment of factual insights gained through interviews with CXOs and global experts and secondary data from reliable sources. Our analysts and industry specialist assume vital roles in building up statistical tools and analysis models, which are used to analyse the data and arrive at accurate insights with exceedingly informative research discoveries. The data provided by our organization have proven precious to a diverse range of companies, facilitating them to address issues such as determining which products/services are the most appealing, whether or not customers use the product in the manner anticipated, the purchasing intentions of the market and many others.
Our research methodology encompasses an idyllic combination of primary and secondary initiatives. Key phases involved in this process are listed below:

The phase involves the gathering and collecting of market data and its related information with the help of different sources & research procedures.

The data procurement stage involves in data gathering and collecting through various data sources.
This stage involves in extensive research. These data sources includes:
Purchased Database: Purchased databases play a crucial role in estimating the market sizes irrespective of the domain. Our purchased database includes:
Primary Research: The Brainy Insights interacts with leading companies and experts of the concerned domain to develop the analyst team’s market understanding and expertise. It improves and substantiates every single data presented in the market reports. Primary research mainly involves in telephonic interviews, E-mail interactions and face-to-face interviews with the raw material providers, manufacturers/producers, distributors, & independent consultants. The interviews that we conduct provides valuable data on market size and industry growth trends prevailing in the market. Our organization also conducts surveys with the various industry experts in order to gain overall insights of the industry/market. For instance, in healthcare industry we conduct surveys with the pharmacists, doctors, surgeons and nurses in order to gain insights and key information of a medical product/device/equipment which the customers are going to usage. Surveys are conducted in the form of questionnaire designed by our own analyst team. Surveys plays an important role in primary research because surveys helps us to identify the key target audiences of the market. Additionally, surveys helps to identify the key target audience engaged with the market. Our survey team conducts the survey by targeting the key audience, thus gaining insights from them. Based on the perspectives of the customers, this information is utilized to formulate market strategies. Moreover, market surveys helps us to understand the current competitive situation of the industry. To be precise, our survey process typically involve with the 360 analysis of the market. This analytical process begins by identifying the prospective customers for a product or service related to the market/industry to obtain data on how a product/service could fit into customers’ lives.

Secondary Research: The secondary data sources includes information published by the on-profit organizations such as World bank, WHO, company fillings, investor presentations, annual reports, national government documents, statistical databases, blogs, articles, white papers and others. From the annual report, we analyse a company’s revenue to understand the key segment and market share of that organization in a particular region. We analyse the company websites and adopt the product mapping technique which is important for deriving the segment revenue. In the product mapping method, we select and categorize the products offered by the companies catering to domain specific market, deduce the product revenue for each of the companies so as to get overall estimation of the market size. We also source data and analyses trends based on information received from supply side and demand side intermediaries in the value chain. The supply side denotes the data gathered from supplier, distributor, wholesaler and the demand side illustrates the data gathered from the end customers for respective market domain.

The supply side for a domain specific market is analysed by:
The demand side for the market is estimated through:
In-house Library: Apart from these third-party sources, we have our in-house library of qualitative and quantitative information. Our in-house database includes market data for various industry and domains. These data are updated on regular basis as per the changing market scenario. Our library includes, historic databases, internal audit reports and archives.
Sometimes there are instances where there is no metadata or raw data available for any domain specific market. For those cases, we use our expertise to forecast and estimate the market size in order to generate comprehensive data sets. Our analyst team adopt a robust research technique in order to produce the estimates:
Data Synthesis: This stage involves the analysis & mapping of all the information obtained from the previous step. It also involves in scrutinizing the data for any discrepancy observed while data gathering related to the market. The data is collected with consideration to the heterogeneity of sources. Robust scientific techniques are in place for synthesizing disparate data sets and provide the essential contextual information that can orient market strategies. The Brainy Insights has extensive experience in data synthesis where the data passes through various stages:


Market Deduction & Formulation: The final stage comprises of assigning data points at appropriate market spaces so as to deduce feasible conclusions. Analyst perspective & subject matter expert based holistic form of market sizing coupled with industry analysis also plays a crucial role in this stage.
This stage involves in finalization of the market size and numbers that we have collected from data integration step. With data interpolation, it is made sure that there is no gap in the market data. Successful trend analysis is done by our analysts using extrapolation techniques, which provide the best possible forecasts for the market.
Data Validation & Market Feedback: Validation is the most important step in the process. Validation & re-validation via an intricately designed process helps us finalize data-points to be used for final calculations.

The Brainy Insights interacts with leading companies and experts of the concerned domain to develop the analyst team’s market understanding and expertise. It improves and substantiates every single data presented in the market reports. The data validation interview and discussion panels are typically composed of the most experienced industry members. The participants include, however, are not limited to:
Moreover, we always validate our data and findings through primary respondents from all the major regions we are working on.


Free Customization
Fortune 500 Clients
Free Yearly Update On Purchase Of Multi/Corporate License
Companies Served Till Date