- +1-315-215-1633
- sales@thebrainyinsights.com

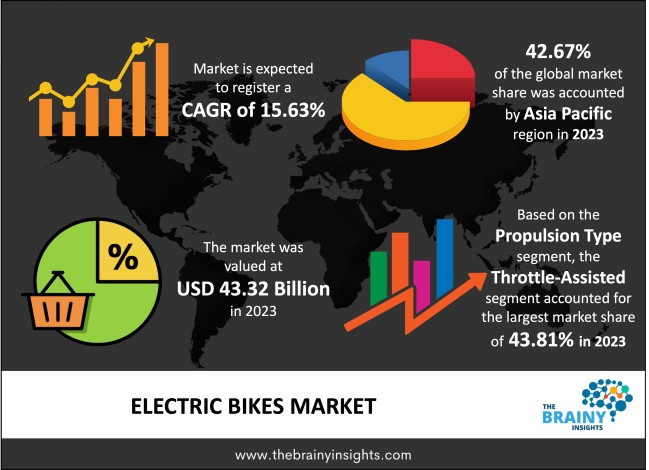
The global electric bikes market was valued at USD 43.32 billion in 2023 and grew at a CAGR of 15.63% from 2024 to 2033. The market is expected to reach USD 185.09 billion by 2033. The increasing fossil fuel prices will drive the growth of the global electric bike market. Electric bikes can play a crucial role in decreasing congestion in cities. Urban areas have become more congested, and hence, electric bikes can be a flexible, agile, and fast transportation solution.
An electric bike is a motorized bicycle with an electric propulsion motor. They can also be referred to as E-bikes. Different classification types are based on the propulsion power, style, range, etc. However, electric bikes can be broadly classified into the following categories. The first category consists of bikes where the pedal does not have a motor assist. The other category Offers a throttle-powered mode that doesn't require pedalling. Electric bikes allow one to travel further and more quickly than a regular bike. They are also better designed with a battery, making it simpler to handle slopes, drive farther without fatigue, and even tow small weights. One of the most significant benefits of electric bikes is that they benefit the environment as they produce no carbon emissions and improve air quality. Electric bikes also have another environmental benefit as they produce less noise. Their lightweight nature also drives their demand. They are fast, flexible and cost-effective. They are easy to operate and are found in various designs, offering many options for consumers according to their needs and requirements.
Get an overview of this study by requesting a free sample
The increasing energy prices – The market for electric bikes is on the path of exponential growth, considering the alarming rate of rise in fossil fuel prices given the reduced fossil fuel reserves and geopolitical tensions. Furthermore, the rising awareness about climate change and its consequences has encouraged consumers towards more eco-friendly products such as e-bikes. Positive government rules, regulations and initiatives in the form of subsidies and incentives for the production and consumption of electric bikes are meeting this push. Additionally, Electric bikes are reliable, lightweight, and trendy. The preference of today's consumers for leisure and fitness activities also makes E-bikes the product driving the market's expansion. These elements appear to be having a favourable effect on the sales of e-bikes, which are increasing significantly and are anticipated to maintain the pace in the upcoming years.
The high costs of raw materials – the raw materials used in the production of batteries are mined, transported and processed for the end product to be ready for installation in E-bikes. The raw materials are costly, increasing electric bike retail costs. Conventional bikes are still comparatively cheaper than e-bikes. Additionally, the electric bike technology and overall market are nascent, which hasn't allowed it to reach the economies of scale yet. All of which increased the prices. Therefore, the high raw material costs will hamper the market's growth.
The favourable government initiatives – The growing demand for environmentally friendly electric bikes has been highlighted by the growing climate change crisis brought on by carbon emissions, a large portion of which are produced by moving automobiles. The rising cost of energy is a financial burden on both people and governments due to the decreasing fossil fuel resources and unstable market dynamics. Furthermore, for nations that rely on fuel imports, the dependability on fossil fuels compromises national security interests. As a result, finding alternative fuels has become crucial for governments in order to minimise carbon footprints, protect national security, and lessen inflationary pressures brought on by rising energy prices. The market for electric bikes will be driven by government assistance through subsidies and production incentive-linked programmes.
The regions analyzed for the market include North America, Europe, South America, Asia Pacific, the Middle East, and Africa. Asia Pacific emerged as the largest global electric bike market, with a 42.67% market revenue share in 2023.
The two countries with the greatest populations, China and India, are major contributors to the increase in global temperatures and must fight for long-lasting reforms to lessen the harmful effects. To promote the use of electric bikes and decrease the use of conventional vehicles that release carbon dioxide, one of these approaches is providing subsidies and production incentive-linked schemes. Since today's consumers are goal-oriented and conscious of their decisions and how they affect their environment, e-bikes are a good alternative to their present form of transportation. These elements appear to be having a favourable effect on the sales of e-bikes, which are expected to continue expanding in the years to come.
Asia Pacific Region Electric Bikes Market Share in 2023 – 42.67%
www.thebrainyinsights.com
Check the geographical analysis of this market by requesting a free sample
The propulsion type segment is divided into pedal-assisted, speed pedelec, and throttle assisted. The throttle-assisted segment dominated the market, with a market share of around 43.81% in 2023. The throttle gives the motor direct power without the need for pedalling. The throttle is often found on the grip or handlebar. It allows the user to jump up to a certain speed without having to pedal up to that speed with manual work. There is no stress on the knees and thighs, given that throttle-assisted bikes need no pedalling. The throttle-assisted bikes are ideal for seniors and anyone with medical impairments.
The battery type segment is divided into lead-acid, lithium-ion and others. The lithium-ion segment dominated the market, with a market share of around 64.88% in 2023. The lithium-ion battery is the most widely utilized. These batteries are made of protective circuit boards, which improves their safety. Furthermore, they can be mass-produced in the right sizes for the electric bike market. They are Lightweight, have a longer life, and therefore have more usability. They are Temperature Tolerant, and they provide Fast & Safe Charging.
The power segment is divided into less than or equal to 250W and more than 250W. The more than 250W segment dominated the market, with a market share of around 58.76% in 2023. These bikes are affordable and are available in a wide variety of choices from different brands. They are lightweight. They also offer a wide range of applications, given that they can be used on regular roads, hills, and inclines for adventure sports.
The application segment is divided into cities, mountains and cargo. The city segment dominated the market, with a market share of around 52.42% in 2023. Electric bikes in cities can be used for various purposes, including commute, recreational activities and exercise. They enhance the health of both the users and the environment in congested and polluted cities. They are effective in reducing traffic and air pollution. They are cost-effective both at a personal and community level. They don't need conventional fuels, which reduces the burden on consumers' pockets. Furthermore, several market players are investing in city mobility solutions wherein they rent e-bikes for short commutes through internet applications with minuscule fees.
| Attribute | Description |
|---|---|
| Market Size | Revenue (USD Billion) |
| Market size value in 2023 | USD 43.32 Billion |
| Market size value in 2033 | USD 185.09 Billion |
| CAGR (2024 to 2033) | 15.63% |
| Historical data | 2020-2022 |
| Base Year | 2023 |
| Forecast | 2024-2033 |
| Region | The regions analyzed for the market are Asia Pacific, Europe, South America, North America, and Middle East & Africa. Furthermore, the regions are further analyzed at the country level. |
| Segments | Propulsion Type, Battery Type, Power and Application |
As per The Brainy Insights, the size of the global electric bikes market was valued at USD 43.32 billion in 2023 to USD 185.09 billion by 2033.
Global electric bikes market is growing at a CAGR of 15.63% during the forecast period 2024-2033.
The market's growth will be influenced by the increasing energy prices.
The high costs of raw materials could hamper the market growth.
1. Introduction
1.1. Objectives of the Study
1.2. Market Definition
1.3. Research Scope
1.4. Currency
1.5. Key Target Audience
2. Research Methodology and Assumptions
3. Executive Summary
4. Premium Insights
4.1. Porter’s Five Forces Analysis
4.2. Value Chain Analysis
4.3. Top Investment Pockets
4.3.1. Market Attractiveness Analysis by Propulsion Type
4.3.2. Market Attractiveness Analysis by Battery Type
4.3.3. Market Attractiveness Analysis by Power
4.3.4. Market Attractiveness Analysis by Application
4.3.5. Market Attractiveness Analysis by Region
4.4. Industry Trends
5. Market Dynamics
5.1. Market Evaluation
5.2. Drivers
5.2.1. The increasing energy prices
5.3. Restraints
5.3.1. The high costs of raw materials
5.4. Opportunities
5.4.1. The favorable government initiatives
5.5. Challenges
5.5.1. The inadequate infrastructure
6. Global Electric Bikes Market Analysis and Forecast, By Propulsion Type
6.1. Segment Overview
6.2. Pedal Assisted
6.3. Speed Pedelec
6.4. Throttle Assisted
7. Global Electric Bikes Market Analysis and Forecast, By Battery Type
7.1. Segment Overview
7.2. Lead Acid
7.3. Lithium-Ion
7.4. Others
8. Global Electric Bikes Market Analysis and Forecast, By Power
8.1. Segment Overview
8.2. Less Than or Equal to 250W
8.3. More Than 250W
9. Global Electric Bikes Market Analysis and Forecast, By Application
9.1. Segment Overview
9.2. Cities
9.3. Mountains
9.4. Others
10. Global Electric Bikes Market Analysis and Forecast, By Regional Analysis
10.1. Segment Overview
10.2. North America
10.2.1. U.S.
10.2.2. Canada
10.2.3. Mexico
10.3. Europe
10.3.1. Germany
10.3.2. France
10.3.3. U.K.
10.3.4. Italy
10.3.5. Spain
10.4. Asia-Pacific
10.4.1. Japan
10.4.2. China
10.4.3. India
10.5. South America
10.5.1. Brazil
10.6. Middle East and Africa
10.6.1. UAE
10.6.2. South Africa
11. Global Electric Bikes Market-Competitive Landscape
11.1. Overview
11.2. Market Share of Key Players in the Electric Bikes Market
11.2.1. Global Company Market Share
11.2.2. North America Company Market Share
11.2.3. Europe Company Market Share
11.2.4. APAC Company Market Share
11.3. Competitive Situations and Trends
11.3.1. Product Launches and Developments
11.3.2. Partnerships, Collaborations, and Agreements
11.3.3. Mergers & Acquisitions
11.3.4. Expansions
12. Company Profiles
12.1. Jiangsu Xinri E-Vehicle Co., Ltd.
12.1.1. Business Overview
12.1.2. Company Snapshot
12.1.3. Company Market Share Analysis
12.1.4. Company Product Portfolio
12.1.5. Recent Developments
12.1.6. SWOT Analysis
12.2. Giant Manufacturing Co., Ltd.
12.2.1. Business Overview
12.2.2. Company Snapshot
12.2.3. Company Market Share Analysis
12.2.4. Company Product Portfolio
12.2.5. Recent Developments
12.2.6. SWOT Analysis
12.3. Fuji-ta Bicycle Co., Ltd.
12.3.1. Business Overview
12.3.2. Company Snapshot
12.3.3. Company Market Share Analysis
12.3.4. Company Product Portfolio
12.3.5. Recent Developments
12.3.6. SWOT Analysis
12.4. Derby Cycle
12.4.1. Business Overview
12.4.2. Company Snapshot
12.4.3. Company Market Share Analysis
12.4.4. Company Product Portfolio
12.4.5. Recent Developments
12.4.6. SWOT Analysis
12.5. Accell Group
12.5.1. Business Overview
12.5.2. Company Snapshot
12.5.3. Company Market Share Analysis
12.5.4. Company Product Portfolio
12.5.5. Recent Developments
12.5.6. SWOT Analysis
12.6. Mahindra & Mahindra Ltd.
12.6.1. Business Overview
12.6.2. Company Snapshot
12.6.3. Company Market Share Analysis
12.6.4. Company Product Portfolio
12.6.5. Recent Developments
12.6.6. SWOT Analysis
12.7. Prodecotech, LLC
12.7.1. Business Overview
12.7.2. Company Snapshot
12.7.3. Company Market Share Analysis
12.7.4. Company Product Portfolio
12.7.5. Recent Developments
12.7.6. SWOT Analysis
12.8. Tianjin Golden Wheel Group Co., Ltd.
12.8.1. Business Overview
12.8.2. Company Snapshot
12.8.3. Company Market Share Analysis
12.8.4. Company Product Portfolio
12.8.5. Recent Developments
12.8.6. SWOT Analysis
12.9. Trek Bicycle Corporation
12.9.1. Business Overview
12.9.2. Company Snapshot
12.9.3. Company Market Share Analysis
12.9.4. Company Product Portfolio
12.9.5. Recent Developments
12.9.6. SWOT Analysis
12.10. Yamaha Motor Co. Ltd.
12.10.1. Business Overview
12.10.2. Company Snapshot
12.10.3. Company Market Share Analysis
12.10.4. Company Product Portfolio
12.10.5. Recent Developments
12.10.6. SWOT Analysis
List of Table
1. Global Electric Bikes Market, By Propulsion Type, 2020-2033 (USD Billion)
2. Global Pedal Assisted Electric Bikes Market, By Region, 2020-2033 (USD Billion)
3. Global Speed Pedelec Electric Bikes Market, By Region, 2020-2033 (USD Billion)
4. Global Throttle Assisted Electric Bikes Market, By Region, 2020-2033 (USD Billion)
5. Global Electric Bikes Market, By Battery Type, 2020-2033 (USD Billion)
6. Global Lead Acid Electric Bikes Market, By Region, 2020-2033 (USD Billion)
7. Global Lithium-Ion Electric Bikes Market, By Region, 2020-2033 (USD Billion)
8. Global Others Electric Bikes Market, By Region, 2020-2033 (USD Billion)
9. Global Electric Bikes Market, By Power, 2020-2033 (USD Billion)
10. Global Less Than or Equal to 250W Electric Bikes Market, By Region, 2020-2033 (USD Billion)
11. Global More Than 250W Electric Bikes Market, By Region, 2020-2033 (USD Billion)
12. Global Electric Bikes Market, By Application, 2020-2033 (USD Billion)
13. Global Cities Electric Bikes Market, By Region, 2020-2033 (USD Billion)
14. Global Mountains Electric Bikes Market, By Region, 2020-2033 (USD Billion)
15. Global Cargo Electric Bikes Market, By Region, 2020-2033 (USD Billion)
16. Global Electric Bikes Market, By Region, 2020-2033 (USD Billion)
17. North America Electric Bikes Market, By Propulsion Type, 2020-2033 (USD Billion)
18. North America Electric Bikes Market, By Battery Type, 2020-2033 (USD Billion)
19. North America Electric Bikes Market, By Power, 2020-2033 (USD Billion)
20. North America Electric Bikes Market, By Application, 2020-2033 (USD Billion)
21. U.S. Electric Bikes Market, By Propulsion Type, 2020-2033 (USD Billion)
22. U.S. Electric Bikes Market, By Battery Type, 2020-2033 (USD Billion)
23. U.S. Electric Bikes Market, By Power, 2020-2033 (USD Billion)
24. U.S. Electric Bikes Market, By Application, 2020-2033 (USD Billion)
25. Canada Electric Bikes Market, By Propulsion Type, 2020-2033 (USD Billion)
26. Canada Electric Bikes Market, By Battery Type, 2020-2033 (USD Billion)
27. Canada Electric Bikes Market, By Power, 2020-2033 (USD Billion)
28. Canada Electric Bikes Market, By Application, 2020-2033 (USD Billion)
29. Mexico Electric Bikes Market, By Propulsion Type, 2020-2033 (USD Billion)
30. Mexico Electric Bikes Market, By Battery Type, 2020-2033 (USD Billion)
31. Mexico Electric Bikes Market, By Power, 2020-2033 (USD Billion)
32. Mexico Electric Bikes Market, By Application, 2020-2033 (USD Billion)
33. Europe Electric Bikes Market, By Propulsion Type, 2020-2033 (USD Billion)
34. Europe Electric Bikes Market, By Battery Type, 2020-2033 (USD Billion)
35. Europe Electric Bikes Market, By Power, 2020-2033 (USD Billion)
36. Europe Electric Bikes Market, By Application, 2020-2033 (USD Billion)
37. Germany Electric Bikes Market, By Propulsion Type, 2020-2033 (USD Billion)
38. Germany Electric Bikes Market, By Battery Type, 2020-2033 (USD Billion)
39. Germany Electric Bikes Market, By Power, 2020-2033 (USD Billion)
40. Germany Electric Bikes Market, By Application, 2020-2033 (USD Billion)
41. France Electric Bikes Market, By Propulsion Type, 2020-2033 (USD Billion)
42. France Electric Bikes Market, By Battery Type, 2020-2033 (USD Billion)
43. France Electric Bikes Market, By Power, 2020-2033 (USD Billion)
44. France Electric Bikes Market, By Application, 2020-2033 (USD Billion)
45. U.K. Electric Bikes Market, By Propulsion Type, 2020-2033 (USD Billion)
46. U.K. Electric Bikes Market, By Battery Type, 2020-2033 (USD Billion)
47. U.K. Electric Bikes Market, By Power, 2020-2033 (USD Billion)
48. U.K. Electric Bikes Market, By Application, 2020-2033 (USD Billion)
49. Italy Electric Bikes Market, By Propulsion Type, 2020-2033 (USD Billion)
50. Italy Electric Bikes Market, By Battery Type, 2020-2033 (USD Billion)
51. Italy Electric Bikes Market, By Power, 2020-2033 (USD Billion)
52. Italy Electric Bikes Market, By Application, 2020-2033 (USD Billion)
53. Spain Electric Bikes Market, By Propulsion Type, 2020-2033 (USD Billion)
54. Spain Electric Bikes Market, By Battery Type, 2020-2033 (USD Billion)
55. Spain Electric Bikes Market, By Power, 2020-2033 (USD Billion)
56. Spain Electric Bikes Market, By Application, 2020-2033 (USD Billion)
57. Asia Pacific Electric Bikes Market, By Propulsion Type, 2020-2033 (USD Billion)
58. Asia Pacific Electric Bikes Market, By Battery Type, 2020-2033 (USD Billion)
59. Asia Pacific Electric Bikes Market, By Power, 2020-2033 (USD Billion)
60. Asia Pacific Electric Bikes Market, By Application, 2020-2033 (USD Billion)
61. Japan Electric Bikes Market, By Propulsion Type, 2020-2033 (USD Billion)
62. Japan Electric Bikes Market, By Battery Type, 2020-2033 (USD Billion)
63. Japan Electric Bikes Market, By Power, 2020-2033 (USD Billion)
64. Japan Electric Bikes Market, By Application, 2020-2033 (USD Billion)
65. China Electric Bikes Market, By Propulsion Type, 2020-2033 (USD Billion)
66. China Electric Bikes Market, By Battery Type, 2020-2033 (USD Billion)
67. China Electric Bikes Market, By Power, 2020-2033 (USD Billion)
68. China Electric Bikes Market, By Application, 2020-2033 (USD Billion)
69. India Electric Bikes Market, By Propulsion Type, 2020-2033 (USD Billion)
70. India Electric Bikes Market, By Battery Type, 2020-2033 (USD Billion)
71. India Electric Bikes Market, By Power, 2020-2033 (USD Billion)
72. India Electric Bikes Market, By Application, 2020-2033 (USD Billion)
73. South America Electric Bikes Market, By Propulsion Type, 2020-2033 (USD Billion)
74. South America Electric Bikes Market, By Battery Type, 2020-2033 (USD Billion)
75. South America Electric Bikes Market, By Power, 2020-2033 (USD Billion)
76. South America Electric Bikes Market, By Application, 2020-2033 (USD Billion)
77. Brazil Electric Bikes Market, By Propulsion Type, 2020-2033 (USD Billion)
78. Brazil Electric Bikes Market, By Battery Type, 2020-2033 (USD Billion)
79. Brazil Electric Bikes Market, By Power, 2020-2033 (USD Billion)
80. Brazil Electric Bikes Market, By Application, 2020-2033 (USD Billion)
81. Middle East and Africa Electric Bikes Market, By Propulsion Type, 2020-2033 (USD Billion)
82. Middle East and Africa Electric Bikes Market, By Battery Type, 2020-2033 (USD Billion)
83. Middle East and Africa Electric Bikes Market, By Power, 2020-2033 (USD Billion)
84. Middle East and Africa Electric Bikes Market, By Application, 2020-2033 (USD Billion)
85. UAE Electric Bikes Market, By Propulsion Type, 2020-2033 (USD Billion)
86. UAE Electric Bikes Market, By Battery Type, 2020-2033 (USD Billion)
87. UAE Electric Bikes Market, By Power, 2020-2033 (USD Billion)
88. UAE Electric Bikes Market, By Application, 2020-2033 (USD Billion)
89. South Africa Electric Bikes Market, By Propulsion Type, 2020-2033 (USD Billion)
90. South Africa Electric Bikes Market, By Battery Type, 2020-2033 (USD Billion)
91. South Africa Electric Bikes Market, By Power, 2020-2033 (USD Billion)
92. South Africa Electric Bikes Market, By Application, 2020-2033 (USD Billion)
List of Figures
1. Global Electric Bikes Market Segmentation
2. Electric Bikes Market: Research Methodology
3. Market Size Estimation Methodology: Bottom-Up Approach
4. Market Size Estimation Methodology: Top-Down Approach
5. Data Triangulation
6. Porter’s Five Forces Analysis
7. Value Chain Analysis
8. Global Electric Bikes Market Attractiveness Analysis by Propulsion Type
9. Global Electric Bikes Market Attractiveness Analysis by Battery Type
10. Global Electric Bikes Market Attractiveness Analysis by Power
11. Global Electric Bikes Market Attractiveness Analysis by Application
12. Global Electric Bikes Market Attractiveness Analysis by Region
13. Global Electric Bikes Market: Dynamics
14. Global Electric Bikes Market Share by Propulsion Type (2023 & 2033)
15. Global Electric Bikes Market Share by Battery Type (2023 & 2033)
16. Global Electric Bikes Market Share by Power (2023 & 2033)
17. Global Electric Bikes Market Share by Application (2023 & 2033)
18. Global Electric Bikes Market Share by Regions (2023 & 2033)
19. Global Electric Bikes Market Share by Company (2023)
This study forecasts revenue at global, regional, and country levels from 2020 to 2033. The Brainy Insights has segmented the global electric bikes market based on below mentioned segments:
Global Electric Bikes Market by Propulsion Type:
Global Electric Bikes Market by Battery Type:
Global Electric Bikes Market by Power:
Global Electric Bikes Market by Application:
Global Electric Bikes Market by Region:
Research has its special purpose to undertake marketing efficiently. In this competitive scenario, businesses need information across all industry verticals; the information about customer wants, market demand, competition, industry trends, distribution channels etc. This information needs to be updated regularly because businesses operate in a dynamic environment. Our organization, The Brainy Insights incorporates scientific and systematic research procedures in order to get proper market insights and industry analysis for overall business success. The analysis consists of studying the market from a miniscule level wherein we implement statistical tools which helps us in examining the data with accuracy and precision.
Our research reports feature both; quantitative and qualitative aspects for any market. Qualitative information for any market research process are fundamental because they reveal the customer needs and wants, usage and consumption for any product/service related to a specific industry. This in turn aids the marketers/investors in knowing certain perceptions of the customers. Qualitative research can enlighten about the different product concepts and designs along with unique service offering that in turn, helps define marketing problems and generate opportunities. On the other hand, quantitative research engages with the data collection process through interviews, e-mail interactions, surveys and pilot studies. Quantitative aspects for the market research are useful to validate the hypotheses generated during qualitative research method, explore empirical patterns in the data with the help of statistical tools, and finally make the market estimations.
The Brainy Insights offers comprehensive research and analysis, based on a wide assortment of factual insights gained through interviews with CXOs and global experts and secondary data from reliable sources. Our analysts and industry specialist assume vital roles in building up statistical tools and analysis models, which are used to analyse the data and arrive at accurate insights with exceedingly informative research discoveries. The data provided by our organization have proven precious to a diverse range of companies, facilitating them to address issues such as determining which products/services are the most appealing, whether or not customers use the product in the manner anticipated, the purchasing intentions of the market and many others.
Our research methodology encompasses an idyllic combination of primary and secondary initiatives. Key phases involved in this process are listed below:

The phase involves the gathering and collecting of market data and its related information with the help of different sources & research procedures.

The data procurement stage involves in data gathering and collecting through various data sources.
This stage involves in extensive research. These data sources includes:
Purchased Database: Purchased databases play a crucial role in estimating the market sizes irrespective of the domain. Our purchased database includes:
Primary Research: The Brainy Insights interacts with leading companies and experts of the concerned domain to develop the analyst team’s market understanding and expertise. It improves and substantiates every single data presented in the market reports. Primary research mainly involves in telephonic interviews, E-mail interactions and face-to-face interviews with the raw material providers, manufacturers/producers, distributors, & independent consultants. The interviews that we conduct provides valuable data on market size and industry growth trends prevailing in the market. Our organization also conducts surveys with the various industry experts in order to gain overall insights of the industry/market. For instance, in healthcare industry we conduct surveys with the pharmacists, doctors, surgeons and nurses in order to gain insights and key information of a medical product/device/equipment which the customers are going to usage. Surveys are conducted in the form of questionnaire designed by our own analyst team. Surveys plays an important role in primary research because surveys helps us to identify the key target audiences of the market. Additionally, surveys helps to identify the key target audience engaged with the market. Our survey team conducts the survey by targeting the key audience, thus gaining insights from them. Based on the perspectives of the customers, this information is utilized to formulate market strategies. Moreover, market surveys helps us to understand the current competitive situation of the industry. To be precise, our survey process typically involve with the 360 analysis of the market. This analytical process begins by identifying the prospective customers for a product or service related to the market/industry to obtain data on how a product/service could fit into customers’ lives.

Secondary Research: The secondary data sources includes information published by the on-profit organizations such as World bank, WHO, company fillings, investor presentations, annual reports, national government documents, statistical databases, blogs, articles, white papers and others. From the annual report, we analyse a company’s revenue to understand the key segment and market share of that organization in a particular region. We analyse the company websites and adopt the product mapping technique which is important for deriving the segment revenue. In the product mapping method, we select and categorize the products offered by the companies catering to domain specific market, deduce the product revenue for each of the companies so as to get overall estimation of the market size. We also source data and analyses trends based on information received from supply side and demand side intermediaries in the value chain. The supply side denotes the data gathered from supplier, distributor, wholesaler and the demand side illustrates the data gathered from the end customers for respective market domain.

The supply side for a domain specific market is analysed by:
The demand side for the market is estimated through:
In-house Library: Apart from these third-party sources, we have our in-house library of qualitative and quantitative information. Our in-house database includes market data for various industry and domains. These data are updated on regular basis as per the changing market scenario. Our library includes, historic databases, internal audit reports and archives.
Sometimes there are instances where there is no metadata or raw data available for any domain specific market. For those cases, we use our expertise to forecast and estimate the market size in order to generate comprehensive data sets. Our analyst team adopt a robust research technique in order to produce the estimates:
Data Synthesis: This stage involves the analysis & mapping of all the information obtained from the previous step. It also involves in scrutinizing the data for any discrepancy observed while data gathering related to the market. The data is collected with consideration to the heterogeneity of sources. Robust scientific techniques are in place for synthesizing disparate data sets and provide the essential contextual information that can orient market strategies. The Brainy Insights has extensive experience in data synthesis where the data passes through various stages:


Market Deduction & Formulation: The final stage comprises of assigning data points at appropriate market spaces so as to deduce feasible conclusions. Analyst perspective & subject matter expert based holistic form of market sizing coupled with industry analysis also plays a crucial role in this stage.
This stage involves in finalization of the market size and numbers that we have collected from data integration step. With data interpolation, it is made sure that there is no gap in the market data. Successful trend analysis is done by our analysts using extrapolation techniques, which provide the best possible forecasts for the market.
Data Validation & Market Feedback: Validation is the most important step in the process. Validation & re-validation via an intricately designed process helps us finalize data-points to be used for final calculations.

The Brainy Insights interacts with leading companies and experts of the concerned domain to develop the analyst team’s market understanding and expertise. It improves and substantiates every single data presented in the market reports. The data validation interview and discussion panels are typically composed of the most experienced industry members. The participants include, however, are not limited to:
Moreover, we always validate our data and findings through primary respondents from all the major regions we are working on.


Free Customization
Fortune 500 Clients
Free Yearly Update On Purchase Of Multi/Corporate License
Companies Served Till Date