- +1-315-215-1633
- sales@thebrainyinsights.com

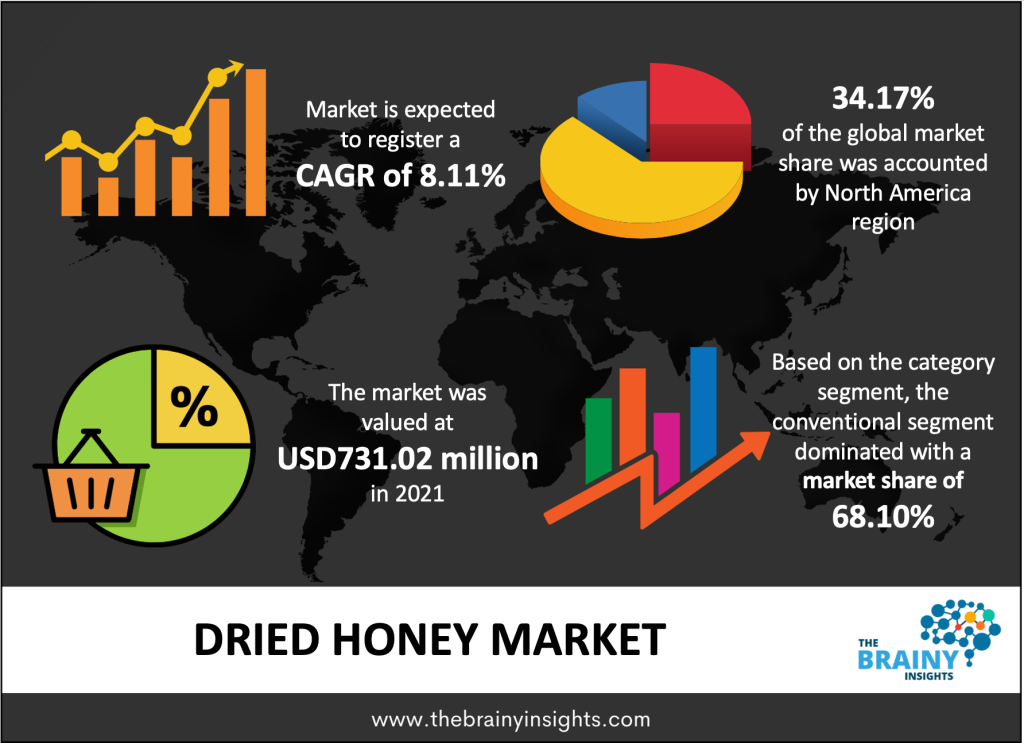
The global dried honey market was valued at USD 731.02 million in 2021 and growing at a CAGR of 8.11% from 2022 to 2030. The market is expected to reach USD 1474.76 million by 2030. The Asia Pacific is expected to grow the fastest during the forecast period
Dried honey is often known as dehydrated honey. It is available in powder and granule form. Dried honey is often called honey powder and is now used as sweeteners and flavorings in most bakery food products. Several ingredients are mixed with dried honey to make it worthwhile for the end products. Dried honey is more accessible to store than liquid honey and has a longer shelf life. It is generally manufactured from liquid honey. During the manufacturing process, moisture from the liquid honey is sucked by the starch it eventually gelatinizes. Dried honey can be used in numerous food products, including cookies, cake, bread, and others. As dried honey contains fewer calories, it is most often preferred by the health-conscious population.
Organic products are in high demand due to rising awareness of a healthy lifestyle. Organic products are rich in macronutrients and contain little to no preservatives. Dried honey is used in many food and beverage applications owing to its versatility. The use of dried honey is increasing in pharmaceutical products such as medicines, ointments, and supplements. Furthermore, the adoption of dried honey has surged in cosmetics formulations like moisturizing creams, shampoo, and conditioners. Dried honey is also effective in many nutraceutical products due to its low-calorie content. The rising awareness of a healthy diet has acted as a crucial factor in the tremendous growth of dried honey over the years. Rising cases of diabetes and increasing sugar levels would drive the dried honey market growth during the forecast period. On the other hand, the increasing number of manufacturers aimed at introducing products with higher shelf life which will bode well for the market. The bakery and confectionary industry is significantly investing in dried honey to maintain the consistency of bakery and confectionery products.
In May 2022, British Honey launched 100% pure honey with dry gin infused. The newly launched dried honey bottle has a KEEPR signature.
Get an overview of this study by requesting a free sample
Increasing use of dried honey as a substitute for conventional honey- The dried honey market is driven by an increase in the number of applications in the food and beverages industry. The demand for natural and organic products is rising, which has increased the market share of dried honey-made products. It is effective in maintaining the glucose level in the body without increasing the calories and thus is increasingly preferred by patients suffering from chronic conditions. It contains lesser calories than conventional honey or sucrose. It is also highly used in baked products as a sweetener. The food and beverages produced using dried honey can be stored for extended periods. The manufacturers use the product to enhance the texture of the product while maintaining the natural flavor of the food. It can be used as a preservative, nutritional supplement, fermenting agent, and taste enhancer in the industry. Technological advancements will likely increase the use of dried honey in pharmaceuticals and cosmetics.
Potential allergies-The consumption of dried honey may cause an allergic reaction in some consumers. Dried honey can be triggered in individuals who are allergic to some pollens. The potential allergies include vomiting, nausea, rashes, etc. Although allergy to dried honey is rare, mixing certain ingredients can lead to such circumstances.
Rising demand for processed food & beverage- The food and beverages sector consists of many segments like food additives, functional food and beverages, health and natural foods, packaged foods, animal food, soft drinks, energy drinks, and many more. The high demand for more nutritious food, a hectic lifestyle, and better packaging is helping the growing food and beverage market. The sector is propelling mainly because of the developed and developing countries as the economies of these countries are improving, and more people are spending on such products. Food manufacturers have been encouraged to boost production and invest extensively in fermentation due to several influential factors that have increased the demand for processed and packaged foods The market growth of dried honey is significantly dependent on the performance of organic food and beverages industry.. As a result, the rising demand for processed and packaged foods is a strong incentive for dried honey manufacturers to increase production capacity.
No uniform regulations and guidelines- Every region have its safety and quality standards governing the food and beverages and pharmaceutical industry, which are implemented and kept in check by applying various methods and guidelines. However, the different policies provided by global and regional agencies to be followed have resulted in increased costs and waste of time.
The regions analyzed for the market include North America, Europe, South America, Asia Pacific, the Middle East, and Africa. North America emerged as the largest market for the global dried honey market, with a 34.17% share of the market revenue in 2021.
North America currently dominates the dried honey market due to rising per capita income and the shifting preference of consumers for the adoption of organic food products. Furthermore, the growing use of dried honey in the pharmaceutical product contributes significantly to the regional market's growth. The increased number of health-conscious people in the region has led to consuming low-calorie ingredients instead of conventional high-calorie products. The well-established food and beverages, pharmaceutical, and skincare industry are one of the region's significant drivers of the dried honey market. Additionally, the North American market is flooded with several organic and branded dried honey forms, unlike the developing and under-developing nations, which have loose and unbranded products in their local markets. The Asia Pacific is expected to grow the fastest during the forecast period, given the increasing population coupled with rising disposable income, which is driving the consumer market in the region. The developing economy market for bakery and confectionery products has encouraged the manufacturers to develop dried honey which can be used to improve the texture of end products.
North America Region Dried Honey Market Share in 2021 - 34.17%
www.thebrainyinsights.com
Check the geographical analysis of this market by requesting a free sample
The category segment is divided into conventional and organic. The conventional segment dominated the market, with a market share of around 68.10% in 2021. Conventional dried honey is free from preservatives and thus is used in most bakery products, including desserts, ice cream, etc. Conventional products have a longer shelf life and have high moisture retention attributes. Conventional dried honey has numerous properties, including desirable aroma and color. It also enables food, beverage, and pharmaceutical products to improve the texture and nutritional properties of the final product.
The form type segment is divided into granular and powder. In 2021, the powder segment dominated the market, accounting for around 65.02% of global revenue. Powder-dried honey is a natural sweetening agent in most food and beverage products. Powdered dried honey can be easily mixed with most food products. It is even easier to carry and use with convenience food products.
The application segment is divided into pharmaceuticals, food and beverages, personal care, and cosmetics. The pharmaceuticals segment further consists of supplements, ointments, and medicines. The food and beverages segment includes confectioneries and bakeries, coffee, tea, juice, frozen desserts, and others. In 2021, the food and beverages segment dominated the market, accounting for around 47.33% of global revenue. Food and beverage products use dried honey to maintain the texture and add sweetness for a better taste. Food industry deals in the processing of food items in large amounts daily. Dried honey offers flavor and color to a variety of food products. Further, it can be a healthier alternative to the conventional sweetening agent. It is a versatile food additive that expedites texture in baked food products.
The sales channel segment is divided into specialty stores, supermarkets and hypermarkets, retail stores, and online. The supermarkets and hypermarkets segment dominated the market, with a market share of around 36.93%. Rapid urbanization has led to several lifestyle changes, one of which is the growing consumption of packaged foods. The increase in disposable income of the population is also contributing to the increasing demand for packaged foods. Supermarkets and hypermarkets offer various dried honey options at the convenience of their customers. Further, customers can get assistance in supermarkets and hypermarkets, and thus they prefer to purchase items from these stores.
| Attribute | Description |
|---|---|
| Market Size | Revenue (USD Million), Volume (MT) |
| Market size value in 2021 | USD 731.02 Million |
| Market size value in 2030 | USD 1474.76 Million |
| CAGR (2022 to 2030) | 8.11% |
| Historical data | 2019-2020 |
| Base Year | 2021 |
| Forecast | 2022-2030 |
| Segments | Category, Form Type, Application, Sales Channel |
| Regional Segments | The regions analyzed for the market are Europe, Asia Pacific, North America, South America, and Middle East & Africa. Furthermore, the regions are further analyzed at the country level. |
As per The Brainy Insights, the size of the dried honey market was valued USD 731.02 million in 2021 & USD 1474.76 million by 2030.
Global dried honey market is growing at a CAGR of 8.11% during the forecast period 2022-2030.
The global dried honey market has been segmented based on category, form type, application, sales channel and regions. The conventional segment led the market in 2021 in the category segment.
North America region emerged as the largest market for the dried honey.
The market's growth will be influenced by the rising awareness for nutrition and healthy lifestyle.
The potential allergies after consumption of dried honey could hamper the market growth.
The increasing preference for organically prepared bakery and confectionery products is providing huge opportunities to the market.
1. Introduction
1.1. Objective of the Study
1.2. Market Definition
1.3. Research Scope
1.4. Currency
1.5. Key Target Audience
2. Research Methodology and Assumptions
3. Executive Summary
4. Premium Insights
4.1. Porter’s Five Forces Analysis
4.2. Value Chain Analysis
4.3. Top Investment Pockets
4.3.1. Market Attractiveness Analysis By Category
4.3.2. Market Attractiveness Analysis By Form Type
4.3.3. Market Attractiveness Analysis By Application
4.3.4. Market Attractiveness Analysis By Sales Channel
4.3.5. Market Attractiveness Analysis By Region
4.4. Industry Trends
5. Market Dynamics
5.1. Market Evaluation
5.2. Drivers
5.2.1. Increasing use of dried honey as a substitute of conventional honey
5.3. Restraints
5.3.1. Potential allergies
5.4. Opportunities
5.4.1. Rising demand for processed food & beverage
5.5. Challenges
5.5.1. Non-uniform regulations across regions
6. Global Dried Honey Market Analysis and Forecast, By Category
6.1. Segment Overview
6.2. Conventional
6.3. Organic
7. Global Dried Honey Market Analysis and Forecast, By Form Type
7.1. Segment Overview
7.2. Granular
7.3. Powder
8. Global Dried Honey Market Analysis and Forecast, By Application
8.1. Segment Overview
8.2. Pharmaceuticals
8.2.1. Supplements
8.2.2. Ointment
8.2.3. Medicines
8.3. Food and Beverages
8.3.1. Confectioneries and Bakery
8.3.2. Coffee
8.3.3. Tea
8.3.4. Juice
8.3.5. Frozen Desserts
8.3.6. Others
8.4. Personal Care and Cosmetics
9. Global Dried Honey Market Analysis and Forecast, By Sales Channel
9.1. Segment Overview
9.2. Specialty Stores
9.3. Supermarkets and Hypermarkets
9.4. Retail Stores
9.5. Online
10. Global Dried Honey Market Analysis and Forecast, By Regional Analysis
10.1. Segment Overview
10.2. North America
10.2.1. U.S.
10.2.2. Canada
10.2.3. Mexico
10.3. Europe
10.3.1. Germany
10.3.2. France
10.3.3. U.K.
10.3.4. Italy
10.3.5. Spain
10.4. Asia-Pacific
10.4.1. Japan
10.4.2. China
10.4.3. India
10.5. South America
10.5.1. Brazil
10.6. Middle East and Africa
10.6.1. UAE
10.6.2. South Africa
11. Global Dried Honey Market-Competitive Landscape
11.1. Overview
11.2. Market Share of Key Players in the Dried Honey Market
11.2.1. Global Company Market Share
11.2.2. North America Company Market Share
11.2.3. Europe Company Market Share
11.2.4. APAC Company Market Share
11.3. Competitive Situations and Trends
11.3.1. Product Launches and Developments
11.3.2. Partnerships, Collaborations, and Agreements
11.3.3. Mergers & Acquisitions
11.3.4. Expansions
12. Company Profiles
12.1. Specialty Products and Technology Inc.
12.1.1. Business Overview
12.1.2. Company Snapshot
12.1.3. Company Market Share Analysis
12.1.4. Company Product Portfolio
12.1.5. Recent Developments
12.1.6. SWOT Analysis
12.2. British Honey
12.2.1. Business Overview
12.2.2. Company Snapshot
12.2.3. Company Market Share Analysis
12.2.4. Company Product Portfolio
12.2.5. Recent Developments
12.2.6. SWOT Analysis
12.3. Best Ground International
12.3.1. Business Overview
12.3.2. Company Snapshot
12.3.3. Company Market Share Analysis
12.3.4. Company Product Portfolio
12.3.5. Recent Developments
12.3.6. SWOT Analysis
12.4. The Archer Daniels Midland Company
12.4.1. Business Overview
12.4.2. Company Snapshot
12.4.3. Company Market Share Analysis
12.4.4. Company Product Portfolio
12.4.5. Recent Developments
12.4.6. SWOT Analysis
12.5. Bio Botanica, Inc.
12.5.1. Business Overview
12.5.2. Company Snapshot
12.5.3. Company Market Share Analysis
12.5.4. Company Product Portfolio
12.5.5. Recent Developments
12.5.6. SWOT Analysis
12.6. Domino Specialty Ingredients (ASR Group)
12.6.1. Business Overview
12.6.2. Company Snapshot
12.6.3. Company Market Share Analysis
12.6.4. Company Product Portfolio
12.6.5. Recent Developments
12.6.6. SWOT Analysis
12.7. Spice Jungle, LLC
12.7.1. Business Overview
12.7.2. Company Snapshot
12.7.3. Company Market Share Analysis
12.7.4. Company Product Portfolio
12.7.5. Recent Developments
12.7.6. SWOT Analysis
12.8. Haldin Pacific Semesta
12.8.1. Business Overview
12.8.2. Company Snapshot
12.8.3. Company Market Share Analysis
12.8.4. Company Product Portfolio
12.8.5. Recent Developments
12.8.6. SWOT Analysis
12.9. Ohly (ABF Ingredients)
12.9.1. Business Overview
12.9.2. Company Snapshot
12.9.3. Company Market Share Analysis
12.9.4. Company Product Portfolio
12.9.5. Recent Developments
12.9.6. SWOT Analysis
12.10. Maple Leaf Garden Food Co.
12.10.1. Business Overview
12.10.2. Company Snapshot
12.10.3. Company Market Share Analysis
12.10.4. Company Product Portfolio
12.10.5. Recent Developments
12.10.6. SWOT Analysis
12.11. Hoosier Hill Farm
12.11.1. Business Overview
12.11.2. Company Snapshot
12.11.3. Company Market Share Analysis
12.11.4. Company Product Portfolio
12.11.5. Recent Developments
12.11.6. SWOT Analysis
12.12. Island Abbey Foods Ltd.
12.12.1. Business Overview
12.12.2. Company Snapshot
12.12.3. Company Market Share Analysis
12.12.4. Company Product Portfolio
12.12.5. Recent Developments
12.12.6. SWOT Analysis
12.13. Natural Sourcing LLC
12.13.1. Business Overview
12.13.2. Company Snapshot
12.13.3. Company Market Share Analysis
12.13.4. Company Product Portfolio
12.13.5. Recent Developments
12.13.6. SWOT Analysis
12.14. Wuhu Deli Foods Co., Ltd
12.14.1. Business Overview
12.14.2. Company Snapshot
12.14.3. Company Market Share Analysis
12.14.4. Company Product Portfolio
12.14.5. Recent Developments
12.14.6. SWOT Analysis
List of Table
1. Global Dried Honey Market, By Category, 2019-2030 (USD Million)
2. Global Conventional, Dried Honey Market, By Region, 2019-2030 (USD Million)
3. Global Organic, Dried Honey Market, By Region, 2019-2030 (USD Million)
4. Global Dried Honey Market, By Form Type, 2019-2030 (USD Million)
5. Global Granular, Dried Honey Market, By Region, 2019-2030 (USD Million)
6. Global Powder, Dried Honey Market, By Region, 2019-2030 (USD Million)
7. Global Dried Honey Market, By Application, 2019-2030 (USD Million)
8. Global Pharmaceuticals, Dried Honey Market, By Region, 2019-2030 (USD Million)
9. Global Food and Beverages, Dried Honey Market, By Region, 2019-2030 (USD Million)
10. Global Personal Care and Cosmetics, Dried Honey Market, By Region, 2019-2030 (USD Million)
11. Global Dried Honey Market, By Sales Channel, 2019-2030 (USD Million)
12. Global Specialty Stores, Dried Honey Market, By Region, 2019-2030 (USD Million)
13. Global Supermarkets and Hypermarkets, Dried Honey Market, By Region, 2019-2030 (USD Million)
14. Global Retail Stores, Dried Honey Market, By Region, 2019-2030 (USD Million)
15. Global Online, Dried Honey Market, By Region, 2019-2030 (USD Million)
16. Global Dried Honey Market, By Region, 2019-2030 (USD Million)
17. North America Dried Honey Market, By Category, 2019-2030 (USD Million)
18. North America Dried Honey Market, By Form Type, 2019-2030 (USD Million)
19. North America Dried Honey Market, By Application, 2019-2030 (USD Million)
20. North America Dried Honey Market, By Sales Channel, 2019-2030 (USD Million)
21. U.S. Dried Honey Market, By Category, 2019-2030 (USD Million)
22. U.S. Dried Honey Market, By Form Type, 2019-2030 (USD Million)
23. U.S. Dried Honey Market, By Application, 2019-2030 (USD Million)
24. U.S. Dried Honey Market, By Sales Channel, 2019-2030 (USD Million)
25. Canada Dried Honey Market, By Category, 2019-2030 (USD Million)
26. Canada Dried Honey Market, By Form Type, 2019-2030 (USD Million)
27. Canada Dried Honey Market, By Application, 2019-2030 (USD Million)
28. Canada Dried Honey Market, By Sales Channel, 2019-2030 (USD Million)
29. Mexico Dried Honey Market, By Category, 2019-2030 (USD Million)
30. Mexico Dried Honey Market, By Form Type, 2019-2030 (USD Million)
31. Mexico Dried Honey Market, By Application, 2019-2030 (USD Million)
32. Mexico Dried Honey Market, By Sales Channel, 2019-2030 (USD Million)
33. Europe Dried Honey Market, By Category, 2019-2030 (USD Million)
34. Europe Dried Honey Market, By Form Type, 2019-2030 (USD Million)
35. Europe Dried Honey Market, By Application, 2019-2030 (USD Million)
36. Europe Dried Honey Market, By Sales Channel, 2019-2030 (USD Million)
37. Germany Dried Honey Market, By Category, 2019-2030 (USD Million)
38. Germany Dried Honey Market, By Form Type, 2019-2030 (USD Million)
39. Germany Dried Honey Market, By Application, 2019-2030 (USD Million)
40. Germany Dried Honey Market, By Sales Channel, 2019-2030 (USD Million)
41. France Dried Honey Market, By Category, 2019-2030 (USD Million)
42. France Dried Honey Market, By Form Type, 2019-2030 (USD Million)
43. France Dried Honey Market, By Application, 2019-2030 (USD Million)
44. France Dried Honey Market, By Sales Channel, 2019-2030 (USD Million)
45. U.K. Dried Honey Market, By Category, 2019-2030 (USD Million)
46. U.K. Dried Honey Market, By Form Type, 2019-2030 (USD Million)
47. U.K. Dried Honey Market, By Application, 2019-2030 (USD Million)
48. U.K. Dried Honey Market, By Sales Channel, 2019-2030 (USD Million)
49. Italy Dried Honey Market, By Category, 2019-2030 (USD Million)
50. Italy Dried Honey Market, By Form Type, 2019-2030 (USD Million)
51. Italy Dried Honey Market, By Application, 2019-2030 (USD Million)
52. Italy Dried Honey Market, By Sales Channel, 2019-2030 (USD Million)
53. Spain Dried Honey Market, By Category, 2019-2030 (USD Million)
54. Spain Dried Honey Market, By Form Type, 2019-2030 (USD Million)
55. Spain Dried Honey Market, By Application, 2019-2030 (USD Million)
56. Spain Dried Honey Market, By Sales Channel, 2019-2030 (USD Million)
57. Asia Pacific Dried Honey Market, By Category, 2019-2030 (USD Million)
58. Asia Pacific Dried Honey Market, By Form Type, 2019-2030 (USD Million)
59. Asia Pacific Dried Honey Market, By Application, 2019-2030 (USD Million)
60. Asia Pacific Dried Honey Market, By Sales Channel, 2019-2030 (USD Million)
61. Japan Dried Honey Market, By Category, 2019-2030 (USD Million)
62. Japan Dried Honey Market, By Form Type, 2019-2030 (USD Million)
63. Japan Dried Honey Market, By Application 2019-2030 (USD Million)
64. Japan Dried Honey Market, By Sales Channel, 2019-2030 (USD Million)
65. China Dried Honey Market, By Category, 2019-2030 (USD Million)
66. China Dried Honey Market, By Form Type, 2019-2030 (USD Million)
67. China Dried Honey Market, By Application, 2019-2030 (USD Million)
68. China Dried Honey Market, By Sales Channel, 2019-2030 (USD Million)
69. India Dried Honey Market, By Category, 2019-2030 (USD Million)
70. India Dried Honey Market, By Form Type, 2019-2030 (USD Million)
71. India Dried Honey Market, By Application, 2019-2030 (USD Million)
72. India Dried Honey Market, By Sales Channel, 2019-2030 (USD Million)
73. South America Dried Honey Market, By Category, 2019-2030 (USD Million)
74. South America Dried Honey Market, By Form Type, 2019-2030 (USD Million)
75. South America Dried Honey Market, By Application, 2019-2030 (USD Million)
76. South America Dried Honey Market, By Sales Channel, 2019-2030 (USD Million)
77. Brazil Dried Honey Market, By Category, 2019-2030 (USD Million)
78. Brazil Dried Honey Market, By Form Type, 2019-2030 (USD Million)
79. Brazil Dried Honey Market, By Application, 2019-2030 (USD Million)
80. Brazil Dried Honey Market, By Sales Channel, 2019-2030 (USD Million)
81. Middle East and Africa Dried Honey Market, By Category, 2019-2030 (USD Million)
82. Middle East and Africa Dried Honey Market, By Form Type, 2019-2030 (USD Million)
83. Middle East and Africa Dried Honey Market, By Application, 2019-2030 (USD Million)
84. Middle East and Africa Dried Honey Market, By Sales Channel, 2019-2030 (USD Million)
85. UAE Dried Honey Market, By Category, 2019-2030 (USD Million)
86. UAE Dried Honey Market, By Form Type, 2019-2030 (USD Million)
87. UAE Dried Honey Market, By Application, 2019-2030 (USD Million)
88. UAE Dried Honey Market, By Sales Channel, 2019-2030 (USD Million)
89. South Africa Dried Honey Market, By Category, 2019-2030 (USD Million)
90. South Africa Dried Honey Market, By Form Type, 2019-2030 (USD Million)
91. South Africa Dried Honey Market, By Application, 2019-2030 (USD Million)
92. South Africa Dried Honey Market, By Sales Channel, 2019-2030 (USD Million)
List of Figures
1. Global Dried Honey Market Segmentation
2. Dried Honey Market: Research Methodology
3. Market Size Estimation Methodology: Bottom-Up Approach
4. Market Size Estimation Methodology: Top-Down Approach
5. Data Triangulation
6. Porter’s Five Forces Analysis
7. Value Chain Analysis
8. Global Dried Honey Market Attractiveness Analysis By Category
9. Global Dried Honey Market Attractiveness Analysis By Form Type
10. Global Dried Honey Market Attractiveness Analysis By Application
11. Global Dried Honey Market Attractiveness Analysis By Sales Channel
12. Global Dried Honey Market Attractiveness Analysis By Region
13. Global Dried Honey Market: Dynamics
14. Global Dried Honey Market Share by Category (2022 & 2030)
15. Global Dried Honey Market Share by Form Type (2022 & 2030)
16. Global Dried Honey Market Share by Application (2022 & 2030)
17. Global Dried Honey Market Share by Sales Channel (2022 & 2030)
18. Global Dried Honey Market Share by Regions (2022 & 2030)
19. Global Dried Honey Market Share by Company (2021)
This study forecasts revenue at global, regional, and country levels from 2019 to 2030. The Brainy Insights has segmented the global dried honey market based on below mentioned segments:
Global Dried Honey Market by Category:
Global Dried Honey Market by Form Type:
Global Dried Honey Market by Application:
Global Dried Honey Market by Sales Channel:
Global Dried Honey Market by Region:
Research has its special purpose to undertake marketing efficiently. In this competitive scenario, businesses need information across all industry verticals; the information about customer wants, market demand, competition, industry trends, distribution channels etc. This information needs to be updated regularly because businesses operate in a dynamic environment. Our organization, The Brainy Insights incorporates scientific and systematic research procedures in order to get proper market insights and industry analysis for overall business success. The analysis consists of studying the market from a miniscule level wherein we implement statistical tools which helps us in examining the data with accuracy and precision.
Our research reports feature both; quantitative and qualitative aspects for any market. Qualitative information for any market research process are fundamental because they reveal the customer needs and wants, usage and consumption for any product/service related to a specific industry. This in turn aids the marketers/investors in knowing certain perceptions of the customers. Qualitative research can enlighten about the different product concepts and designs along with unique service offering that in turn, helps define marketing problems and generate opportunities. On the other hand, quantitative research engages with the data collection process through interviews, e-mail interactions, surveys and pilot studies. Quantitative aspects for the market research are useful to validate the hypotheses generated during qualitative research method, explore empirical patterns in the data with the help of statistical tools, and finally make the market estimations.
The Brainy Insights offers comprehensive research and analysis, based on a wide assortment of factual insights gained through interviews with CXOs and global experts and secondary data from reliable sources. Our analysts and industry specialist assume vital roles in building up statistical tools and analysis models, which are used to analyse the data and arrive at accurate insights with exceedingly informative research discoveries. The data provided by our organization have proven precious to a diverse range of companies, facilitating them to address issues such as determining which products/services are the most appealing, whether or not customers use the product in the manner anticipated, the purchasing intentions of the market and many others.
Our research methodology encompasses an idyllic combination of primary and secondary initiatives. Key phases involved in this process are listed below:

The phase involves the gathering and collecting of market data and its related information with the help of different sources & research procedures.

The data procurement stage involves in data gathering and collecting through various data sources.
This stage involves in extensive research. These data sources includes:
Purchased Database: Purchased databases play a crucial role in estimating the market sizes irrespective of the domain. Our purchased database includes:
Primary Research: The Brainy Insights interacts with leading companies and experts of the concerned domain to develop the analyst team’s market understanding and expertise. It improves and substantiates every single data presented in the market reports. Primary research mainly involves in telephonic interviews, E-mail interactions and face-to-face interviews with the raw material providers, manufacturers/producers, distributors, & independent consultants. The interviews that we conduct provides valuable data on market size and industry growth trends prevailing in the market. Our organization also conducts surveys with the various industry experts in order to gain overall insights of the industry/market. For instance, in healthcare industry we conduct surveys with the pharmacists, doctors, surgeons and nurses in order to gain insights and key information of a medical product/device/equipment which the customers are going to usage. Surveys are conducted in the form of questionnaire designed by our own analyst team. Surveys plays an important role in primary research because surveys helps us to identify the key target audiences of the market. Additionally, surveys helps to identify the key target audience engaged with the market. Our survey team conducts the survey by targeting the key audience, thus gaining insights from them. Based on the perspectives of the customers, this information is utilized to formulate market strategies. Moreover, market surveys helps us to understand the current competitive situation of the industry. To be precise, our survey process typically involve with the 360 analysis of the market. This analytical process begins by identifying the prospective customers for a product or service related to the market/industry to obtain data on how a product/service could fit into customers’ lives.

Secondary Research: The secondary data sources includes information published by the on-profit organizations such as World bank, WHO, company fillings, investor presentations, annual reports, national government documents, statistical databases, blogs, articles, white papers and others. From the annual report, we analyse a company’s revenue to understand the key segment and market share of that organization in a particular region. We analyse the company websites and adopt the product mapping technique which is important for deriving the segment revenue. In the product mapping method, we select and categorize the products offered by the companies catering to domain specific market, deduce the product revenue for each of the companies so as to get overall estimation of the market size. We also source data and analyses trends based on information received from supply side and demand side intermediaries in the value chain. The supply side denotes the data gathered from supplier, distributor, wholesaler and the demand side illustrates the data gathered from the end customers for respective market domain.

The supply side for a domain specific market is analysed by:
The demand side for the market is estimated through:
In-house Library: Apart from these third-party sources, we have our in-house library of qualitative and quantitative information. Our in-house database includes market data for various industry and domains. These data are updated on regular basis as per the changing market scenario. Our library includes, historic databases, internal audit reports and archives.
Sometimes there are instances where there is no metadata or raw data available for any domain specific market. For those cases, we use our expertise to forecast and estimate the market size in order to generate comprehensive data sets. Our analyst team adopt a robust research technique in order to produce the estimates:
Data Synthesis: This stage involves the analysis & mapping of all the information obtained from the previous step. It also involves in scrutinizing the data for any discrepancy observed while data gathering related to the market. The data is collected with consideration to the heterogeneity of sources. Robust scientific techniques are in place for synthesizing disparate data sets and provide the essential contextual information that can orient market strategies. The Brainy Insights has extensive experience in data synthesis where the data passes through various stages:


Market Deduction & Formulation: The final stage comprises of assigning data points at appropriate market spaces so as to deduce feasible conclusions. Analyst perspective & subject matter expert based holistic form of market sizing coupled with industry analysis also plays a crucial role in this stage.
This stage involves in finalization of the market size and numbers that we have collected from data integration step. With data interpolation, it is made sure that there is no gap in the market data. Successful trend analysis is done by our analysts using extrapolation techniques, which provide the best possible forecasts for the market.
Data Validation & Market Feedback: Validation is the most important step in the process. Validation & re-validation via an intricately designed process helps us finalize data-points to be used for final calculations.

The Brainy Insights interacts with leading companies and experts of the concerned domain to develop the analyst team’s market understanding and expertise. It improves and substantiates every single data presented in the market reports. The data validation interview and discussion panels are typically composed of the most experienced industry members. The participants include, however, are not limited to:
Moreover, we always validate our data and findings through primary respondents from all the major regions we are working on.


Free Customization
Fortune 500 Clients
Free Yearly Update On Purchase Of Multi/Corporate License
Companies Served Till Date