- +1-315-215-1633
- sales@thebrainyinsights.com

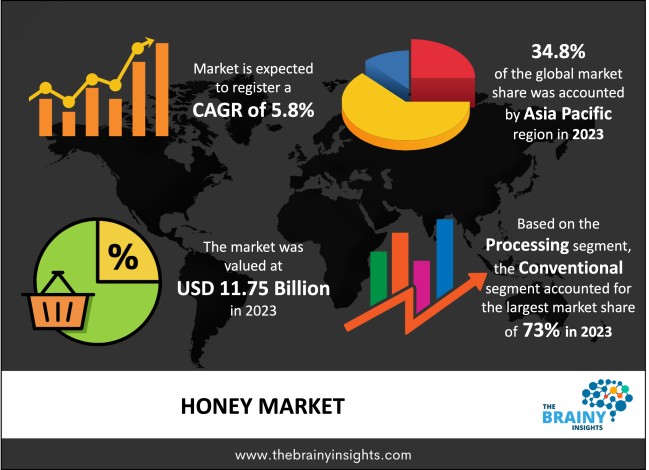
Global honey market is expected to reach USD 20.65 billion by 2033, at a CAGR of 5.8% from 2024 to 2033. Honey market growth would be driven by rising consumer preference for natural sweeteners instead of artificial sweeteners & sugar and a wide variety of applications of honey in beverages, baked goods, medicines, skin care, hair care, etc.
Using honey in natural remedies is driving sales up, with the added benefit of incorporating it into medications for cough and throat infections. This is due to its antiviral, antibacterial, and antifungal properties and confirmation of its therapeutic attributes. The market for Honey products continues to expand with various organic offerings increasing profitability opportunities during this period and massive investments made towards their production within the sector. As consumers become more aware of chemical-based drawbacks on health-associated products, such as chemicals used in producing honey substitutes versus Organic ones, there will undoubtedly be a continued growth trend observed in demand from buyers seeking healthier alternatives - attracting further business potentials for suppliers involved within this industry value chain globally.
Covid 19 infected a large proportion of the population. Majority of the people infected with the virus and mild symptoms like moderate cough or throat infection. For treating these mild symptoms, people explored home remedies, especially in India and its Asian neighbors. Consumption of honey saw a sharp rise, as it was one of the most effective home remedies to treat mild cough and throat infection. Honey is a sweet liquid, brown in color, the texture is thick compared to water. Honey is made by bees from the nectar which they collect from the flowers. The consumption of honey which saw an uptick during the covid 19 due to its effective medicinal properties is anticipated to continue this rise. Honey has varying amounts of vitamins, minerals, antioxidants, calcium etc. which makes the consumption of honey a healthy habit. It can be used as a substitute for sugar and artificial sweeteners as it gives the desirable sweet taste which comes with sugar & artificial sweeteners. Honey is found to have anti-bacterial, anti-fungal, anti-viral, anti-septic properties which help in healing burns and wounds, preventing acid reflux & fighting infections. It is also used by people for skin care, leading to its increased use in ingredient-based beauty and skin care products. Honey has a wide variety of applications with the added benefit of being healthy.
Get an overview of this study by requesting a free sample
With the increased emphasis on living a healthy lifestyle, there has been a shift in the eating habits of consumers. Studies have shown that daily sugar consumption can lead to heart diseases like heart failure, heart attacks & strokes. Hence there has been an increased demand for a healthy substitute for sugar. Honey, being a natural sweetener, gives a desirable sweet taste, is healthier, and has nutritional values and anti-microbial properties, making it the perfect substitute for sugar. Honey also can act as a substitute for artificial sweeteners, which are undesirable for your health.
Apiculture or beekeeping is the practice of maintaining bee colonies by humans. The colonies of bees are usually maintained in man-made hives, which have many barriers like lack of infrastructure, poor apiculture equipment, no market-oriented production of honey etc. This combined with the prevalence of honey bee predators could hamper the growth of the global honey market.
The nutritional value of honey has made it a popular ingredient to be used as a substitute of sugar & artificial sweeteners in the production of food & beverages. The medicinal properties of honey have significantly increased its demand in pharmaceuticals & healthcare. The increased use of honey in cough syrups is an ideal example. With the rise in home remedies for skin conditions, a parallel rise in demand was witnessed for honey. Major market players are now introducing honey-based beauty and cosmetics products to attract consumers.
There has been a decline in the native bee population around the world due to exploitative nature of anthropological activities. This decline leads to decrease in pollinators and impacts the food supply of the world. With introduction of beekeeping on commercial levels to meet the rising demand for honey there will be overpopulation of bees and the number of non-native bees is bound to decline in the area, this suppresses the pollination by native bees, which in turn negatively impacts the food supply. Commercial beekeeping is not sustainable as it leads to colony breakdowns which can lead to serious environmental damage in the future.
The global honey market has been segmented based on processing, distribution channel, application, packaging and regions.
The regions analyzed for the market include Asia Pacific, Europe, South America, Asia Pacific, and the Middle East and Africa. Asia Pacific region emerged as the largest market for the global honey market with a 34.8% share of the market revenue in 2023.
Asia Pacific region Honey Market Share in 2023 - 34.8%
www.thebrainyinsights.com
Check the geographical analysis of this market by requesting a free sample
The key players are now concentrating on implementing strategies such as adopting new technology, product innovations, mergers & acquisitions, joint venture, alliances, and partnerships to improve their market position in the global honey industry.
Dabur honey, a leading market player in production of honey and a well-established brand, introduced its new range of honey-infused syrups and spread in the flavor strawberry and chocolate. These products have no added sugar and are healthier compared to sugar-based spreads.
As per The Brainy Insights, the size of the honey market was valued at USD 11.75 Billion in 2023 to USD 20.65 Billion by 2033.
Global Honey market is growing at a CAGR of 5.8% during the forecast period 2024-2033.
Asia Pacific region emerged as the largest market for the honey.
The market's growth will be influenced by the increasing use of honey as a substitute for sugar & artificial sweeteners.
Barriers in apiculture or beekeeping could hamper the market growth.
Increasing application of honey in various industries will provide huge opportunities to the market.
Key players are Dabur India Ltd., Beeyond the Hive, New Zealand Honey Co., Oha Honey LP, Little Bee Impex, Barkman Honey LLC, Capilano Honey Ltd., Billy Bee Honey Products, Dutch Gold Honey, inc. and Golden Acres Honey.
1. Introduction
1.1. Objectives of the Study
1.2. Market Definition
1.3. Research Scope
1.4. Currency
1.5. Key Target Audience
2. Research Methodology and Assumptions
3. Executive Summary
4. Premium Insights
4.1. Porter’s Five Forces Analysis
4.2. Value Chain Analysis
4.3. Top Investment Pockets
4.3.1. Market Attractiveness Analysis By Processing
4.3.2. Market Attractiveness Analysis By Distribution Channel
4.3.3. Market Attractiveness Analysis By Application
4.3.4. Market Attractiveness Analysis By Packaging
4.3.5. Market Attractiveness Analysis By Region
4.4. Industry Trends
5. Market Dynamics
5.1. Market Evaluation
5.2. Drivers
5.2.1. Increasing use of honey as a substitute for sugar & artificial sweeteners
5.3. Restraints
5.3.1. Barriers in apiculture or beekeeping
5.4. Opportunities
5.4.1. Increasing application of honey in various industries
5.5. Challenges
5.5.1. The commercial production of honey is not sustainable
6. Global Honey Market Analysis and Forecast, By Processing
6.1. Segment Overview
6.2. Conventional
6.3. Organic
7. Global Honey Market Analysis and Forecast, By Distribution Channel
7.1. Segment Overview
7.2. Supermarkets/Hypermarkets
7.3. Convenience Stores
7.4. Online
7.5. Others
8. Global Honey Market Analysis and Forecast, By Application
8.1. Segment Overview
8.2. Food & Beverages
8.3. Personal Care & Cosmetics
8.4. Pharmaceuticals
8.5. Other Applications
9. Global Honey Market Analysis and Forecast, By Packaging
9.1. Segment Overview
9.2. Bottle
9.3. Glass Jar
9.4. Tub
9.5. Tube
9.6. Others
10. Global Honey Market Analysis and Forecast, By Regional Analysis
10.1. Segment Overview
10.2. North America
10.2.1. U.S.
10.2.2. Canada
10.2.3. Mexico
10.3. Europe
10.3.1. Germany
10.3.2. France
10.3.3. U.K.
10.3.4. Italy
10.3.5. Spain
10.4. Asia-Pacific
10.4.1. Japan
10.4.2. China
10.4.3. India
10.5. South America
10.5.1. Brazil
10.6. Middle East and Africa
10.6.1. UAE
10.6.2. South Africa
11. Global Honey Market-Competitive Landscape
11.1. Overview
11.2. Market Share of Key Players in the Honey Market
11.2.1. Global Company Market Share
11.2.2. North America Company Market Share
11.2.3. Europe Company Market Share
11.2.4. APAC Company Market Share
11.3. Competitive Situations and Trends
11.3.1. Product Launches and Developments
11.3.2. Partnerships, Collaborations, and Agreements
11.3.3. Mergers & Acquisitions
11.3.4. Expansions
12. Company Profiles
12.1. Dabur India Ltd.
12.1.1. Business Overview
12.1.2. Company Snapshot
12.1.3. Company Market Share Analysis
12.1.4. Company Component Portfolio
12.1.5. Recent Developments
12.1.6. SWOT Analysis
12.2. Beeyond the Hive
12.2.1. Business Overview
12.2.2. Company Snapshot
12.2.3. Company Market Share Analysis
12.2.4. Company Component Portfolio
12.2.5. Recent Developments
12.2.6. SWOT Analysis
12.3. New Zealand Honey Co.
12.3.1. Business Overview
12.3.2. Company Snapshot
12.3.3. Company Market Share Analysis
12.3.4. Company Component Portfolio
12.3.5. Recent Developments
12.3.6. SWOT Analysis
12.4. Oha Honey LP
12.4.1. Business Overview
12.4.2. Company Snapshot
12.4.3. Company Market Share Analysis
12.4.4. Company Component Portfolio
12.4.5. Recent Developments
12.4.6. SWOT Analysis
12.5. Little Bee Impex
12.5.1. Business Overview
12.5.2. Company Snapshot
12.5.3. Company Market Share Analysis
12.5.4. Company Component Portfolio
12.5.5. Recent Developments
12.5.6. SWOT Analysis
12.6. Barkman Honey LLC
12.6.1. Business Overview
12.6.2. Company Snapshot
12.6.3. Company Market Share Analysis
12.6.4. Company Component Portfolio
12.6.5. Recent Developments
12.6.6. SWOT Analysis
12.7. Capilano Honey Ltd.
12.7.1. Business Overview
12.7.2. Company Snapshot
12.7.3. Company Market Share Analysis
12.7.4. Company Component Portfolio
12.7.5. Recent Developments
12.7.6. SWOT Analysis
12.8. Billy Bee Honey Products
12.8.1. Business Overview
12.8.2. Company Snapshot
12.8.3. Company Market Share Analysis
12.8.4. Company Component Portfolio
12.8.5. Recent Developments
12.8.6. SWOT Analysis
12.9. Dutch Gold Honey, Inc.
12.9.1. Business Overview
12.9.2. Company Snapshot
12.9.3. Company Market Share Analysis
12.9.4. Company Component Portfolio
12.9.5. Recent Developments
12.9.6. SWOT Analysis
12.10. Golden Acres Honey
12.10.1. Business Overview
12.10.2. Company Snapshot
12.10.3. Company Market Share Analysis
12.10.4. Company Component Portfolio
12.10.5. Recent Developments
12.10.6. SWOT Analysis
List of Table
1. Global Honey Market, By Processing, 2020-2033 (USD Billion)
2. Global Conventional Honey Market, By Region, 2020-2033 (USD Billion)
3. Global Organic Honey Market, By Region, 2020-2033 (USD Billion)
4. Global Honey Market, By Distribution Channel, 2020-2033 (USD Billion)
5. Global Supermarkets/Hypermarkets Honey Market, By Region, 2020-2033 (USD Billion)
6. Global Convenience Stores Honey Market, By Region, 2020-2033 (USD Billion)
7. Global Online Honey Market, By Region, 2020-2033 (USD Billion)
8. Global Others Honey Market, By Region, 2020-2033 (USD Billion)
9. Global Honey Market, By Application, 2020-2033 (USD Billion)
10. Global Food & Beverages Honey Market, By Region, 2020-2033 (USD Billion)
11. Global Personal Care & Cosmetics Honey Market, By Region, 2020-2033 (USD Billion)
12. Global Pharmaceuticals Honey Market, By Region, 2020-2033 (USD Billion)
13. Global Other Applications Honey Market, By Region, 2020-2033 (USD Billion)
14. Global Honey Market, By Packaging, 2020-2033 (USD Billion)
15. Global Bottle Honey Market, By Region, 2020-2033 (USD Billion)
16. Global Glass Jar Honey Market, By Region, 2020-2033 (USD Billion)
17. Global Tub Honey Market, By Region, 2020-2033 (USD Billion)
18. Global Tube Honey Market, By Region, 2020-2033 (USD Billion)
19. Global Others Honey Market, By Region, 2020-2033 (USD Billion)
20. Global Honey Market, By Region, 2020-2033 (USD Billion)
21. North America Honey Market, By Processing, 2020-2033 (USD Billion)
22. North America Honey Market, By Distribution Channel, 2020-2033 (USD Billion)
23. North America Honey Market, By Application, 2020-2033 (USD Billion)
24. North America Honey Market, By Packaging, 2020-2033 (USD Billion)
25. U.S. Honey Market, By Processing, 2020-2033 (USD Billion)
26. U.S. Honey Market, By Distribution Channel, 2020-2033 (USD Billion)
27. U.S. Honey Market, By Application, 2020-2033 (USD Billion)
28. U.S. Honey Market, By Packaging, 2020-2033 (USD Billion)
29. Canada Honey Market, By Processing, 2020-2033 (USD Billion)
30. Canada Honey Market, By Distribution Channel, 2020-2033 (USD Billion)
31. Canada Honey Market, By Application, 2020-2033 (USD Billion)
32. Canada Honey Market, By Packaging, 2020-2033 (USD Billion)
33. Mexico Honey Market, By Processing, 2020-2033 (USD Billion)
34. Mexico Honey Market, By Distribution Channel, 2020-2033 (USD Billion)
35. Mexico Honey Market, By Application, 2020-2033 (USD Billion)
36. Mexico Honey Market, By Packaging, 2020-2033 (USD Billion)
37. Europe Honey Market, By Processing, 2020-2033 (USD Billion)
38. Europe Honey Market, By Distribution Channel, 2020-2033 (USD Billion)
39. Europe Honey Market, By Application, 2020-2033 (USD Billion)
40. Europe Honey Market, By Packaging, 2020-2033 (USD Billion)
41. Germany Honey Market, By Processing, 2020-2033 (USD Billion)
42. Germany Honey Market, By Distribution Channel, 2020-2033 (USD Billion)
43. Germany Honey Market, By Application, 2020-2033 (USD Billion)
44. Germany Honey Market, By Packaging, 2020-2033 (USD Billion)
45. France Honey Market, By Processing, 2020-2033 (USD Billion)
46. France Honey Market, By Distribution Channel, 2020-2033 (USD Billion)
47. France Honey Market, By Application, 2020-2033 (USD Billion)
48. France Honey Market, By Packaging, 2020-2033 (USD Billion)
49. U.K. Honey Market, By Processing, 2020-2033 (USD Billion)
50. U.K. Honey Market, By Distribution Channel, 2020-2033 (USD Billion)
51. U.K. Honey Market, By Application, 2020-2033 (USD Billion)
52. U.K. Honey Market, By Packaging, 2020-2033 (USD Billion)
53. Italy Honey Market, By Processing, 2020-2033 (USD Billion)
54. Italy Honey Market, By Distribution Channel, 2020-2033 (USD Billion)
55. Italy Honey Market, By Application, 2020-2033 (USD Billion)
56. Italy Honey Market, By Packaging, 2020-2033 (USD Billion)
57. Spain Honey Market, By Processing, 2020-2033 (USD Billion)
58. Spain Honey Market, By Distribution Channel, 2020-2033 (USD Billion)
59. Spain Honey Market, By Application, 2020-2033 (USD Billion)
60. Spain Honey Market, By Packaging, 2020-2033 (USD Billion)
61. Asia Pacific Honey Market, By Processing, 2020-2033 (USD Billion)
62. Asia Pacific Honey Market, By Distribution Channel, 2020-2033 (USD Billion)
63. Asia Pacific Honey Market, By Application, 2020-2033 (USD Billion)
64. Asia Pacific Honey Market, By Packaging, 2020-2033 (USD Billion)
65. Japan Honey Market, By Processing, 2020-2033 (USD Billion)
66. Japan Honey Market, By Distribution Channel, 2020-2033 (USD Billion)
67. Japan Honey Market, By Application, 2020-2033 (USD Billion)
68. Japan Honey Market, By Packaging, 2020-2033 (USD Billion)
69. China Honey Market, By Processing, 2020-2033 (USD Billion)
70. China Honey Market, By Distribution Channel, 2020-2033 (USD Billion)
71. China Honey Market, By Application, 2020-2033 (USD Billion)
72. China Honey Market, By Packaging, 2020-2033 (USD Billion)
73. India Honey Market, By Processing, 2020-2033 (USD Billion)
74. India Honey Market, By Distribution Channel, 2020-2033 (USD Billion)
75. India Honey Market, By Application, 2020-2033 (USD Billion)
76. India Honey Market, By Packaging, 2020-2033 (USD Billion)
77. South America Honey Market, By Processing, 2020-2033 (USD Billion)
78. South America Honey Market, By Distribution Channel, 2020-2033 (USD Billion)
79. South America Honey Market, By Application, 2020-2033 (USD Billion)
80. South America Honey Market, By Packaging, 2020-2033 (USD Billion)
81. Brazil Honey Market, By Processing, 2020-2033 (USD Billion)
82. Brazil Honey Market, By Distribution Channel, 2020-2033 (USD Billion)
83. Brazil Honey Market, By Application, 2020-2033 (USD Billion)
84. Brazil Honey Market, By Packaging, 2020-2033 (USD Billion)
85. Middle East and Africa Honey Market, By Processing, 2020-2033 (USD Billion)
86. Middle East and Africa Honey Market, By Distribution Channel, 2020-2033 (USD Billion)
87. Middle East and Africa Honey Market, By Application, 2020-2033 (USD Billion)
88. Middle East and Africa Honey Market, By Packaging, 2020-2033 (USD Billion)
89. UAE Honey Market, By Processing, 2020-2033 (USD Billion)
90. UAE Honey Market, By Distribution Channel, 2020-2033 (USD Billion)
91. UAE Honey Market, By Application, 2020-2033 (USD Billion)
92. UAE Honey Market, By Packaging, 2020-2033 (USD Billion)
93. South Africa Honey Market, By Processing, 2020-2033 (USD Billion)
94. South Africa Honey Market, By Distribution Channel, 2020-2033 (USD Billion)
95. South Africa Honey Market, By Application, 2020-2033 (USD Billion)
96. South Africa Honey Market, By Packaging, 2020-2033 (USD Billion)
List of Figures
1. Global Honey Market Segmentation
2. Honey Market: Research Methodology
3. Market Size Estimation Methodology: Bottom-Up Approach
4. Market Size Estimation Methodology: Top-Down Approach
5. Data Triangulation
6. Porter’s Five Forces Analysis
7. Value Chain Analysis
8. Global Honey Market Attractiveness Analysis By Processing
9. Global Honey Market Attractiveness Analysis By Distribution Channel
10. Global Honey Market Attractiveness Analysis By Application
11. Global Honey Market Attractiveness Analysis By Packaging
12. Global Honey Market Attractiveness Analysis By Region
13. Global Honey Market: Dynamics
14. Global Honey Market Share by Processing (2023 & 2033)
15. Global Honey Market Share by Distribution Channel (2023 & 2033)
16. Global Honey Market Share by Application (2023 & 2033)
17. Global Honey Market Share by Regions (2023 & 2033)
18. Global Honey Market Share by Company (2023)
This study forecasts revenue at global, regional, and country levels from 2020 to 2033. The Brainy Insights has segmented the global honey market based on below mentioned segments:
Global Honey Market by Processing:
Global Honey Market by Distribution Channel:
Global Honey Market by Application:
Global Honey Market by Packaging:
Global Honey Market by Region:
Research has its special purpose to undertake marketing efficiently. In this competitive scenario, businesses need information across all industry verticals; the information about customer wants, market demand, competition, industry trends, distribution channels etc. This information needs to be updated regularly because businesses operate in a dynamic environment. Our organization, The Brainy Insights incorporates scientific and systematic research procedures in order to get proper market insights and industry analysis for overall business success. The analysis consists of studying the market from a miniscule level wherein we implement statistical tools which helps us in examining the data with accuracy and precision.
Our research reports feature both; quantitative and qualitative aspects for any market. Qualitative information for any market research process are fundamental because they reveal the customer needs and wants, usage and consumption for any product/service related to a specific industry. This in turn aids the marketers/investors in knowing certain perceptions of the customers. Qualitative research can enlighten about the different product concepts and designs along with unique service offering that in turn, helps define marketing problems and generate opportunities. On the other hand, quantitative research engages with the data collection process through interviews, e-mail interactions, surveys and pilot studies. Quantitative aspects for the market research are useful to validate the hypotheses generated during qualitative research method, explore empirical patterns in the data with the help of statistical tools, and finally make the market estimations.
The Brainy Insights offers comprehensive research and analysis, based on a wide assortment of factual insights gained through interviews with CXOs and global experts and secondary data from reliable sources. Our analysts and industry specialist assume vital roles in building up statistical tools and analysis models, which are used to analyse the data and arrive at accurate insights with exceedingly informative research discoveries. The data provided by our organization have proven precious to a diverse range of companies, facilitating them to address issues such as determining which products/services are the most appealing, whether or not customers use the product in the manner anticipated, the purchasing intentions of the market and many others.
Our research methodology encompasses an idyllic combination of primary and secondary initiatives. Key phases involved in this process are listed below:

The phase involves the gathering and collecting of market data and its related information with the help of different sources & research procedures.

The data procurement stage involves in data gathering and collecting through various data sources.
This stage involves in extensive research. These data sources includes:
Purchased Database: Purchased databases play a crucial role in estimating the market sizes irrespective of the domain. Our purchased database includes:
Primary Research: The Brainy Insights interacts with leading companies and experts of the concerned domain to develop the analyst team’s market understanding and expertise. It improves and substantiates every single data presented in the market reports. Primary research mainly involves in telephonic interviews, E-mail interactions and face-to-face interviews with the raw material providers, manufacturers/producers, distributors, & independent consultants. The interviews that we conduct provides valuable data on market size and industry growth trends prevailing in the market. Our organization also conducts surveys with the various industry experts in order to gain overall insights of the industry/market. For instance, in healthcare industry we conduct surveys with the pharmacists, doctors, surgeons and nurses in order to gain insights and key information of a medical product/device/equipment which the customers are going to usage. Surveys are conducted in the form of questionnaire designed by our own analyst team. Surveys plays an important role in primary research because surveys helps us to identify the key target audiences of the market. Additionally, surveys helps to identify the key target audience engaged with the market. Our survey team conducts the survey by targeting the key audience, thus gaining insights from them. Based on the perspectives of the customers, this information is utilized to formulate market strategies. Moreover, market surveys helps us to understand the current competitive situation of the industry. To be precise, our survey process typically involve with the 360 analysis of the market. This analytical process begins by identifying the prospective customers for a product or service related to the market/industry to obtain data on how a product/service could fit into customers’ lives.

Secondary Research: The secondary data sources includes information published by the on-profit organizations such as World bank, WHO, company fillings, investor presentations, annual reports, national government documents, statistical databases, blogs, articles, white papers and others. From the annual report, we analyse a company’s revenue to understand the key segment and market share of that organization in a particular region. We analyse the company websites and adopt the product mapping technique which is important for deriving the segment revenue. In the product mapping method, we select and categorize the products offered by the companies catering to domain specific market, deduce the product revenue for each of the companies so as to get overall estimation of the market size. We also source data and analyses trends based on information received from supply side and demand side intermediaries in the value chain. The supply side denotes the data gathered from supplier, distributor, wholesaler and the demand side illustrates the data gathered from the end customers for respective market domain.

The supply side for a domain specific market is analysed by:
The demand side for the market is estimated through:
In-house Library: Apart from these third-party sources, we have our in-house library of qualitative and quantitative information. Our in-house database includes market data for various industry and domains. These data are updated on regular basis as per the changing market scenario. Our library includes, historic databases, internal audit reports and archives.
Sometimes there are instances where there is no metadata or raw data available for any domain specific market. For those cases, we use our expertise to forecast and estimate the market size in order to generate comprehensive data sets. Our analyst team adopt a robust research technique in order to produce the estimates:
Data Synthesis: This stage involves the analysis & mapping of all the information obtained from the previous step. It also involves in scrutinizing the data for any discrepancy observed while data gathering related to the market. The data is collected with consideration to the heterogeneity of sources. Robust scientific techniques are in place for synthesizing disparate data sets and provide the essential contextual information that can orient market strategies. The Brainy Insights has extensive experience in data synthesis where the data passes through various stages:


Market Deduction & Formulation: The final stage comprises of assigning data points at appropriate market spaces so as to deduce feasible conclusions. Analyst perspective & subject matter expert based holistic form of market sizing coupled with industry analysis also plays a crucial role in this stage.
This stage involves in finalization of the market size and numbers that we have collected from data integration step. With data interpolation, it is made sure that there is no gap in the market data. Successful trend analysis is done by our analysts using extrapolation techniques, which provide the best possible forecasts for the market.
Data Validation & Market Feedback: Validation is the most important step in the process. Validation & re-validation via an intricately designed process helps us finalize data-points to be used for final calculations.

The Brainy Insights interacts with leading companies and experts of the concerned domain to develop the analyst team’s market understanding and expertise. It improves and substantiates every single data presented in the market reports. The data validation interview and discussion panels are typically composed of the most experienced industry members. The participants include, however, are not limited to:
Moreover, we always validate our data and findings through primary respondents from all the major regions we are working on.


Free Customization
Fortune 500 Clients
Free Yearly Update On Purchase Of Multi/Corporate License
Companies Served Till Date