- +1-315-215-1633
- sales@thebrainyinsights.com

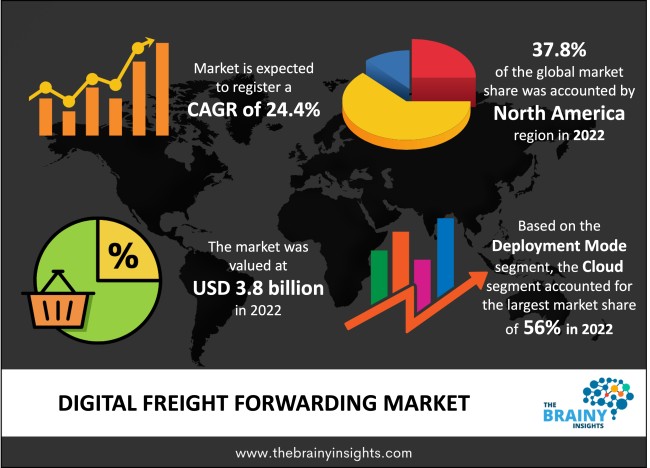
The global digital freight forwarding market was valued at USD 3.8 billion in 2022, growing at a CAGR of 24.4% from 2023 to 2032. The market is expected to reach USD 33.7 billion by 2032. The expansion of free trade agreements and the e-commerce sector drive the worldwide digital freight forwarding market.
A digital freight forwarder uses digital tools to facilitate efficient communication and quickly obtain status updates on every shipment. Digital freight forwarders use a fully transparent system to compare shippers and present their clients with the best deal. Creating, uploading, and distributing all documents online and making them easily accessible to all parties involved seeks to minimise the amount of paper effort. The e-commerce sector's growth and the rise in free trade agreements are two main reasons driving the worldwide digital freight forwarding market's expansion. However, inadequate infrastructure, increased logistics costs, and strict air freight laws hampered the market's expansion. Conversely, the increase in the use of multi-modal systems for e-commerce logistics and the decrease in costs and lead times resulting from their adoption are anticipated to create new opportunities for market expansion throughout the forecast period.
Get an overview of this study by requesting a free sample
In May 2021, Kuehne+Nagel, a logistics and transportation firm headquartered in Switzerland, purchased Apex International Corporation for an undisclosed sum. By way of this combination, Apex and Kuehne+Nagel concentrate on giving their clients a strong offering in the cutthroat Asian logistics market, particularly in e-mobility, hi-tech, and e-commerce fulfilment. Logistics company Apex International Corporation is in China and specialises in goods forwarding.
Expansion of e-commerce - E-commerce is the sale of goods and services online via websites without needing a physical location. Logistics services are used by the e-commerce sector to monitor and manage the supply chain of e-commerce businesses, freeing them up to concentrate on marketing and other business-related activities. E-commerce is a popular way to buy a wide range of products because of its easy accessibility, pleasant shopping experiences, and substantial savings & deals. The market for e-commerce services has expanded due to all these reasons.
Poor infrastructure and higher logistics costs- Sophisticated infrastructure, a well-managed supply chain, and trade facilitation laws are necessary for an effective logistics environment. Without these, logistics companies must invest in increasing working capital and stock reserves, which can negatively impact regional and national competitiveness due to high costs. Logistics are further hampered by the underdevelopment of infrastructure in many countries, which raises costs and lowers supply chain dependability.
Rise in free trade agreements- The main drivers of the logistics industry's expansion are the improvement of the global economy and the dynamic market conditions. Additionally, the number of trade-related activities is significantly increasing, which can be linked to the rapid globalisation that is taking place. As a result, it becomes harder for manufacturers or retailers to monitor supply chain activity efficiently. Throughout the projected years, this aspect is anticipated to propel the growth of the digital freight forwarding market.
The regions analyzed for the market include North America, Europe, South America, Asia Pacific, the Middle East, and Africa. North America emerged as the largest global digital freight forwarding market, with a 37.8% market revenue share in 2022.
The primary reason is that the US has historically led the globe in international trade. Moreover, a large portion of the industry's players are North American. However, due to its expanding industrial bases and special economic zones (SEZ), the Asia-Pacific (APAC) region is expected to grow fastest throughout the projection period, trailing behind the North American market.
North America Region Digital Freight Forwarding Market Share in 2022 - 37.8%
www.thebrainyinsights.com
Check the geographical analysis of this market by requesting a free sample
The mode of transport segment is divided into sea, air, and land. The sea segment dominated the market, with a market share of around 40% in 2022. Most freight forwarding is done via sea transport as it is the cheapest mode of freight forwarding.
The deployment mode segment is divided into on-premises and cloud. The cloud segment dominated the market, with a market share of around 56% in 2022. Cloud services offer several benefits, such as flexibility and easy management capabilities for huge amounts of freight. Cloud services also offer tracking services, making it easy for businesses to track their freights.
The vertical segment is divided into manufacturing, automotive, retail and e-commerce, healthcare, and others. The retail and e-commerce segment dominated the market, with a market share of around 34% in 2022. Increasing demand for e-commerce business drives the segment's growth.
| Attribute | Description |
|---|---|
| Market Size | Revenue (USD Billion) |
| Market size value in 2022 | USD 3.8 Billion |
| Market size value in 2032 | USD 33.7 Billion |
| CAGR (2023 to 2032) | 24.4% |
| Historical data | 2019-2021 |
| Base Year | 2022 |
| Forecast | 2023-2032 |
| Region | The regions analyzed for the market are Asia Pacific, Europe, South America, North America, and Middle East & Africa. Furthermore, the regions are further analyzed at the country level. |
| Segments | Mode of Transport, Deployment Mode, Vertical |
As per The Brainy Insights, the size of the digital freight forwarding market was valued at USD 3.8 billion in 2022 to USD 33.7 billion by 2032.
The global digital freight forwarding market is growing at a CAGR of 24.4% during the forecast period 2023-2032.
North America emerged as the largest digital freight forwarding market.
Key players in the digital freight forwarding market are Turvo Inc., Kuehne+Nagel International AG, Uber Freight LLC, Deutsche Post DHL Group, Descartes Kontainers, Flexport, Inc., Transporteca, Icontainers, Forto GmbH, and Twill.
1. Introduction
1.1. Objectives of the Study
1.2. Market Definition
1.3. Research Scope
1.4. Currency
1.5. Key Target Audience
2. Research Methodology and Assumptions
3. Executive Summary
4. Premium Insights
4.1. Porter’s Five Forces Analysis
4.2. Value Chain Analysis
4.3. Top Investment Pockets
4.3.1. Market Attractiveness Analysis by Mode of Transport
4.3.2. Market Attractiveness Analysis by Deployment Mode
4.3.3. Market Attractiveness Analysis by Vertical
4.3.4. Market Attractiveness Analysis by Region
4.4. Industry Trends
5. Market Dynamics
5.1. Market Evaluation
5.2. Drivers
5.2.1. Expansion of e-commerce
5.3. Restraints
5.3.1. Poor infrastructure and higher logistics costs
5.4. Opportunities
5.4.1. Rise in free trade agreements
5.5. Challenges
5.5.1. Stringent regulations
6. Global Digital Freight Forwarding Market Analysis and Forecast, By Mode of Transport
6.1. Segment Overview
6.2. Sea
6.3. Air
6.4. Land
7. Global Digital Freight Forwarding Market Analysis and Forecast, By Deployment Mode
7.1. Segment Overview
7.2. On-Premises
7.3. Cloud
8. Global Digital Freight Forwarding Market Analysis and Forecast, By Vertical
8.1. Segment Overview
8.2. Manufacturing
8.3. Automotive
8.4. Retail and E-Commerce
8.5. Healthcare
8.6. Others
9. Global Digital Freight Forwarding Market Analysis and Forecast, By Regional Analysis
9.1. Segment Overview
9.2. North America
9.2.1. U.S.
9.2.2. Canada
9.2.3. Mexico
9.3. Europe
9.3.1. Germany
9.3.2. France
9.3.3. U.K.
9.3.4. Italy
9.3.5. Spain
9.4. Asia-Pacific
9.4.1. Japan
9.4.2. China
9.4.3. India
9.5. South America
9.5.1. Brazil
9.6. Middle East and Africa
9.6.1. UAE
9.6.2. South Africa
10. Global Digital Freight Forwarding Market-Competitive Landscape
10.1. Overview
10.2. Market Share of Key Players in Global Digital Freight Forwarding Market
10.2.1. Global Company Market Share
10.2.2. North America Company Market Share
10.2.3. Europe Company Market Share
10.2.4. APAC Company Market Share
10.3. Competitive Situations and Trends
10.3.1. Product Launches and Developments
10.3.2. Partnerships, Collaborations, and Agreements
10.3.3. Mergers & Acquisitions
10.3.4. Expansions
11. Company Profiles
11.1. Turvo Inc.
11.1.1. Business Overview
11.1.2. Company Snapshot
11.1.3. Company Market Share Analysis
11.1.4. Company Product Portfolio
11.1.5. Recent Developments
11.1.6. SWOT Analysis
11.2. Kuehne+Nagel International AG
11.2.1. Business Overview
11.2.2. Company Snapshot
11.2.3. Company Market Share Analysis
11.2.4. Company Product Portfolio
11.2.5. Recent Developments
11.2.6. SWOT Analysis
11.3. Uber Freight LLC
11.3.1. Business Overview
11.3.2. Company Snapshot
11.3.3. Company Market Share Analysis
11.3.4. Company Product Portfolio
11.3.5. Recent Developments
11.3.6. SWOT Analysis
11.4. Deutsche Post DHL Group
11.4.1. Business Overview
11.4.2. Company Snapshot
11.4.3. Company Market Share Analysis
11.4.4. Company Product Portfolio
11.4.5. Recent Developments
11.4.6. SWOT Analysis
11.5. Descartes Kontainers
11.5.1. Business Overview
11.5.2. Company Snapshot
11.5.3. Company Market Share Analysis
11.5.4. Company Product Portfolio
11.5.5. Recent Developments
11.5.6. SWOT Analysis
11.6. Flexport, Inc.
11.6.1. Business Overview
11.6.2. Company Snapshot
11.6.3. Company Market Share Analysis
11.6.4. Company Product Portfolio
11.6.5. Recent Developments
11.6.6. SWOT Analysis
11.7. Transporteca
11.7.1. Business Overview
11.7.2. Company Snapshot
11.7.3. Company Market Share Analysis
11.7.4. Company Product Portfolio
11.7.5. Recent Developments
11.7.6. SWOT Analysis
11.8. Icontainers
11.8.1. Business Overview
11.8.2. Company Snapshot
11.8.3. Company Market Share Analysis
11.8.4. Company Product Portfolio
11.8.5. Recent Developments
11.8.6. SWOT Analysis
11.9. Forto GmbH
11.9.1. Business Overview
11.9.2. Company Snapshot
11.9.3. Company Market Share Analysis
11.9.4. Company Product Portfolio
11.9.5. Recent Developments
11.9.6. SWOT Analysis
11.10. Twill
11.10.1. Business Overview
11.10.2. Company Snapshot
11.10.3. Company Market Share Analysis
11.10.4. Company Product Portfolio
11.10.5. Recent Developments
11.10.6. SWOT Analysis
List of Table
1. Global Digital Freight Forwarding Market, By Mode of Transport, 2019-2032 (USD Billion)
2. Global Sea, Digital Freight Forwarding Market, By Region, 2019-2032 (USD Billion)
3. Global Air, Digital Freight Forwarding Market, By Region, 2019-2032 (USD Billion)
4. Global Land, Digital Freight Forwarding Market, By Region, 2019-2032 (USD Billion)
5. Global Digital Freight Forwarding Market, By Deployment Mode, 2019-2032 (USD Billion)
6. Global On-Premises, Digital Freight Forwarding Market, By Region, 2019-2032 (USD Billion)
7. Global Cloud, Digital Freight Forwarding Market, By Region, 2019-2032 (USD Billion)
8. Global Digital Freight Forwarding Market, By Vertical, 2019-2032 (USD Billion)
9. Global Manufacturing, Digital Freight Forwarding Market, By Region, 2019-2032 (USD Billion)
10. Global Automotive, Digital Freight Forwarding Market, By Region, 2019-2032 (USD Billion)
11. Global Retail and E-Commerce, Digital Freight Forwarding Market, By Region, 2019-2032 (USD Billion)
12. Global Healthcare, Digital Freight Forwarding Market, By Region, 2019-2032 (USD Billion)
13. Global Others, Digital Freight Forwarding Market, By Region, 2019-2032 (USD Billion)
14. North America Digital Freight Forwarding Market, By Mode of Transport, 2019-2032 (USD Billion)
15. North America Digital Freight Forwarding Market, By Deployment Mode, 2019-2032 (USD Billion)
16. North America Digital Freight Forwarding Market, By Vertical, 2019-2032 (USD Billion)
17. U.S. Digital Freight Forwarding Market, By Mode of Transport, 2019-2032 (USD Billion)
18. U.S. Digital Freight Forwarding Market, By Deployment Mode, 2019-2032 (USD Billion)
19. U.S. Digital Freight Forwarding Market, By Vertical, 2019-2032 (USD Billion)
20. Canada Digital Freight Forwarding Market, By Mode of Transport, 2019-2032 (USD Billion)
21. Canada Digital Freight Forwarding Market, By Deployment Mode, 2019-2032 (USD Billion)
22. Canada Digital Freight Forwarding Market, By Vertical, 2019-2032 (USD Billion)
23. Mexico Digital Freight Forwarding Market, By Mode of Transport, 2019-2032 (USD Billion)
24. Mexico Digital Freight Forwarding Market, By Deployment Mode, 2019-2032 (USD Billion)
25. Mexico Digital Freight Forwarding Market, By Vertical, 2019-2032 (USD Billion)
26. Europe Digital Freight Forwarding Market, By Mode of Transport, 2019-2032 (USD Billion)
27. Europe Digital Freight Forwarding Market, By Deployment Mode, 2019-2032 (USD Billion)
28. Europe Digital Freight Forwarding Market, By Vertical, 2019-2032 (USD Billion)
29. Germany Digital Freight Forwarding Market, By Mode of Transport, 2019-2032 (USD Billion)
30. Germany Digital Freight Forwarding Market, By Deployment Mode, 2019-2032 (USD Billion)
31. Germany Digital Freight Forwarding Market, By Vertical, 2019-2032 (USD Billion)
32. France Digital Freight Forwarding Market, By Mode of Transport, 2019-2032 (USD Billion)
33. France Digital Freight Forwarding Market, By Deployment Mode, 2019-2032 (USD Billion)
34. France Digital Freight Forwarding Market, By Vertical, 2019-2032 (USD Billion)
35. U.K. Digital Freight Forwarding Market, By Mode of Transport, 2019-2032 (USD Billion)
36. U.K. Digital Freight Forwarding Market, By Deployment Mode, 2019-2032 (USD Billion)
37. U.K. Digital Freight Forwarding Market, By Vertical, 2019-2032 (USD Billion)
38. Italy Digital Freight Forwarding Market, By Mode of Transport, 2019-2032 (USD Billion)
39. Italy Digital Freight Forwarding Market, By Deployment Mode, 2019-2032 (USD Billion)
40. Italy Digital Freight Forwarding Market, By Vertical, 2019-2032 (USD Billion)
41. Spain Digital Freight Forwarding Market, By Mode of Transport, 2019-2032 (USD Billion)
42. Spain Digital Freight Forwarding Market, By Deployment Mode, 2019-2032 (USD Billion)
43. Spain Digital Freight Forwarding Market, By Vertical, 2019-2032 (USD Billion)
44. Asia Pacific Digital Freight Forwarding Market, By Mode of Transport, 2019-2032 (USD Billion)
45. Asia Pacific Digital Freight Forwarding Market, By Deployment Mode, 2019-2032 (USD Billion)
46. Asia Pacific Digital Freight Forwarding Market, By Vertical, 2019-2032 (USD Billion)
47. Japan Digital Freight Forwarding Market, By Mode of Transport, 2019-2032 (USD Billion)
48. Japan Digital Freight Forwarding Market, By Deployment Mode, 2019-2032 (USD Billion)
49. Japan Digital Freight Forwarding Market, By Vertical, 2019-2032 (USD Billion)
50. China Digital Freight Forwarding Market, By Mode of Transport, 2019-2032 (USD Billion)
51. China Digital Freight Forwarding Market, By Deployment Mode, 2019-2032 (USD Billion)
52. China Digital Freight Forwarding Market, By Vertical, 2019-2032 (USD Billion)
53. India Digital Freight Forwarding Market, By Mode of Transport, 2019-2032 (USD Billion)
54. India Digital Freight Forwarding Market, By Deployment Mode, 2019-2032 (USD Billion)
55. India Digital Freight Forwarding Market, By Vertical, 2019-2032 (USD Billion)
56. South America Digital Freight Forwarding Market, By Mode of Transport, 2019-2032 (USD Billion)
57. South America Digital Freight Forwarding Market, By Deployment Mode, 2019-2032 (USD Billion)
58. South America Digital Freight Forwarding Market, By Vertical, 2019-2032 (USD Billion)
59. Brazil Digital Freight Forwarding Market, By Mode of Transport, 2019-2032 (USD Billion)
60. Brazil Digital Freight Forwarding Market, By Deployment Mode, 2019-2032 (USD Billion)
61. Brazil Digital Freight Forwarding Market, By Vertical, 2019-2032 (USD Billion)
62. Middle East and Africa Digital Freight Forwarding Market, By Mode of Transport, 2019-2032 (USD Billion)
63. Middle East and Africa Digital Freight Forwarding Market, By Deployment Mode, 2019-2032 (USD Billion)
64. Middle East and Africa Digital Freight Forwarding Market, By Vertical, 2019-2032 (USD Billion)
65. UAE Digital Freight Forwarding Market, By Mode of Transport, 2019-2032 (USD Billion)
66. UAE Digital Freight Forwarding Market, By Deployment Mode, 2019-2032 (USD Billion)
67. UAE Digital Freight Forwarding Market, By Vertical, 2019-2032 (USD Billion)
68. South Africa Digital Freight Forwarding Market, By Mode of Transport, 2019-2032 (USD Billion)
69. South Africa Digital Freight Forwarding Market, By Deployment Mode, 2019-2032 (USD Billion)
70. South Africa Digital Freight Forwarding Market, By Vertical, 2019-2032 (USD Billion)
List of Figures
1. Global Digital Freight Forwarding Market Segmentation
2. Global Digital Freight Forwarding Market: Research Methodology
3. Market Size Estimation Methodology: Bottom-Up Approach
4. Market Size Estimation Methodology: Top-Down Approach
5. Data Triangulation
6. Porter’s Five Forces Analysis
7. Value Chain Analysis
8. Global Digital Freight Forwarding Market Attractiveness Analysis by Mode of Transport
9. Global Digital Freight Forwarding Market Attractiveness Analysis by Deployment Mode
10. Global Digital Freight Forwarding Market Attractiveness Analysis by Vertical
11. Global Digital Freight Forwarding Market Attractiveness Analysis by Region
12. Global Digital Freight Forwarding Market: Dynamics
13. Global Digital Freight Forwarding Market Share by Mode of Transport (2023 & 2032)
14. Global Digital Freight Forwarding Market Share by Deployment Mode (2023 & 2032)
15. Global Digital Freight Forwarding Market Share by Vertical (2023 & 2032)
16. Global Digital Freight Forwarding Market Share by Regions (2023 & 2032)
17. Global Digital Freight Forwarding Market Share by Company (2022)
This study forecasts global, regional, and country revenue from 2019 to 2032. The Brainy Insights has segmented the global digital freight forwarding market based on the below-mentioned segments:
Global Digital Freight Forwarding Market By Mode of Transport:
Global Digital Freight Forwarding Market By Deployment Mode:
Global Digital Freight Forwarding Market By Vertical:
Global Digital Freight Forwarding Market By Region:
Research has its special purpose to undertake marketing efficiently. In this competitive scenario, businesses need information across all industry verticals; the information about customer wants, market demand, competition, industry trends, distribution channels etc. This information needs to be updated regularly because businesses operate in a dynamic environment. Our organization, The Brainy Insights incorporates scientific and systematic research procedures in order to get proper market insights and industry analysis for overall business success. The analysis consists of studying the market from a miniscule level wherein we implement statistical tools which helps us in examining the data with accuracy and precision.
Our research reports feature both; quantitative and qualitative aspects for any market. Qualitative information for any market research process are fundamental because they reveal the customer needs and wants, usage and consumption for any product/service related to a specific industry. This in turn aids the marketers/investors in knowing certain perceptions of the customers. Qualitative research can enlighten about the different product concepts and designs along with unique service offering that in turn, helps define marketing problems and generate opportunities. On the other hand, quantitative research engages with the data collection process through interviews, e-mail interactions, surveys and pilot studies. Quantitative aspects for the market research are useful to validate the hypotheses generated during qualitative research method, explore empirical patterns in the data with the help of statistical tools, and finally make the market estimations.
The Brainy Insights offers comprehensive research and analysis, based on a wide assortment of factual insights gained through interviews with CXOs and global experts and secondary data from reliable sources. Our analysts and industry specialist assume vital roles in building up statistical tools and analysis models, which are used to analyse the data and arrive at accurate insights with exceedingly informative research discoveries. The data provided by our organization have proven precious to a diverse range of companies, facilitating them to address issues such as determining which products/services are the most appealing, whether or not customers use the product in the manner anticipated, the purchasing intentions of the market and many others.
Our research methodology encompasses an idyllic combination of primary and secondary initiatives. Key phases involved in this process are listed below:

The phase involves the gathering and collecting of market data and its related information with the help of different sources & research procedures.

The data procurement stage involves in data gathering and collecting through various data sources.
This stage involves in extensive research. These data sources includes:
Purchased Database: Purchased databases play a crucial role in estimating the market sizes irrespective of the domain. Our purchased database includes:
Primary Research: The Brainy Insights interacts with leading companies and experts of the concerned domain to develop the analyst team’s market understanding and expertise. It improves and substantiates every single data presented in the market reports. Primary research mainly involves in telephonic interviews, E-mail interactions and face-to-face interviews with the raw material providers, manufacturers/producers, distributors, & independent consultants. The interviews that we conduct provides valuable data on market size and industry growth trends prevailing in the market. Our organization also conducts surveys with the various industry experts in order to gain overall insights of the industry/market. For instance, in healthcare industry we conduct surveys with the pharmacists, doctors, surgeons and nurses in order to gain insights and key information of a medical product/device/equipment which the customers are going to usage. Surveys are conducted in the form of questionnaire designed by our own analyst team. Surveys plays an important role in primary research because surveys helps us to identify the key target audiences of the market. Additionally, surveys helps to identify the key target audience engaged with the market. Our survey team conducts the survey by targeting the key audience, thus gaining insights from them. Based on the perspectives of the customers, this information is utilized to formulate market strategies. Moreover, market surveys helps us to understand the current competitive situation of the industry. To be precise, our survey process typically involve with the 360 analysis of the market. This analytical process begins by identifying the prospective customers for a product or service related to the market/industry to obtain data on how a product/service could fit into customers’ lives.

Secondary Research: The secondary data sources includes information published by the on-profit organizations such as World bank, WHO, company fillings, investor presentations, annual reports, national government documents, statistical databases, blogs, articles, white papers and others. From the annual report, we analyse a company’s revenue to understand the key segment and market share of that organization in a particular region. We analyse the company websites and adopt the product mapping technique which is important for deriving the segment revenue. In the product mapping method, we select and categorize the products offered by the companies catering to domain specific market, deduce the product revenue for each of the companies so as to get overall estimation of the market size. We also source data and analyses trends based on information received from supply side and demand side intermediaries in the value chain. The supply side denotes the data gathered from supplier, distributor, wholesaler and the demand side illustrates the data gathered from the end customers for respective market domain.

The supply side for a domain specific market is analysed by:
The demand side for the market is estimated through:
In-house Library: Apart from these third-party sources, we have our in-house library of qualitative and quantitative information. Our in-house database includes market data for various industry and domains. These data are updated on regular basis as per the changing market scenario. Our library includes, historic databases, internal audit reports and archives.
Sometimes there are instances where there is no metadata or raw data available for any domain specific market. For those cases, we use our expertise to forecast and estimate the market size in order to generate comprehensive data sets. Our analyst team adopt a robust research technique in order to produce the estimates:
Data Synthesis: This stage involves the analysis & mapping of all the information obtained from the previous step. It also involves in scrutinizing the data for any discrepancy observed while data gathering related to the market. The data is collected with consideration to the heterogeneity of sources. Robust scientific techniques are in place for synthesizing disparate data sets and provide the essential contextual information that can orient market strategies. The Brainy Insights has extensive experience in data synthesis where the data passes through various stages:


Market Deduction & Formulation: The final stage comprises of assigning data points at appropriate market spaces so as to deduce feasible conclusions. Analyst perspective & subject matter expert based holistic form of market sizing coupled with industry analysis also plays a crucial role in this stage.
This stage involves in finalization of the market size and numbers that we have collected from data integration step. With data interpolation, it is made sure that there is no gap in the market data. Successful trend analysis is done by our analysts using extrapolation techniques, which provide the best possible forecasts for the market.
Data Validation & Market Feedback: Validation is the most important step in the process. Validation & re-validation via an intricately designed process helps us finalize data-points to be used for final calculations.

The Brainy Insights interacts with leading companies and experts of the concerned domain to develop the analyst team’s market understanding and expertise. It improves and substantiates every single data presented in the market reports. The data validation interview and discussion panels are typically composed of the most experienced industry members. The participants include, however, are not limited to:
Moreover, we always validate our data and findings through primary respondents from all the major regions we are working on.


Free Customization
Fortune 500 Clients
Free Yearly Update On Purchase Of Multi/Corporate License
Companies Served Till Date